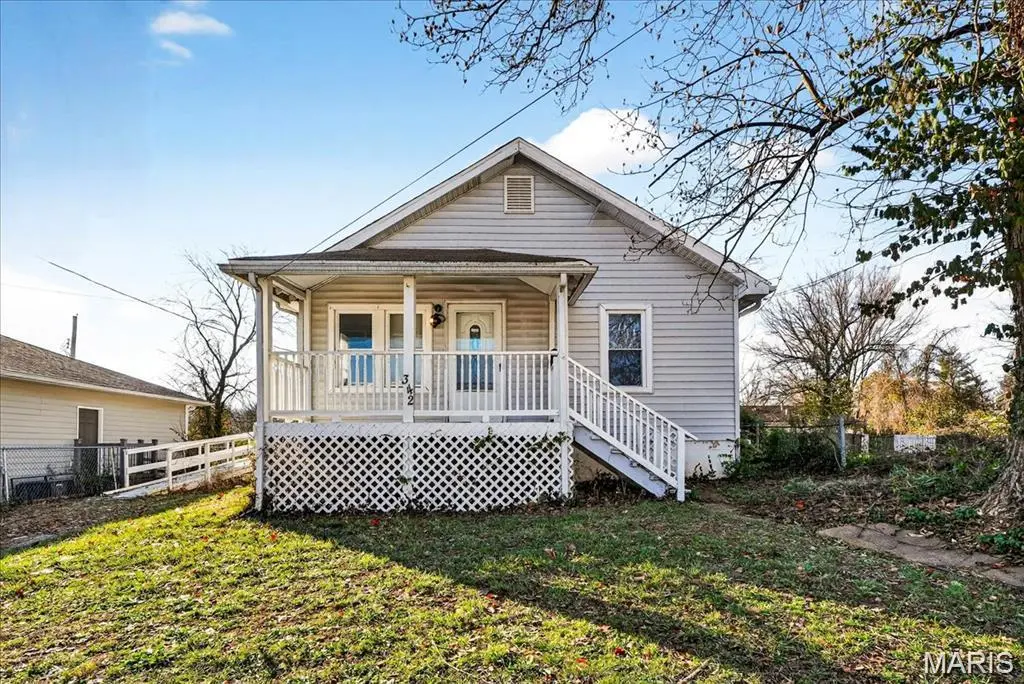
342 Alsobrook St · Kirkwood, MO
Flood risk 1/10 · Minimal
- FEMA flood zone
- X (unshaded)
- Chance of flooding over 30 yrs
- 0.0%
- Est. flood insurance / yr
- $473 – $860
Fire risk 1/10 · Minimal
- Est. fire insurance / yr
- $1,054 – $1,958
Heat risk 5/10 · Moderate
- Hot days now (above 107°F)
- 7 days/yr
- Hot days in 30 yrs
- 21 days/yr
Wind risk 2/10 · Minimal
- Chance of severe wind over 30 yrs
- 1.0%
Air-quality risk 3/10 · Minor
- Unhealthy air days now
- 2 days/yr
- Unhealthy air days in 30 yrs
- 4 days/yr
Risk factors via First Street. Map © Google.
Why this score? — see what drove the A- grade
The composite is a weighted blend of 9 inputs, each scored 0–100. Each bar is that input's sub-score; the figure is the points it added to the 100-point composite (weight × sub-score).
- Cash flow +30.0/30.0
- ARV discount +15.0/15.0
- 1% rule +10.0/10.0
- DSCR +10.0/10.0
- Schools +5.7/10.0
- Rent growth +4.2/5.0
- Livability +3.9/5.0
- Condition / age +2.5/5.0
- Appreciation +0.0/10.0
$129,900
🖨 Deal sheet 📄 Offer letter ✓ Due diligence
Listing remarks
This 4-bedroom ranch offers a solid foundation of updates and is ready for your finishing touches. Enjoy peace of mind with improvements including newer doors and windows, ceramic tile flooring that highlights the spacious eat-in kitchen, updated panel, and portions of PVC plumbing. An inviting covered front porch welcomes you home, while an additional covered porch in the backyard provides a great space for outdoor entertaining. The vacant lot next door offers exceptional privacy, and off-street driveway parking adds convenience. A full basement provides ample room for storage or future expansion. Located within walking distance to shops, restaurants, Walmart, and just minutes from easily
Key facts
- Covered front porch
- Newer doors
- Full basement
Tags
Property features AI
Finance
- Other: Living area reported as 992 (public records)
- Financial info: Lease not considered; Seller may consider concessions
Exterior
- Parking: Driveway; Off-street parking
- Utilities: Public water; Public sewer; Electric service by Ameren; Cable available; Electricity connected; Water connected; Sewer connected
- Home design: Single-family residence; One level
- Construction: Vinyl siding; Architectural shingle roof; Concrete perimeter foundation; Basement present (concrete, unfinished); Built (year source: public records)
- Exterior features: Covered front porch; Back yard; Gentle sloping to level lot; Chain link fencing; Panel and storm doors; Patio; Ramp
Interior
- Kitchen: Eat-in kitchen
- Bedrooms: 4 bedrooms (all on the main level)
- Flooring: Ceramic tile; Hardwood
- Bathrooms: 1 full bathroom (on the main level)
- Heating & cooling: Forced air heating (natural gas); Central air conditioning (electric)
- Interior features: Ceiling fan(s); Eat-in kitchen; Basement (concrete, unfinished); Living room
- Laundry & utility: Laundry in basement
Neighborhood map
What this means for you Summary
Snapshot
- This is a 3-bed/2.0-bath single-family listed at $130k.
Deal economics
- At list price, monthly cash flow is $697 ($8k/yr) — positive.
- The deal already cash-flows at list — no discount required.
- Meets the 1% rule at list price ($2k rent vs $130k).
- Recommended offer: $126k (3.0% below list) — sets the bar for market timing.
- Cap rate 12.7% vs local median 2.4% in Kirkwood — top-decile yield for the area; either an underpriced asset or a hidden risk that comps aren't pricing in. Stress-test before assuming the spread holds.
Location & tenants
- Location reads 78/100 on livability (#27 in MO, #2,478 nationally) — a middle-class / working-renter tenant base. Strengths: employment A+, housing A+, crime B; Watch: cost of living C-, commute F.
- Kirkwood R-VII (suburban): math 57% / reading 68% proficiency, ranked #5 of 324 in MO (top 2%) — acceptable for families but not a draw, mixed tenant base, ~2y average lease; only 11% free/reduced lunch — higher-income household profile.
- Zoned schools: George R. Robinson Elem. (math 47% / reading 63%, grade C, #185 of 1,115 statewide, top 17%, 493 students, 17% FRL); Kirkwood Sr. High (math 72% / reading 79%, grade A-, #3 of 521 statewide, top 0%, 1,775 students, 11% FRL) — zoned schools at 14% FRL track the district average.
- Market conditions: Rents rising fast (+6.6%/yr); 211 active listings in the ZIP; 5 comparable units currently listed for rent nearby; rentals at typical pace (median 24d on market — plan ~3-4 weeks tenant-placement turnaround); 40% of comp listings sitting > 30 days — soft ceiling on asking rent; high-income renter base; 920 units permitted in St. Louis County in 2024 (250 in 5+ unit buildings).
- This rent is only 17% of the median local income ($136k/yr) — well below the 30% rent-burden line; pricing power to push rent on renewal without tenant pushback.
Forward outlook
- Local home prices are declining (-3.0%/yr); year-one equity from $898 of loan paydown is wiped out by about $4k of value loss. Plan a longer hold.
- At projected returns (-3.0% appreciation + 6.6% rent growth), your $36k cash investment doubles in ~5 years — after that, you're playing with house money.
Negotiation context
- It's been on market 33 days — a 3% lower offer ($126k) is reasonable based on typical stale-listing flexibility.
- 2 sale attempts with the ask held roughly flat each time — persistent listings suggest the price (not the market) is what's stuck; bring a comps-based counter.
- Current owner paid $20k; list at $130k implies a 550% gain — meaningful room to come down on a strong offer.
Risks & watch-outs
- Watch-outs: built in 1942 — expect roof / HVAC / electrical / plumbing capex.
- Climate carrying-cost: extreme-heat days projected 7→21/yr by 2055 (HVAC capex compounding) — expect insurance premiums to compound above CPI over the hold.
Questions for the listing agent
- It's been on market 33 days. Have you received any prior offers? Is the seller open to a 3% concession, seller financing, or rate buy-down credit?
- Built in 1942 — when were the roof, HVAC, electrical panel, plumbing, and water heater last replaced?
- Is there a deadline driving the sale (1031 exchange, divorce, estate, relocation)? That informs how much negotiation room exists.
- Schools are A-rated — typically a magnet for longer-tenancy family renters. What's the average tenant stay here, and is there a school-zone premium baked into asking?
- What's the average days-on-market for RENTAL listings here right now (not sales)? A rising rental-DOM trend means longer vacancies and softer asking-rent achievability than the comps imply.
- What's the recent tenant-quality profile in this submarket — average credit score on applications, eviction rate, late-payment / NSF rate, and stable-employment percentage? A property-management company in the area should have these aggregated.
- How much new for-sale + rental construction is in the pipeline within 1–3 miles? Heavy new supply typically softens prices + rents 12–24 months out; constrained supply supports both.
Investment metrics
- 1% rule
- 1.51% ✓
- Cap rate
- 12.73%
- Cash-on-cash
- 23.00%
- DSCR
- 2.02
- GRM
- 5.5
CMA / ARV
- ARV (on-the-fly)
- $238,080
- Comps found
- 12
Show comp detail 12 sales within ~0.75 mi
| Address | Dist | Beds/Ba | Sqft | Sold | Price | $/sf | Match |
|---|---|---|---|---|---|---|---|
| 730 Samoa Dr | 0.47mi | 3/1.5 | 1,005 (+1%) | 0mo | $315,000 | $313 | 74 |
| 1408 Homecrest Dr | 0.37mi | 3/1.5 | 1,014 (+2%) | 9mo | $235,000 | $232 | 70 |
| 520 Pinellas Dr | 0.34mi | 3/1.0 | 1,040 (+5%) | 2mo | $279,900 | $269 | 70 |
| 556 Joshua Dr | 0.32mi | 3/1.0 | 1,040 (+5%) | 6mo | $249,995 | $240 | 68 |
| 621 Pinellas Dr | 0.42mi | 3/2.0 | 1,040 (+5%) | 9mo | $179,500 | $173 | 65 |
| 210 Monica Dr | 0.46mi | 3/1.0 | 945 (-5%) | 3mo | $199,000 | $211 | 64 |
| 535 Rayburn Ave | 0.37mi | 3/1.5 | 936 (-6%) | 9mo | $300,000 | $321 | 64 |
| 216 Monica Dr | 0.46mi | 3/1.0 | 1,028 (+4%) | 9mo | $199,900 | $194 | 61 |
| 1323 Samoa Dr | 0.61mi | 2/1.5 (-1) | 1,005 (+1%) | 4mo | $250,000 | $249 | 59 |
| 600 Norton Ave | 0.62mi | 2/1.0 (-1) | 1,032 (+4%) | 8mo | $245,000 | $237 | 49 |
| 613 S Fillmore Ave | 0.57mi | 2/1.0 (-1) | 1,092 (+10%) | 2mo | $249,900 | $229 | 46 |
| 418 E Elliott Ave | 0.70mi | 3/1.0 | 864 (-13%) | 10mo | $274,900 | $318 | 34 |
Match score weights: distance 35% · size 25% · config 20% · recency 20%. Top-matched comps best support the ARV.
Projected returns pro-forma
-3.0% appreciation · 6.63% rent growth · sell at horizon
- IRR
- 19.9%
- Equity multiple
- 1.85×
- Total profit
- $30,800
- Equity at exit
- $19,369
- IRR
- 30.5%
- Equity multiple
- 4.22×
- Total profit
- $116,939
- Equity at exit
- $11,231
Cash invested: $36,372 (down + closing). Projections, not guarantees.
Landlord ↔ Tenant lean methodology
- Overall (STATE)
- 81 Strongly Landlord-Friendly
- State Missouri
- 81 Strongly Landlord-Friendly · R+10
- County
- — inherits STATE
- City
- — inherits STATE
ZIP-level market 63122
- Rents YoY
- 6.6%
- Active inventory
- 211
- Price-to-rent
- 5.5×
Monthly cashflow live
- Estimated rent
- $1,967 medium interval (Pro) →
- Mortgage (P&I)
- −$681
- Tax from tax record
- −$122 /mo · $1,461/yr
- Insurance
- −$54
- HOA
- −$0
- Vacancy / Maint / Mgmt
- −$413
- Net cashflow
- $697
Break-even live
UW: 25.0% down · 7.5% · 30yr · 1.5% tax · 5.0% vac · 8.0% maint · 8.0% mgmt
Financing live
Cash to close
- Down payment
- $32,475
- Closing costs
- $3,897
- Reserves months
- —
- Total cash needed
- —
Loan-product check · same deal, 3 products live
Conventional
25% down · 7.5% · 30yr
- Down + closing
- —
- Monthly P&I
- —
- Monthly cashflow
- —
- DSCR
- —
- Eligible?
- —
Personal DTI + credit; lowest rate.
DSCR
20% down · 8.5% · 30yr
- Down + closing
- —
- Monthly P&I
- —
- Monthly cashflow
- —
- DSCR
- —
- Eligible?
- —
No personal income docs; deal must DSCR.
Hard money
10% down · 12.0% · 12mo
- Down + closing
- —
- Monthly P&I
- —
- Monthly cashflow
- —
- DSCR
- —
- Eligible?
- —
Short-term bridge; refi at stabilization.
Rent comps 5 comps
| Address | Beds | Baths | Sqft | Rent | $/sqft | DOM | Units | Dist |
|---|---|---|---|---|---|---|---|---|
| 907 Carriage Circle Ln Unit 901F-CCL Kirkwood, MO | 2.0 | 2.0 | 985 | $1,750 | $1.78 | 43d | 1 | 0.24mi |
| 10820 Big Bend Rd Kirkwood, MO | 2.0 | 1.0 | 1000 | $1,595 | $1.59 | 43d | 1 | 0.57mi |
| 467 S Holmes Ave Unit B Kirkwood, MO | 2.0 | 1.0 | 700 | $1,099 | $1.57 | 23d | 1 | 0.84mi |
| 141 E Madison Ave Kirkwood, MO | 1.0–2.0 | 1.0–2.0 | 1017 | $2,765 | $2.72 | 1d | 9 | 1.13mi |
| 416 N Kirkwood Rd St. Louis, MO | 2.0 | 1.0–2.0 | 890 | $3,751 | $4.21 | 1d | 6 | 1.48mi |
Listing history 18 events
-
2026-06-18days on market $129,900 Active 33 DOM
-
2026-06-17days on market $129,900 Active 32 DOM
-
2026-06-16days on market $129,900 Active 31 DOM
-
2026-06-15days on market $129,900 Active 30 DOM
-
2026-06-13days on market $129,900 Active 28 DOM
-
2026-06-13days on market $129,900 Active 27 DOM
-
2026-06-09days on market $129,900 Active 24 DOM
-
2026-06-08days on market $129,900 Active 23 DOM
-
2026-06-07days on market $129,900 Active 22 DOM
-
2026-06-03days on market $129,900 Active 18 DOM
-
2026-06-02days on market $129,900 Active 17 DOM
-
2026-06-01days on market $129,900 Active 16 DOM
-
2026-05-31days on market $129,900 Active 15 DOM
-
2026-05-16$129,900 Active
-
2025-12-10$159,900 Active
-
2004-07-14soldstatus $20,000
-
2004-01-16soldstatus $20,000
-
1992-10-21soldstatus
ⓘ Source: listings_history table (triggers on properties + properties_extension) + one-shot
backfill from property_details.listing_events for pre-trigger history.
Tax reassessment forecast MO · Resets to sale price
- Current annual tax
- $1,461 · $122/mo
- Projected year-2 tax
- $1,461 · $122/mo
- Expected delta
- $0/yr ($0/mo · 0.0%)
ⓘ Screening estimate from a state-policy table — verify with the county assessor before closing.
Climate risk First Street
- Flood 1/10 Low FEMA zone X (unshaded) · 0% chance over 30 yrs
- Wildfire 1/10 Low
- Heat 5/10 Major 7 d/yr ≥107°F today · 21 d/yr by 30 yrs out
- Wind 2/10 Low 100% chance of damaging wind over 30 yrs
- Air quality 3/10 Moderate 2 unhealthy d/yr today · 4 by 30 yrs out
Nearby sold comps map
Loading sold comps map…
Walkable amenities ~0.75 mi
Loading nearby amenities…
Taxation est. · year 1
- Rental income
- $23,607
- − Mortgage interest
- −$7,276
- − Property taxes
- −$1,461
- − Insurance
- −$650
- − Repairs & maintenance
- −$1,889
- − Management
- −$1,889
- − Depreciation
- −$3,779
- Taxable income
- $6,665
- Est. tax owed @ 24.0%
- −$1,600
- After-tax cash flow
- $6,766/yr
For passive investors: Depreciation is non-cash, so a rental often shows a tax loss while cash-flowing — sheltering income. Rental losses are passive: they offset passive income freely, and up to $25,000/yr can offset ordinary (W-2) income if you actively participate and your MAGI is under $100k (phasing out to $0 by $150k); unused losses carry forward. On sale, claimed depreciation is recaptured at up to 25%, and gains may owe capital-gains tax (a 1031 exchange can defer both). Figures are a year-1 estimate at your 24.0% rate — not tax advice; consult a CPA.
Schools (NCES district)
- District
- Kirkwood R-VII
- NCES district ID
- 2916770
- Math proficiency
- 57% ▼ -9.00%
- Reading proficiency
- 68% ▼ -5.00%
- Median HH income
- $85,581
- Composite
- 56.51/100
- National rank
- #1153
- State rank
- #5 of 324 in MO
Livability — Kirkwood
- Score
- 78/100
- State rank
- #27
- US rank
- #2478
Category grades
Schools grade is shown separately in the Schools card above.
Census & demographics
- Census place
- Kirkwood, MO
- County
- Saint Louis County · 888,823 people
- City population
- 41,634
- Metro
- St. Louis, MO-IL
- Population (ZIP)
- 41,634
- Household income
- $136,385
- Rent vs Own
- Severe rent burden
- 738.0
Population outlook (St. Louis County) Hauer SSP2
- Today (2025)
- 1,025,227 people
- By 2030
- 1,028,023 · +0.3%
- By 2040
- 1,020,940 · -0.4%
- By 2050
- 1,007,280 · -1.8%
- By 2075
- 987,277 · -3.7%
- By 2100
- 921,984 · -10.1%
Race, ethnicity, and origin ACS 2023
- Neighborhood character
- Predominantly White (84%)
- Race & ethnicity
- White 84% Two or more races 8% Black 4% Hispanic / Latino 2% Asian 2%
- Common ancestry
- Lithuanian 3% Italian 3% Slovak 3%
- Foreign-born
- 3% · Canada, China
- Languages at home
- 96% English-only · Spanish 1% Other Indo-European 1% Chinese 1%
Political lean MEDSL · St. Louis
- 2024 margin
- Strong D (+23.4) · D 60.8% · R 37.4% · Other 1.7%
- 2008→2024 swing
- +3.5pp toward D · 2008: 19.9pp · 2024: 23.4pp
- All cycles
- 2024: D+23.4 2020: D+24.0 2016: D+16.2 2012: D+13.7 2008: D+19.9
Not yet ingested
- Civics
- —
Market trends
- HPI YoY
- ▼ -413.98%
- Current HPI
- 242.2782
- Rent YoY
- ▲ 6.63%
- Metro
- St. Louis, MO-IL
- State GDP YoY
- ▲ 1.84%
- F500 in state
- 20
Industry mix (Fortune 500 HQ in MO)
| Industry | F500 HQs | Revenue |
|---|---|---|
| Healthcare | 1 | $163B |
|
||
| Insurance | 1 | $21B |
|
||
| Industrial Technology | 1 | $17B |
|
||
| Retail | 1 | $16B |
|
||
| Industrial Distribution | 1 | $10B |
|
||
| Utilities | 1 | $9B |
|
||
Price history
+549.5% since first listed5 events — show timeline
- 2026-05-16 Listed $129,900 MARIS as Distributed by MLS Grid
- 2025-12-10 Listed $159,900 MARIS as Distributed by MLS Grid
- 2004-07-14 Sold (Public Records) $20,000 Public Records
- 2004-01-16 Sold (Public Records) $20,000 Public Records
- 1992-10-21 Sold (Public Records) — Public Records
Property tax history
+15.0%/yrLatest (2022): $1,461 · +10.5% YoY. Source: county tax records.
Cash-flow waterfall
monthlySold comps — $/sqft
last 12 mo · ≤1 miLoading sold comps…