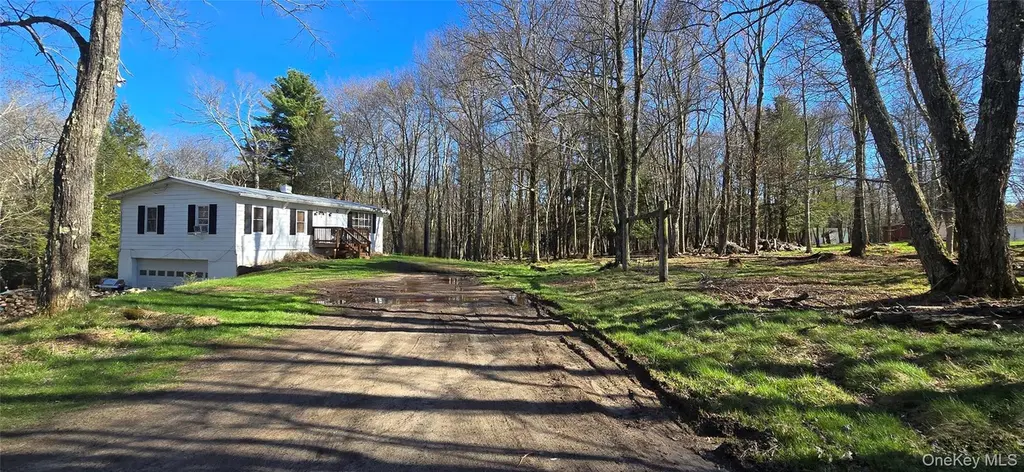
42 Back Shandelee Rd · Livingston Manor, NY
Flood risk 1/10 · Minimal
- FEMA flood zone
- X (unshaded)
- Chance of flooding over 30 yrs
- 0.0%
- Est. flood insurance / yr
- $473 – $860
Fire risk 3/10 · Minor
- Est. fire insurance / yr
- $691 – $1,283
Heat risk 1/10 · Minimal
- Hot days now (above 87°F)
- 7 days/yr
- Hot days in 30 yrs
- 16 days/yr
Wind risk 2/10 · Minimal
- Chance of severe wind over 30 yrs
- 1.0%
Air-quality risk 2/10 · Minimal
- Unhealthy air days now
- 0 days/yr
- Unhealthy air days in 30 yrs
- 1 days/yr
Risk factors via First Street. Map © Google.
Why this score? — see what drove the C grade
The composite is a weighted blend of 9 inputs, each scored 0–100. Each bar is that input's sub-score; the figure is the points it added to the 100-point composite (weight × sub-score).
- Cash flow +18.2/30.0
- Appreciation +10.0/10.0
- ARV discount +7.5/15.0
- DSCR +5.7/10.0
- 1% rule +5.4/10.0
- Schools +4.5/10.0
- Rent growth +2.5/5.0
- Livability +2.5/5.0
- Condition / age +2.5/5.0
$175,000
🖨 Deal sheet (PDF) 📄 Offer letter ✓ Due diligence
Listing remarks
Opportunity meets location in the heart of the Livingston Manor and the scenic Catskill Mountains. Tucked away off the road on 1 private acre with peaceful wooded views, this 3-bedroom, 1-bath home, with an additional home office space offers the perfect setting for those looking to create their own country retreat. 2 bedrooms upstairs and a potential additional bedroom in basement. Set back for added privacy, the property features an attached 2 car garage and full basement. This fixer-upper is ideal for buyers with vision who understand the value of a prime location. Just minutes from the charming downtown of Livingston Manor, enjoy easy access to beloved local shops, restaurants, cafes, a
Key facts
- Private acre
- Full basement
- Prime location
Tags
Property features AI
Exterior
- Parking: Attached private parking; Parking lot; 2-car garage
- Utilities: Septic tank; Cable connected; Electricity connected; Sewer connected; Private trash collection
- Home design: Manufactured house; Single-family residence; Property condition: fixer
- Construction: Block and vinyl siding construction
- Exterior features: Not waterfront; No additional parcels
Interior
- Kitchen: Kitchen island; Pantry
- Bedrooms: Includes a first-floor bedroom
- Bathrooms: 1 full bathroom
- Heating & cooling: Forced air heating (propane); Wall/window air conditioning units
- Interior features: First floor bedroom; First floor full bath; Kitchen island; Pantry; Storage; Home office; Full basement with storage space and walk-out access; Attic: none
- Laundry & utility: Washer; Dryer; Laundry located inside
Neighborhood map
What this means for you Summary
Snapshot
- This is a 2-bed/1.0-bath single-family listed at $175k.
Deal economics
- At list price, monthly cash flow is $158 ($2k/yr) — positive.
- The deal already cash-flows at list — no discount required.
- Meets the 1% rule at list price ($2k rent vs $175k).
- Recommended offer: $170k (3.0% below list) — sets the bar for market timing.
- Cap rate 7.4% vs local median 2.9% in Livingston Manor — top-decile yield for the area; either an underpriced asset or a hidden risk that comps aren't pricing in. Stress-test before assuming the spread holds.
Location & tenants
- Location reads 50/100 on livability (#1,173 in NY) — a working-class tenant base; expect higher turnover. Strengths: crime A; Watch: amenities F, commute F, employment F.
- Livingston Manor Central School District (rural): math 55% / reading 45% proficiency, ranked #456 of 755 in NY (top 60%) — acceptable for families but not a draw, mixed tenant base, ~2y average lease.
- Zoned schools: Livingston Manor Elementary School (math 62% / reading 62%, grade B, #675 of 2,108 statewide, top 35%, 227 students, 40% FRL); Livingston Manor High School (math 62% / reading 44%, grade C-, #934 of 1,100 statewide, top 86%, 179 students, 49% FRL) — zoned schools at 44% FRL track the district average.
- Market conditions: 82 active listings in the ZIP; 739 units permitted in Sullivan County in 2024 (5 in 5+ unit buildings).
Forward outlook
- In year one you build about $19k of equity ($1k loan paydown + $18k appreciation (10.0% local appreciation)).
- Sullivan County population projected at -24% by 2050 — secular population decline; favor cash flow + early exit over multi-decade hold.
- At projected returns (10.0% appreciation + 3.0% rent growth), your $49k cash investment doubles in ~3 years — after that, you're playing with house money.
- By year 2, paydown + projected appreciation supports a ~$30k cash-out refi (75% LTV) — recoverable capital for the next deal without selling this one.
Negotiation context
- It's been on market 43 days — a 3% lower offer ($170k) is reasonable based on typical stale-listing flexibility.
- Current owner paid $148k; 18% above their basis — modest negotiation headroom, anchor on the comps not their cost.
Questions for the listing agent
- It's been on market 43 days. Have you received any prior offers? Is the seller open to a 3% concession, seller financing, or rate buy-down credit?
- Built in 1974 — when were the roof, HVAC, electrical panel, plumbing, and water heater last replaced?
- Is there a deadline driving the sale (1031 exchange, divorce, estate, relocation)? That informs how much negotiation room exists.
- Schools are D-rated, which usually means shorter tenancies and higher turnover. Who's the typical renter profile here, and what's been the actual vacancy rate?
- What's the average days-on-market for RENTAL listings here right now (not sales)? A rising rental-DOM trend means longer vacancies and softer asking-rent achievability than the comps imply.
- What's the recent tenant-quality profile in this submarket — average credit score on applications, eviction rate, late-payment / NSF rate, and stable-employment percentage? A property-management company in the area should have these aggregated.
- How much new for-sale + rental construction is in the pipeline within 1–3 miles? Heavy new supply typically softens prices + rents 12–24 months out; constrained supply supports both.
Investment metrics
- 1% rule
- 1.04% ✓
- Cap rate
- 7.38%
- Cash-on-cash
- 3.87%
- DSCR
- 1.17
- GRM
- 8.0
CMA / ARV
- ARV (median comp)
- $363,900
- List price
- $175,000
- Delta
- -51.91%
- Verdict
- UNDERPRICED
- Comps
- 5 within 1.0 mi
Show comp detail 1 sale within ~0.75 mi
| Address | Dist | Beds/Ba | Sqft | Sold | Price | $/sf | Match |
|---|---|---|---|---|---|---|---|
| 65 Shandelee Lake Rd | 0.70mi | 2/2.5 | 1,056 (-8%) | 23mo | $295,000 | $279 | 28 |
Match score weights: distance 35% · size 25% · config 20% · recency 20%. Top-matched comps best support the ARV.
Projected returns pro-forma
10.0% appreciation · 3.0% rent growth · sell at horizon
- IRR
- 27.1%
- Equity multiple
- 3.15×
- Total profit
- $105,442
- Equity at exit
- $157,654
- IRR
- 23.7%
- Equity multiple
- 7.18×
- Total profit
- $302,742
- Equity at exit
- $339,987
Cash invested: $49,000 (down + closing). Projections, not guarantees.
Landlord ↔ Tenant lean methodology
- Overall (STATE)
- 15 Strongly Tenant-Friendly
- State New York
- 15 Strongly Tenant-Friendly · D+10
- County
- — inherits STATE
- City
- — inherits STATE
ZIP-level market 12758
- Home prices YoY
- 15.4%
- Active inventory
- 82
- Price-to-rent
- 8.0×
Monthly cashflow live
- Estimated rent
- $1,823 medium interval (Pro) →
- Mortgage (P&I)
- −$918
- Tax from tax record
- −$292 /mo · $3,503/yr
- Insurance
- −$73
- HOA
- −$0
- Vacancy / Maint / Mgmt
- −$383
- Net cashflow
- $158
Break-even live
Sensitivity live
| Price | -10% $257 | -5% $207 | +0% $158 | +5% $108 | +10% $59 |
|---|---|---|---|---|---|
| Rent | -10% $14 | -5% $86 | +0% $158 | +5% $230 | +10% $302 |
| Rate | -1.0pp $246 | -0.5pp $202 | base $158 | +0.5pp $113 | +1.0pp $66 |
UW: 25.0% down · 7.5% · 30yr · 1.5% tax · 5.0% vac · 8.0% maint · 8.0% mgmt
Financing live
Cash to close
- Down payment
- $43,750
- Closing costs
- $5,250
- Reserves months
- —
- Total cash needed
- —
Loan-product check · same deal, 3 products live
Conventional
25% down · 7.5% · 30yr
- Down + closing
- —
- Monthly P&I
- —
- Monthly cashflow
- —
- DSCR
- —
- Eligible?
- —
Personal DTI + credit; lowest rate.
DSCR
20% down · 8.5% · 30yr
- Down + closing
- —
- Monthly P&I
- —
- Monthly cashflow
- —
- DSCR
- —
- Eligible?
- —
No personal income docs; deal must DSCR.
Hard money
10% down · 12.0% · 12mo
- Down + closing
- —
- Monthly P&I
- —
- Monthly cashflow
- —
- DSCR
- —
- Eligible?
- —
Short-term bridge; refi at stabilization.
Listing history 12 events
-
2026-06-12statusdays on market $175,000 Pending 43 DOM
-
2026-06-09days on market $175,000 Active 42 DOM
-
2026-06-08days on market $175,000 Active 41 DOM
-
2026-06-07days on market $175,000 Active 40 DOM
-
2026-06-07days on market $175,000 Active 39 DOM
-
2026-06-04days on market $175,000 Active 36 DOM
-
2026-06-02days on market $175,000 Active 35 DOM
-
2026-06-01days on market $175,000 Active 34 DOM
-
2026-05-31days on market $175,000 Active 33 DOM
-
2026-04-28$189,900 Active 1200-char remark
-
2005-12-16soldstatus $148,500
-
2004-11-29soldstatus $64,000
ⓘ Source: listings_history table (triggers on properties + properties_extension) + one-shot
backfill from property_details.listing_events for pre-trigger history.
Tax reassessment forecast NY · Partial reset (capped growth)
- Current annual tax
- $3,503 · $292/mo
- Projected year-2 tax
- $3,503 · $292/mo
- Expected delta
- $0/yr ($0/mo · 0.0%)
ⓘ Screening estimate from a state-policy table — verify with the county assessor before closing.
Climate risk First Street
- Flood 1/10 Low FEMA zone X (unshaded) · 0% chance over 30 yrs
- Wildfire 3/10 Moderate
- Heat 1/10 Low 7 d/yr ≥87°F today · 16 d/yr by 30 yrs out
- Wind 2/10 Low 100% chance of damaging wind over 30 yrs
- Air quality 2/10 Low 0 unhealthy d/yr today · 1 by 30 yrs out
Nearby sold comps map
Loading sold comps map…
Walkable amenities ~0.75 mi
Loading nearby amenities…
Taxation est. · year 1
- Rental income
- $21,881
- − Mortgage interest
- −$9,803
- − Property taxes
- −$3,503
- − Insurance
- −$875
- − Repairs & maintenance
- −$1,750
- − Management
- −$1,750
- − Depreciation
- −$5,091
- Taxable loss
- −$892
- Est. tax savings @ 24.0%
- +$214
- After-tax cash flow
- $2,109/yr
For passive investors: Depreciation is non-cash, so a rental often shows a tax loss while cash-flowing — sheltering income. Rental losses are passive: they offset passive income freely, and up to $25,000/yr can offset ordinary (W-2) income if you actively participate and your MAGI is under $100k (phasing out to $0 by $150k); unused losses carry forward. On sale, claimed depreciation is recaptured at up to 25%, and gains may owe capital-gains tax (a 1031 exchange can defer both). Figures are a year-1 estimate at your 24.0% rate — not tax advice; consult a CPA.
Schools (NCES district)
- District
- Livingston Manor Central School District
- NCES district ID
- 3617580
- Math proficiency
- 55% ▲ 5.00%
- Reading proficiency
- 45% ▬ 0.00%
- Median HH income
- $51,401
- Composite
- 44.96/100
- National rank
- #5872
- State rank
- #456 of 755 in NY
Livability — Livingston Manor
- Score
- 50/100
- State rank
- #1173
- US rank
- #25609
Category grades
Schools grade is shown separately in the Schools card above.
Census & demographics
- Population (ZIP)
- 4,061
Population outlook (Sullivan County) Hauer SSP2
- Today (2025)
- 68,974 people
- By 2030
- 65,609 · -4.9%
- By 2040
- 58,878 · -14.6%
- By 2050
- 52,500 · -23.9%
- By 2075
- 39,941 · -42.1%
- By 2100
- 28,880 · -58.1%
Race, ethnicity, and origin ACS 2023
- Neighborhood character
- Predominantly White (85%)
- Race & ethnicity
- White 85% Two or more races 8% Hispanic / Latino 7% Asian 3%
- Hispanic origin (detail)
- Puerto Rican 3%
- Common ancestry
- Danish 4% Subsaharan African 4% Lithuanian 3%
- Foreign-born
- 9% · Canada, Jamaica, South Korea
- Languages at home
- 90% English-only · Spanish 3% Other Indo-European 3% Russian/Polish/Slavic 2%
Political lean MEDSL · Sullivan
- 2024 margin
- R (+16.7) · D 41.6% · R 58.4%
- 2008→2024 swing
- -26.2pp toward R · 2008: 9.5pp · 2024: -16.7pp
- All cycles
- 2024: R+16.7 2020: R+9.2 2016: R+13.7 2012: D+10.4 2008: D+9.5
Not yet ingested
- Civics
- —
Market trends
- HPI YoY
- ▲ 59.59%
- Current HPI
- 446.6757
- Rent YoY
- —
- Metro
- —
- State GDP YoY
- ▲ 2.60%
- F500 in state
- 92
Industry mix (Fortune 500 HQ in NY)
| Industry | F500 HQs | Revenue |
|---|---|---|
| Financial Services | 10 | $950B |
|
||
| Consumer Goods | 9 | $162B |
|
||
| Insurance | 4 | $225B |
|
||
| Telecommunications | 2 | $144B |
|
||
| Pharmaceuticals | 2 | $112B |
|
||
| Media / Entertainment | 2 | $69B |
|
||
Price history
+173.4% since first listed5 events — show timeline
- 2026-06-10 Pending — OneKey® MLS as Distributed by MLS Grid
- 2026-05-21 Price Changed $175,000 OneKey® MLS as Distributed by MLS Grid
- 2026-04-28 Listed $189,900 OneKey® MLS as Distributed by MLS Grid
- 2005-12-16 Sold (Public Records) $148,500 Public Records
- 2004-11-29 Sold (Public Records) $64,000 Public Records
Property tax history
+2.1%/yrLatest (2025): $3,503 · -11.6% YoY. Source: county tax records.
Cash-flow waterfall
monthlySold comps — $/sqft
last 12 mo · ≤1 miLoading sold comps…