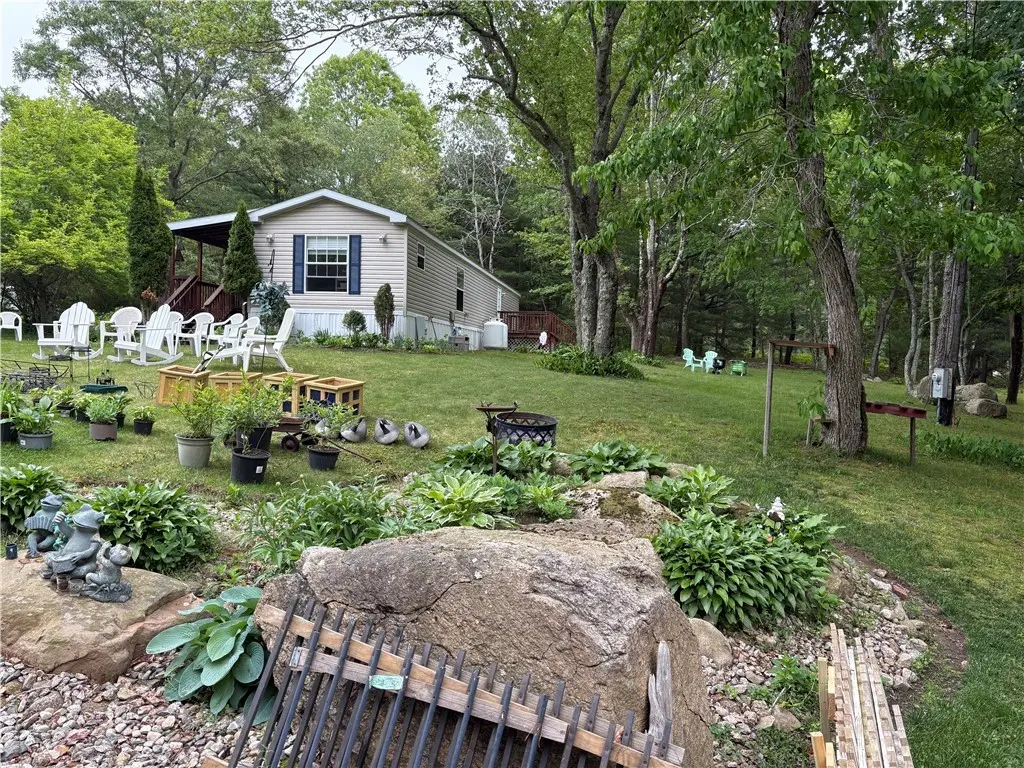
1 Blueberry Heights Way · Greene, RI
Flood risk No data
- FEMA flood zone
- —
- Chance of flooding over 30 yrs
- —
- Est. flood insurance / yr
- —
Fire risk No data
- Est. fire insurance / yr
- —
Heat risk No data
- Hot days now (above threshold)
- —
- Hot days in 30 yrs
- —
Wind risk No data
- Chance of severe wind over 30 yrs
- —
Air-quality risk No data
- Unhealthy air days now
- —
- Unhealthy air days in 30 yrs
- —
Risk factors via First Street. Map © Google.
Why this score? — see what drove the C+ grade
The composite is a weighted blend of 9 inputs, each scored 0–100. Each bar is that input's sub-score; the figure is the points it added to the 100-point composite (weight × sub-score).
- Cash flow +26.0/30.0
- 1% rule +8.8/10.0
- DSCR +8.7/10.0
- ARV discount +7.5/15.0
- Schools +4.1/10.0
- Livability +3.2/5.0
- Rent growth +2.5/5.0
- Condition / age +2.5/5.0
- Appreciation +1.3/10.0
$179,900
🖨 Deal sheet 📄 Offer letter ✓ Due diligence
Listing remarks MLS
WHERE ARE YOU GOING TO FIND A REALLY GREAT HOME UNDER $100,000? RIGHT HERE!!! If you are looking for easy living among the tall pines- this one is for you! Come and see this meticulous two bedroom home in Blueberry Heights and you will be pleasantly surprised by the spacious rooms and the private wooded lot. Built in 2005, pride of ownership abounds inside where you will enjoy an open floor plan with a vaulted ceiling, gorgeous laminate wood flooring and tastefully painted walls and trim. Outside enjoy the serene privacy overlooking the beautiful large treed lot. There is also a nice covered wood deck where you can also enjoy outdoor entertaining or just relax and appreciate the wildlife and pleasant sounds of nature. Blueberry Heights features a low monthly HOA fee which includes snow removal, road maintenance, tree maintenance, trash removal, water and septic. Pets are welcome here with some restriction. Enjoy country living with convenient highway access. Buyers are subject to park approval. Income guidelines also apply. Financing IS available. DON'T DELAY!!!
Key facts
- Covered porch
- Laundry area
- Large pantry closet
Tags
Property features AI
Finance
- Financial info: Has land lease
- HOA & community: Monthly association fee ($325); Community amenities: golf, pool, recreation area, restaurant, shopping, highway access
Exterior
- Parking: No garage
- Utilities: Public water; Circuit breaker electric
- Home design: Single-story home
- Construction: Drywall; Vinyl siding
- Exterior features: Deck; Porch; Outbuilding
Interior
- Kitchen: Oven; Range; Range hood; Refrigerator; Exhaust fan
- Bedrooms: Bedroom 2 on the first level
- Flooring: Laminate
- Bathrooms: 1 full bathroom
- Heating & cooling: Gas heating; Propane heating
- Interior features: Thermal windows; Storm door(s); Cathedral ceilings; Vaulted ceiling(s); High ceilings; Tub with shower
- Laundry & utility: Washer; Dryer; Electric and gas water heaters
Neighborhood map
What this means for you Summary
Snapshot
- This is a 2-bed/1.0-bath manufactured listed at $180k.
Deal economics
- At list price, monthly cash flow is $445 ($5k/yr) — positive.
- The deal already cash-flows at list — no discount required.
- Meets the 1% rule at list price ($2k rent vs $180k).
- Cap rate 9.3% vs local median 2.7% in Greene — top-decile yield for the area; either an underpriced asset or a hidden risk that comps aren't pricing in. Stress-test before assuming the spread holds.
Location & tenants
- Location reads 64/100 on livability (#25 in RI) — a middle-class / working-renter tenant base. Strengths: crime A+, employment A+, housing A+; Watch: cost of living C-, schools D+, amenities F.
- Exeter-West Greenwich (rural): math 39% / reading 48% proficiency, ranked #11 of 39 in RI (top 28%) — families likely to look elsewhere, expect single-tenant / working-renter base with shorter leases; only 12% free/reduced lunch — higher-income household profile.
- Market conditions: 22 active listings in the ZIP; high-income renter base; 471 units permitted in Kent County in 2024 (240 in 5+ unit buildings).
Forward outlook
- Local home prices are declining (-3.0%/yr); year-one equity from $1k of loan paydown is wiped out by about $5k of value loss. Plan a longer hold.
- Kent County population projected at -14% by 2050 — secular population decline; favor cash flow + early exit over multi-decade hold.
Negotiation context
- Only 4 days on market — expect competitive offers; lowballing is unlikely to land.
- 6 sale attempts since 30y ago with the ask held roughly flat each time — persistent listings suggest the price (not the market) is what's stuck; bring a comps-based counter.
- Current owner paid $90k; list at $180k implies a 100% gain — meaningful room to come down on a strong offer.
Questions for the listing agent
- What does the HOA fee cover, when was the last increase, and are there any pending special assessments or reserve-fund shortfalls?
- Is there a deadline driving the sale (1031 exchange, divorce, estate, relocation)? That informs how much negotiation room exists.
- Schools are D-rated, which usually means shorter tenancies and higher turnover. Who's the typical renter profile here, and what's been the actual vacancy rate?
- What's the average days-on-market for RENTAL listings here right now (not sales)? A rising rental-DOM trend means longer vacancies and softer asking-rent achievability than the comps imply.
- What's the recent tenant-quality profile in this submarket — average credit score on applications, eviction rate, late-payment / NSF rate, and stable-employment percentage? A property-management company in the area should have these aggregated.
- How much new for-sale + rental construction is in the pipeline within 1–3 miles? Heavy new supply typically softens prices + rents 12–24 months out; constrained supply supports both.
Investment metrics
- 1% rule
- 1.38% ✓
- Cap rate
- 9.26%
- Cash-on-cash
- 10.60%
- DSCR
- 1.47
- GRM
- 6.1
CMA / ARV
No comps found within radius.
Projected returns pro-forma
-3.0% appreciation · 3.0% rent growth · sell at horizon
- IRR
- -0.3%
- Equity multiple
- 0.99×
- Total profit
- $-604
- Equity at exit
- $26,824
- IRR
- 9.4%
- Equity multiple
- 1.73×
- Total profit
- $36,795
- Equity at exit
- $15,554
Cash invested: $50,372 (down + closing). Projections, not guarantees.
Landlord ↔ Tenant lean methodology
- Overall (STATE)
- 31 Tenant-Leaning
- State Rhode Island
- 31 Tenant-Leaning · D+8
- County
- — inherits STATE
- City
- — inherits STATE
ZIP-level market 02817
- Home prices YoY
- -2.1%
- Active inventory
- 22
- Price-to-rent
- 6.1×
Monthly cashflow live
- Estimated rent
- $2,477 medium interval (Pro) →
- Mortgage (P&I)
- −$943
- Tax from tax record
- −$168 /mo · $2,022/yr
- Insurance
- −$75
- HOA
- −$325
- Vacancy / Maint / Mgmt
- −$520
- Net cashflow
- $445
Break-even live
UW: 25.0% down · 7.5% · 30yr · 1.5% tax · 5.0% vac · 8.0% maint · 8.0% mgmt
Financing live
Cash to close
- Down payment
- $44,975
- Closing costs
- $5,397
- Reserves months
- —
- Total cash needed
- —
Loan-product check · same deal, 3 products live
Conventional
25% down · 7.5% · 30yr
- Down + closing
- —
- Monthly P&I
- —
- Monthly cashflow
- —
- DSCR
- —
- Eligible?
- —
Personal DTI + credit; lowest rate.
DSCR
20% down · 8.5% · 30yr
- Down + closing
- —
- Monthly P&I
- —
- Monthly cashflow
- —
- DSCR
- —
- Eligible?
- —
No personal income docs; deal must DSCR.
Hard money
10% down · 12.0% · 12mo
- Down + closing
- —
- Monthly P&I
- —
- Monthly cashflow
- —
- DSCR
- —
- Eligible?
- —
Short-term bridge; refi at stabilization.
HOA detail
- Monthly dues
- $325 · $3,900/yr
- Likely covers
- watertrashsnow removal
Listing history 4 events
-
2026-06-08statusdays on market $179,900 Pending 4 DOM
-
2026-06-07days on market $179,900 Active 3 DOM
-
2026-06-05remarks 699-char remark
-
2026-06-05$179,900 Active 1 DOM
ⓘ Source: listings_history table (triggers on properties + properties_extension) + one-shot
backfill from property_details.listing_events for pre-trigger history.
Tax reassessment forecast RI · Partial reset (capped growth)
- Current annual tax
- $2,022 · $168/mo
- Projected year-2 tax
- $2,477 · $206/mo
- Expected delta
- +$455/yr (+$38/mo · 22.5%)
ⓘ Screening estimate from a state-policy table — verify with the county assessor before closing.
Nearby sold comps map
Loading sold comps map…
Walkable amenities ~0.75 mi
Loading nearby amenities…
Taxation est. · year 1
- Rental income
- $29,725
- − Mortgage interest
- −$10,077
- − Property taxes
- −$2,022
- − Insurance
- −$900
- − Repairs & maintenance
- −$2,378
- − Management
- −$2,378
- − HOA
- −$3,900
- − Depreciation
- −$5,233
- Taxable income
- $2,837
- Est. tax owed @ 24.0%
- −$681
- After-tax cash flow
- $4,660/yr
For passive investors: Depreciation is non-cash, so a rental often shows a tax loss while cash-flowing — sheltering income. Rental losses are passive: they offset passive income freely, and up to $25,000/yr can offset ordinary (W-2) income if you actively participate and your MAGI is under $100k (phasing out to $0 by $150k); unused losses carry forward. On sale, claimed depreciation is recaptured at up to 25%, and gains may owe capital-gains tax (a 1031 exchange can defer both). Figures are a year-1 estimate at your 24.0% rate — not tax advice; consult a CPA.
Schools (NCES district)
- District
- Exeter-West Greenwich
- NCES district ID
- 4400360
- Math proficiency
- 39% ▼ -10.00%
- Reading proficiency
- 48% ▼ -8.00%
- Median HH income
- $84,349
- Composite
- 40.65/100
- National rank
- #3679
- State rank
- #11 of 39 in RI
Livability — Greene
- Score
- 64/100
- State rank
- #25
- US rank
- #13692
Category grades
Schools grade is shown separately in the Schools card above.
Census & demographics
- County
- Kent County · 90,904 people
- City population
- 2,441
- Metro
- Providence-Warwick, RI-MA
- Population (ZIP)
- 6,647
- Household income
- $135,625
- Rent vs Own
- Severe rent burden
- 29.0
Population outlook (Kent County) Hauer SSP2
- Today (2025)
- 160,994 people
- By 2030
- 157,428 · -2.2%
- By 2040
- 148,389 · -7.8%
- By 2050
- 137,995 · -14.3%
- By 2075
- 118,536 · -26.4%
- By 2100
- 102,266 · -36.5%
Race, ethnicity, and origin ACS 2023
- Neighborhood character
- Predominantly White (84%)
- Race & ethnicity
- White 84% Hispanic / Latino 8% Two or more races 8% Asian 1%
- Hispanic origin (detail)
- Mexican 1% Puerto Rican 2% Cuban 2%
- Common ancestry
- Lithuanian 7% Slovak 7% Russian 5%
- Foreign-born
- 10% · Canada, Guatemala, China
- Languages at home
- 88% English-only · Spanish 7% Other Indo-European 3% Chinese 1%
Political lean MEDSL · Kent
- 2024 margin
- Toss-up / Even · D 49.9% · R 48.1% · Other 2.0%
- 2008→2024 swing
- -15.6pp toward R · 2008: 17.5pp · 2024: 1.9pp
- All cycles
- 2024: D+1.9 2020: D+7.6 2016: R+0.7 2012: D+18.4 2008: D+17.5
Not yet ingested
- Civics
- —
Market trends
- HPI YoY
- ▼ -7.47%
- Current HPI
- 350.6247
- Rent YoY
- —
- Metro
- Providence-Warwick, RI-MA
- State GDP YoY
- ▲ 2.25%
- F500 in state
- 10
Industry mix (Fortune 500 HQ in RI)
| Industry | F500 HQs | Revenue |
|---|---|---|
| Healthcare | 1 | $373B |
|
||
| Food Distribution | 1 | $31B |
|
||
| Aerospace / Defense | 1 | $14B |
|
||
| Financial Services | 1 | $8B |
|
||
| Consumer Goods | 1 | $4B |
|
||
Price history
+350.9% since first listed15 events — show timeline
- 2026-06-04 Listed $179,900 RIS
- 2019-09-11 Sold (MLS) $90,000 RIS
- 2019-08-26 Contingent — RIS
- 2019-08-20 Listed $99,900 RIS
- 2019-08-17 Listing Removed — RIS
- 2019-07-18 Relisted — RIS
- 2019-06-04 Contingent — RIS
- 2019-04-16 Price Changed $107,500 RIS
- 2019-02-13 Listed $112,500 RIS
- 2015-04-15 Sold (Public Records) $45,500 Public Records
- 2015-04-15 Sold (MLS) $45,500 RIS
- 2015-03-23 Pending — RIS
- 2015-03-11 Listed $47,500 RIS
- 1996-09-27 Sold (MLS) $34,500 RIS
- 1996-05-10 Listed $39,900 RIS
Property tax history
+5.3%/yrLatest (2025): $2,022 · +0.0% YoY. Source: county tax records.
Cash-flow waterfall
monthlySold comps — $/sqft
last 12 mo · ≤1 miLoading sold comps…