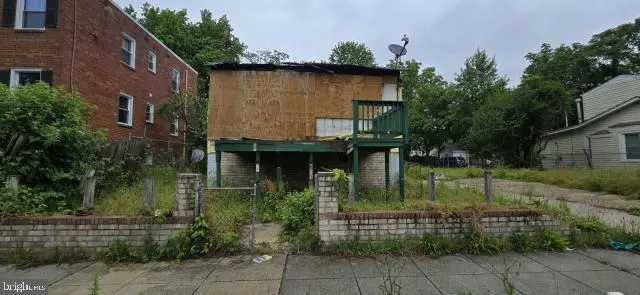
118 Yuma St SE · Washington, DC
Flood risk 6/10 · Moderate
- FEMA flood zone
- AE
- Chance of flooding over 30 yrs
- 0.75%
- Est. flood insurance / yr
- $2,026 – $9,024
Fire risk 2/10 · Minimal
- Est. fire insurance / yr
- $631 – $1,173
Heat risk 8/10 · Major
- Hot days now (above 104°F)
- 7 days/yr
- Hot days in 30 yrs
- 16 days/yr
Wind risk 4/10 · Minor
- Chance of severe wind over 30 yrs
- 21.0%
Air-quality risk 3/10 · Minor
- Unhealthy air days now
- 2 days/yr
- Unhealthy air days in 30 yrs
- 3 days/yr
Risk factors via First Street. Map © Google.
Why this score? — see what drove the B grade
The composite is a weighted blend of 9 inputs, each scored 0–100. Each bar is that input's sub-score; the figure is the points it added to the 100-point composite (weight × sub-score).
- Cash flow +30.0/30.0
- 1% rule +10.0/10.0
- DSCR +10.0/10.0
- ARV discount +7.5/15.0
- Livability +3.7/5.0
- Schools +3.6/10.0
- Rent growth +3.5/5.0
- Condition / age +2.5/5.0
- Appreciation +0.0/10.0
$100,000
🖨 Deal sheet 📄 Offer letter ✓ Due diligence
Listing remarks
Value is in the land. Homes needs renovation. Nestled in the charming Washington Highlands neighborhood, this delightful potenial home offers a perfect blend of comfort and convenience. The inviting potenial layout is perfect for both relaxation and entertaining, while the generous 0.22-acre lot provides ample outdoor space for gardening or play. Enjoy the tranquility of urban living while being just moments away from local parks, shops, and dining options. The community is known for its friendly atmosphere and easy access to nearby amenities, making it a wonderful place to call home. Off-street parking adds to the convenience, ensuring you always have a spot waiting for you. With its large
Key facts
- Outdoor space
- Off-street parking
- Local parks
Tags
Property features AI
Finance
- Other: Ground rent paid annually
Exterior
- Parking: Off-street parking
- Utilities: Public water; Public septic
- Home design: Detached property; Fee simple ownership; Year built estimated
- Construction: Vinyl siding exterior; Other foundation
- Exterior features: Above-grade other structures
Interior
- Bedrooms: Three bedrooms on the main level
- Bathrooms: One full bathroom on the main level; One full bathroom total
- Interior features: Estimated living area
Neighborhood map
What this means for you Summary
Snapshot
- This is a 3-bed/1.0-bath single-family listed at $100k.
Deal economics
- At list price, monthly cash flow is $906 ($11k/yr) — positive.
- The deal already cash-flows at list — no discount required.
- Meets the 1% rule at list price ($3k rent vs $100k).
- Cap rate 22.7% vs local median 2.5% in Washington — top-decile yield for the area; either an underpriced asset or a hidden risk that comps aren't pricing in. Stress-test before assuming the spread holds.
Location & tenants
- Location reads 73/100 on livability (#1 in DC) — a middle-class / working-renter tenant base. Strengths: amenities A+, commute A+, employment A+; Watch: crime F, cost of living F.
- District Of Columbia Public Schools (urban): math 33% / reading 40% proficiency, ranked #8 of 32 in DC (top 25%) — families likely to look elsewhere, expect single-tenant / working-renter base with shorter leases; 65% free/reduced lunch — lower-income household profile, screen leases tightly.
- Market conditions: Rents rising (+4.0%/yr); 145 active listings in the ZIP; 34 comparable units currently listed for rent nearby; rentals at typical pace (median 22d on market — plan ~3-4 weeks tenant-placement turnaround); 1,737 units permitted in District of Columbia in 2024 (1,506 in 5+ unit buildings).
- At $2,604/mo this rent would consume 64% of the median local household income ($49k/yr) (locally 4530% of renters already pay >50% of income on rent) — very limited rent-growth headroom before tenants either downsize or default.
Forward outlook
- Local home prices are declining (-3.0%/yr); year-one equity from $691 of loan paydown is wiped out by about $3k of value loss. Plan a longer hold.
- District of Columbia County population projected at +50% by 2050 — long-run rental-demand tailwind backs the buy-and-hold thesis.
- At projected returns (-3.0% appreciation + 4.0% rent growth), your $28k cash investment doubles in ~3 years — after that, you're playing with house money.
Negotiation context
- Only 2 days on market — expect competitive offers; lowballing is unlikely to land.
Risks & watch-outs
- Watch-outs: flood insurance adds $460/mo; built in 1956 — expect roof / HVAC / electrical / plumbing capex.
- Climate carrying-cost: in FEMA flood zone AE (mandatory federal flood insurance); extreme-heat days projected 7→16/yr by 2055 (HVAC capex compounding) — expect insurance premiums to compound above CPI over the hold.
Questions for the listing agent
- Built in 1956 — when were the roof, HVAC, electrical panel, plumbing, and water heater last replaced?
- What's the actual annual flood-insurance premium (NFIP or private), and is the property in a SFHA with mandatory coverage?
- Is there a deadline driving the sale (1031 exchange, divorce, estate, relocation)? That informs how much negotiation room exists.
- Crime grade is F in this area — have there been break-ins, vandalism, or insurance claims at this property in the last 3 years? What carrier currently insures it and at what premium?
- What's the average days-on-market for RENTAL listings here right now (not sales)? A rising rental-DOM trend means longer vacancies and softer asking-rent achievability than the comps imply.
- What's the recent tenant-quality profile in this submarket — average credit score on applications, eviction rate, late-payment / NSF rate, and stable-employment percentage? A property-management company in the area should have these aggregated.
- How much new for-sale + rental construction is in the pipeline within 1–3 miles? Heavy new supply typically softens prices + rents 12–24 months out; constrained supply supports both.
Investment metrics
- 1% rule
- 2.60% ✓
- Cap rate
- 22.69%
- Cash-on-cash
- 58.54%
- DSCR
- 3.60
- GRM
- 3.2
CMA / ARV
- ARV (on-the-fly)
- $437,518
- Comps found
- 8
Show comp detail 8 sales within ~0.75 mi
| Address | Dist | Beds/Ba | Sqft | Sold | Price | $/sf | Match |
|---|---|---|---|---|---|---|---|
| 125 Chesapeake St SW | 0.33mi | 3/2.0 | 1,632 (+6%) | 6mo | $468,833 | $287 | 66 |
| 407 Xenia St SE | 0.26mi | 3/2.5 | 1,440 (-7%) | 10mo | $375,000 | $260 | 62 |
| 827 Yuma St SE | 0.63mi | 3/1.5 | 1,520 (-2%) | 13mo | $260,000 | $171 | 55 |
| 125 Atlantic St SE | 0.10mi | 3/2.0 | 1,339 (-13%) | 19mo | $430,000 | $321 | 53 |
| 3935 Martin Luther King Jr Ave SW | 0.23mi | 3/2.5 | 1,712 (+11%) | 20mo | $301,000 | $176 | 49 |
| 3912 2nd St SW | 0.31mi | 2/2.0 (-1) | 1,749 (+13%) | 8mo | $495,000 | $283 | 48 |
| 3337 5th St SE | 0.64mi | 3/2.5 | 1,736 (+12%) | 1mo | $524,000 | $302 | 43 |
| 3226 4th St SE | 0.72mi | 3/1.5 | 1,688 (+9%) | 9mo | $235,000 | $139 | 42 |
Match score weights: distance 35% · size 25% · config 20% · recency 20%. Top-matched comps best support the ARV.
Projected returns pro-forma
-3.0% appreciation · 3.96% rent growth · sell at horizon
- IRR
- 36.6%
- Equity multiple
- 2.58×
- Total profit
- $44,336
- Equity at exit
- $14,910
- IRR
- 43.9%
- Equity multiple
- 5.46×
- Total profit
- $124,812
- Equity at exit
- $8,646
Cash invested: $28,000 (down + closing). Projections, not guarantees.
Landlord ↔ Tenant lean methodology
- Overall (CITY)
- 0 Strongly Tenant-Friendly
- State District of Columbia
- 12 Strongly Tenant-Friendly · D+43
- County
- — inherits STATE
- City Washington
- 0 Strongly Tenant-Friendly · D+43
ZIP-level market 20032
- Home prices YoY
- -15.6%
- Rents YoY
- 4.0%
- Active inventory
- 145
- Price-to-rent
- 3.2×
Monthly cashflow live
- Estimated rent
- $2,604 high interval (Pro) →
- Mortgage (P&I)
- −$524
- Tax est. 1.5%
- −$125 /mo · $1,500/yr
- Insurance
- −$42
- Flood insurance flood zone
- −$460 /mo · $5,525/yr
- HOA
- −$0
- Vacancy / Maint / Mgmt
- −$547
- Net cashflow
- $906
Break-even live
UW: 25.0% down · 7.5% · 30yr · 1.5% tax · 5.0% vac · 8.0% maint · 8.0% mgmt
Financing live
Cash to close
- Down payment
- $25,000
- Closing costs
- $3,000
- Reserves months
- —
- Total cash needed
- —
Loan-product check · same deal, 3 products live
Conventional
25% down · 7.5% · 30yr
- Down + closing
- —
- Monthly P&I
- —
- Monthly cashflow
- —
- DSCR
- —
- Eligible?
- —
Personal DTI + credit; lowest rate.
DSCR
20% down · 8.5% · 30yr
- Down + closing
- —
- Monthly P&I
- —
- Monthly cashflow
- —
- DSCR
- —
- Eligible?
- —
No personal income docs; deal must DSCR.
Hard money
10% down · 12.0% · 12mo
- Down + closing
- —
- Monthly P&I
- —
- Monthly cashflow
- —
- DSCR
- —
- Eligible?
- —
Short-term bridge; refi at stabilization.
Rent comps 34 comps
| Address | Beds | Baths | Sqft | Rent | $/sqft | DOM | Units | Dist |
|---|---|---|---|---|---|---|---|---|
| 147 Mississippi Ave SE Washington, DC | 4.0 | 2.0 | 1459 | $2,795 | $1.92 | 22d | 1 | 0.14mi |
| 4001 S Capitol St SW Washington, DC | 3.0 | 1.0–2.0 | 782 | $2,557 | $3.27 | 13d | 1 | 0.18mi |
| 4281 S Capitol St SW Washington, DC | 3.0 | 3.5 | 1412 | $2,900 | $2.05 | 24d | 1 | 0.31mi |
| 4285 S Capitol St SW Washington, DC | 3.0 | 3.5 | 1152 | $3,500 | $3.04 | 15d | 1 | 0.32mi |
| 4287 S Capitol St SW Washington, DC | 2.0 | 3.5 | 1412 | $2,575 | $1.82 | 24d | 1 | 0.32mi |
| 4306 Halley Ter SE Unit 1 Washington, DC | 4.0 | 2.0 | 1270 | $3,000 | $2.36 | 11d | 1 | 0.32mi |
| 150 Upsal St SE Washington, DC | 2.0 | 3.0 | 1695 | $3,200 | $1.89 | 24d | 1 | 0.43mi |
| 44 Forrester St SW Unit 3 Washington, DC | 3.0 | 2.0 | 1200 | $2,450 | $2.04 | 24d | 1 | 0.51mi |
| 4334 Martin Luther King Jr Ave SW Washington, DC | 3.0 | 2.0 | 1323 | $3,200 | $2.42 | 24d | 1 | 0.54mi |
| 118 Galveston St SW Washington, DC | 1.0–3.0 | 1.0–2.0 | 951 | $2,130 | $2.24 | 2d | 10 | 0.67mi |
| 4660 Martin Luther King Jr Ave SW Washington, DC | 1.0–2.0 | 1.0–2.0 | 827 | $1,699 | $2.05 | 3d | 11 | 0.71mi |
| 4805 Springmaid Ln Oxon Hill, MD | 3.0 | 2.5 | 1296 | $2,600 | $2.01 | 18d | 1 | 0.72mi |
| 864 Bellevue St SE Unit 1 Washington, DC | 2.0 | 1.0 | 1628 | $1,700 | $1.04 | 24d | 1 | 0.75mi |
| 742 Congress St SE Washington, DC | 3.0 | 2.5 | 1744 | $3,000 | $1.72 | 16d | 1 | 0.77mi |
| 4005 Blakney Ln SE Washington, DC | 3.0 | 2.5 | 2024 | $3,000 | $1.48 | 18d | 1 | 0.85mi |
| 911 Bellevue St SE Washington, DC | 4.0 | 2.0 | 1820 | $3,400 | $1.87 | 24d | 1 | 0.86mi |
| 716 Audrey Ln Oxon Hill, MD | 3.0 | 2.0 | 1344 | $2,500 | $1.86 | 18d | 1 | 0.87mi |
| 349 Parkland Pl SE Unit A Washington, DC | 4.0 | 2.0 | 1400 | $2,500 | $1.79 | 24d | 1 | 0.91mi |
| 349 Parkland Pl SE Unit B Washington, DC | 4.0 | 2.0 | 1400 | $2,500 | $1.79 | 20d | 1 | 0.91mi |
| 224 Malcolm X Ave SE Washington, DC | 4.0 | 3.5 | 2052 | $3,500 | $1.71 | 24d | 1 | 0.93mi |
| 3210 8th St SE #1 Washington, DC | 2.0 | 2.0 | 1106 | $2,395 | $2.17 | 24d | 1 | 0.93mi |
| 1121 Varney St SE Washington, DC | 3.0 | 3.5 | 1400 | $3,000 | $2.14 | 24d | 1 | 0.95mi |
| 615 Malcolm X Ave SE Unit F Washington, DC | 3.0 | 1.0 | 1100 | $2,508 | $2.28 | 3d | 1 | 0.99mi |
| 1306 Sutler Ter Oxon Hill, MD | 4.0 | 2.5 | 1320 | $3,079 | $2.33 | 3d | 1 | 1.08mi |
| 802 Malcolm X Ave SE Washington, DC | 4.0 | 1.0 | 1140 | $3,150 | $2.76 | 24d | 1 | 1.08mi |
| 2913 8th St SE #3101 Washington, DC | 2.0 | 2.0 | 1100 | $2,400 | $2.18 | 14d | 1 | 1.08mi |
| 1002 Kennebec St Oxon Hill, MD | 1.0–2.0 | 1.0–1.5 | 871 | $1,921 | $2.20 | 1d | 12 | 1.11mi |
| 4935 Wall Flower Way Oxon Hill, MD | 3.0 | 3.0 | 1320 | $2,750 | $2.08 | 20d | 1 | 1.15mi |
| 407 Lebaum St SE Unit 4 Washington, DC | 2.0 | 1.0 | 1192 | $2,100 | $1.76 | 24d | 1 | 1.17mi |
| 1201 Oak Dr SE Washington, DC | 3.0 | 1.0–2.0 | 853 | $2,220 | $2.60 | 2d | 19 | 1.23mi |
| 5400 Livingston Ter Oxon Hill, MD | 1.0–3.0 | 1.0–1.5 | 1053 | $1,890 | $1.79 | 1d | 5 | 1.24mi |
| 1636 Deep Gorge Ct Oxon Hill, MD | 3.0 | 3.5 | 1332 | $2,750 | $2.06 | 43d | 1 | 1.28mi |
| 1439 Southern Ave SE Oxon Hill, MD | 2.0–3.0 | 1.0–2.0 | 1080 | $2,342 | $2.17 | 43d | 1 | 1.28mi |
| 5507 Sachem Dr Oxon Hill, MD | 4.0 | 3.0 | 1299 | $2,900 | $2.23 | 43d | 1 | 1.29mi |
Listing history 3 events
-
2026-06-18days on market $100,000 Active 2 DOM
-
2026-06-17remarks 699-char remark
-
2026-06-17$100,000 Active 1 DOM
ⓘ Source: listings_history table (triggers on properties + properties_extension) + one-shot
backfill from property_details.listing_events for pre-trigger history.
Climate risk First Street
- Flood 6/10 Major FEMA zone AE · 75% chance over 30 yrs
- Wildfire 2/10 Low
- Heat 8/10 Severe 7 d/yr ≥104°F today · 16 d/yr by 30 yrs out
- Wind 4/10 Moderate 21% chance of damaging wind over 30 yrs
- Air quality 3/10 Moderate 2 unhealthy d/yr today · 3 by 30 yrs out
Nearby sold comps map
Loading sold comps map…
Walkable amenities ~0.75 mi
Loading nearby amenities…
Taxation est. · year 1
- Rental income
- $31,247
- − Mortgage interest
- −$5,602
- − Property taxes
- −$1,500
- − Insurance
- −$6,025
- − Repairs & maintenance
- −$2,500
- − Management
- −$2,500
- − Depreciation
- −$2,909
- Taxable income
- $10,212
- Est. tax owed @ 24.0%
- −$2,451
- After-tax cash flow
- $8,416/yr
For passive investors: Depreciation is non-cash, so a rental often shows a tax loss while cash-flowing — sheltering income. Rental losses are passive: they offset passive income freely, and up to $25,000/yr can offset ordinary (W-2) income if you actively participate and your MAGI is under $100k (phasing out to $0 by $150k); unused losses carry forward. On sale, claimed depreciation is recaptured at up to 25%, and gains may owe capital-gains tax (a 1031 exchange can defer both). Figures are a year-1 estimate at your 24.0% rate — not tax advice; consult a CPA.
Schools (NCES district)
- District
- District Of Columbia Public Schools
- NCES district ID
- 1100030
- Math proficiency
- 33% ▲ 3.00%
- Reading proficiency
- 40% ▲ 5.00%
- Median HH income
- $67,671
- Composite
- 35.84/100
- National rank
- #9606
- State rank
- #8 of 32 in DC
Livability — Washington
- Score
- 73/100
- State rank
- #1
- US rank
- #5327
Category grades
Schools grade is shown separately in the Schools card above.
Census & demographics
- Census place
- Washington, DC
- County
- District of Columbia · 671,873 people
- City population
- 671,873
- Metro
- Washington-Arlington-Alexandria, DC-VA-MD-WV
- Population (ZIP)
- 40,920
- Household income
- $49,139
- Rent vs Own
- Severe rent burden
- 4530.0
Population outlook (District of Columbia County) Hauer SSP2
- Today (2025)
- 821,926 people
- By 2030
- 899,517 · +9.4%
- By 2040
- 1,061,162 · +29.1%
- By 2050
- 1,231,493 · +49.8%
- By 2075
- 1,603,312 · +95.1%
- By 2100
- 1,847,141 · +124.7%
Race, ethnicity, and origin ACS 2023
- Neighborhood character
- Predominantly Black (80%)
- Race & ethnicity
- Black 80% White 8% Two or more races 7% Hispanic / Latino 5%
- Foreign-born
- 4% · Canada
- Languages at home
- 95% English-only · Spanish 3%
Political lean MEDSL · District of Columbia
- 2024 margin
- Solid D (+86.1) · D 91.2% · R 5.1% · Other 3.8%
- 2008→2024 swing
- +0.1pp no change · 2008: 85.9pp · 2024: 86.1pp
- All cycles
- 2024: D+86.1 2020: D+86.8 2016: D+88.7 2012: D+84.2 2008: D+85.9
Not yet ingested
- Civics
- —
Market trends
- HPI YoY
- ▼ -60.34%
- Current HPI
- 326.4077
- Rent YoY
- ▲ 3.96%
- Metro
- Washington-Arlington-Alexandria, DC-VA-MD-WV
- State GDP YoY
- ▲ 1.33%
- F500 in state
- 6
Industry mix (Fortune 500 HQ in DC)
| Industry | F500 HQs | Revenue |
|---|---|---|
| Financial Services | 1 | $153B |
|
||
| Life Sciences / Industrials | 1 | $25B |
|
||
| Industrial Machinery | 1 | $8B |
|
||
Price history
1 event — show timeline
- 2026-06-17 Listed $100,000 BRIGHT MLS
Property tax history
+33.3%/yrLatest (2025): $36,932 · +3.2% YoY. Source: county tax records.
Cash-flow waterfall
monthlySold comps — $/sqft
last 12 mo · ≤1 miLoading sold comps…