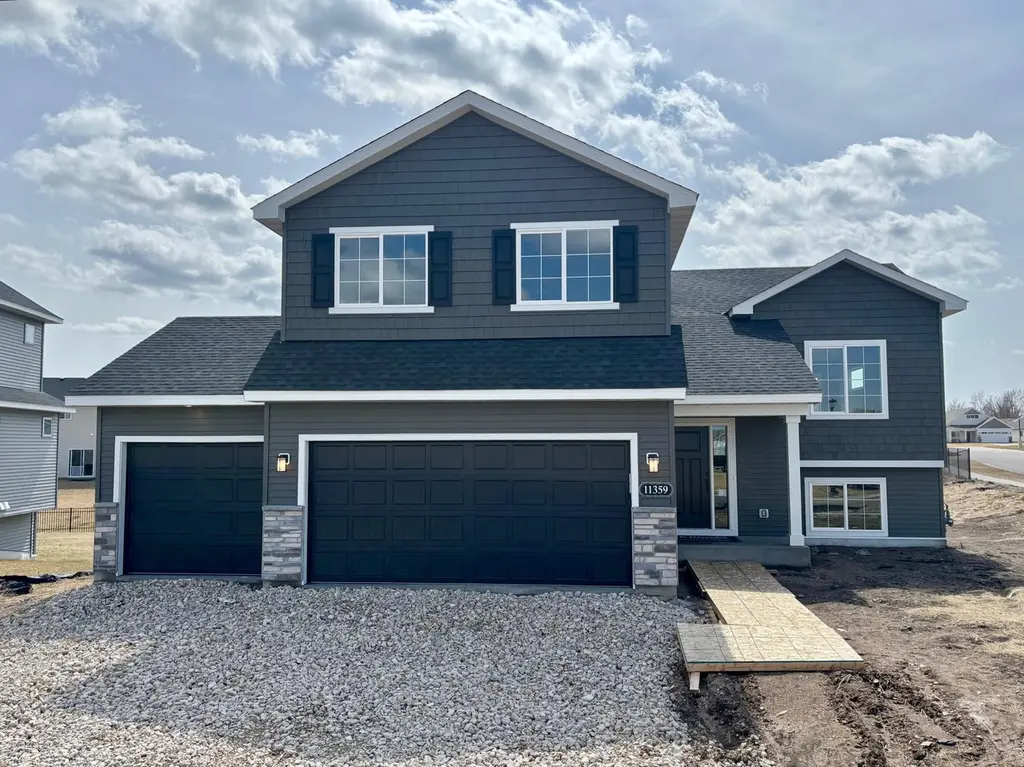
11359 5th St NE · Hanover, MN
Flood risk 1/10 · Minimal
- FEMA flood zone
- X (unshaded)
- Chance of flooding over 30 yrs
- 0.0%
- Est. flood insurance / yr
- $507 – $1,088
Fire risk 3/10 · Minor
- Est. fire insurance / yr
- $888 – $1,650
Heat risk 2/10 · Minimal
- Hot days now (above 98°F)
- 7 days/yr
- Hot days in 30 yrs
- 14 days/yr
Wind risk 2/10 · Minimal
- Chance of severe wind over 30 yrs
- —
Air-quality risk 2/10 · Minimal
- Unhealthy air days now
- 1 days/yr
- Unhealthy air days in 30 yrs
- 2 days/yr
Risk factors via First Street. Map © Google.
Why this score? — see what drove the D- grade
The composite is a weighted blend of 9 inputs, each scored 0–100. Each bar is that input's sub-score; the figure is the points it added to the 100-point composite (weight × sub-score).
- Cash flow +12.0/30.0
- ARV discount +7.5/15.0
- Schools +4.8/10.0
- Livability +3.6/5.0
- DSCR +3.5/10.0
- 1% rule +3.4/10.0
- Rent growth +2.5/5.0
- Condition / age +2.5/5.0
- Appreciation +0.0/10.0
$449,900
🖨 Deal sheet (PDF) 📄 Offer letter ✓ Due diligence
Listing remarks
FINAL OPPORTUNITIES! Ready for a February move in! Come experience the small-town charm of Hanover, MN in this fabulous three level Weston home in the in-demand community of River's Edge! The highlight of the home is the incredible private third-level Owner's Suite, featuring an oversized vaulted ceiling 19-foot bedroom, a luxurious private bathroom with a freestanding soaking tub and separate shower, and a walk-in closet with its own private entry. It’s your own personal sanctuary! The main living level impresses with soaring vaulted ceilings and an open-concept design that seamlessly connects the kitchen, dining, and living spaces—perfect for hosting gatherings or enjoying coz
Key facts
- Three-car garage
- Walk-in closet
- Large backyard
Tags
Property features AI
Finance
- Other: Lot dimensions approximately 82 x 131 x 107 x 131; Lot size about 0.28 acres; Above-grade finished area listed (information provided); Below-grade finished area listed (information provided)
- Financial info: Not specified
- HOA & community: Associated with Builders Association of the Twin Cities
Exterior
- Parking: Attached garage with garage door opener; 3-car garage
- Security: Not specified
- Utilities: City water; City sewer; Natural gas; 200+ amp electric service
- Home design: Residential property; Three-level split home; New construction (recent); Shingle/asphalt roof (≤ 8 years)
- Construction: Concrete perimeter foundation; Foundation area approximately 1,019; Built by JP Brooks Inc.
- Exterior features: Stone and vinyl exterior; In-ground sprinkler system; Sod included with price; Paved street frontage
Interior
- Kitchen: Kitchen with center island and window; Eat-in kitchen / informal dining area; Range; Microwave; Dishwasher; Refrigerator; Stainless steel appliances
- Bedrooms: 5 bedrooms total; Primary suite on upper level; Multiple bedrooms on main and lower levels
- Flooring: Not specified
- Bathrooms: Two full bathrooms; One three-quarter bathroom; Main floor full bath; Upper level full bath; Basement 3/4 bath
- Heating & cooling: Forced air heating; Central air conditioning; Gas water heater
- Interior features: Ceiling fans; Vaulted ceilings; Air-to-air exchanger; Finished basement with storage; Drain tile, sump pump, and walkout in basement; Primary bedroom with ensuite and private bath; Separate tub and shower
- Laundry & utility: Main level laundry room with washer and dryer hookups and utility sink; Washer and dryer hookups available
Neighborhood map
What this means for you Summary
Snapshot
- This is a 5-bed/3.0-bath other listed at $450k.
Deal economics
- At list price, monthly cash flow is $-108 ($-1k/yr) — negative.
- To cash-flow at today's rent, offer at most $434k (3.5% below list).
- To meet the 1% rule (rent ≥ 1% of price), the offer needs to be $380k (15.6% below list).
- Recommended offer: $380k (15.6% below list) — sets the bar for 1% rule.
- Cap rate 6.0% vs local median 4.0% in Hanover — top-decile yield for the area; either an underpriced asset or a hidden risk that comps aren't pricing in. Stress-test before assuming the spread holds.
Location & tenants
- Location reads 72/100 on livability (#293 in MN) — a middle-class / working-renter tenant base. Strengths: crime A+, employment A+, housing A+; Watch: amenities F, commute F, cost of living F.
- Buffalo-Hanover-Montrose Public Schools (town): math 52% / reading 56% proficiency, ranked #63 of 301 in MN (top 21%) — acceptable for families but not a draw, mixed tenant base, ~2y average lease; only 18% free/reduced lunch — higher-income household profile.
- Zoned schools: Hanover Elementary (math 72% / reading 67%, grade A-, #74 of 857 statewide, top 10%, 369 students, 18% FRL); Buffalo Community Middle (math 48% / reading 53%, grade C, #72 of 258 statewide, top 29%, 1,142 students, 30% FRL); Buffalo Senior High (math 42% / reading 61%, grade D+, #124 of 471 statewide, top 27%, 1,818 students, 24% FRL).
- Market conditions: 102 active listings in the ZIP; 1 comparable units currently listed for rent nearby; 1,260 units permitted in Wright County in 2024 (180 in 5+ unit buildings).
Forward outlook
- Local home prices are declining (-3.0%/yr); year-one equity from $3k of loan paydown is wiped out by about $13k of value loss. Plan a longer hold.
- Wright County population projected at +9% by 2050 — modest demand growth; plan on rents tracking national, not racing it.
Negotiation context
- It's been on market 21 days — a 2% lower offer ($443k) is reasonable based on typical stale-listing flexibility.
- 2 sale attempts with the ask held roughly flat each time — persistent listings suggest the price (not the market) is what's stuck; bring a comps-based counter.
Questions for the listing agent
- What do current leases actually rent for vs. the listed asking? Can we see a recent rent roll and the last 12 months of T-12 income?
- Is there a deadline driving the sale (1031 exchange, divorce, estate, relocation)? That informs how much negotiation room exists.
- Schools are A-rated — typically a magnet for longer-tenancy family renters. What's the average tenant stay here, and is there a school-zone premium baked into asking?
- The area grade is low — what's the realistic commute time and amenity access for the typical tenant pool here? Any planned neighborhood developments (good or bad) we should know about?
- What's the average days-on-market for RENTAL listings here right now (not sales)? A rising rental-DOM trend means longer vacancies and softer asking-rent achievability than the comps imply.
- What's the recent tenant-quality profile in this submarket — average credit score on applications, eviction rate, late-payment / NSF rate, and stable-employment percentage? A property-management company in the area should have these aggregated.
- How much new for-sale + rental construction is in the pipeline within 1–3 miles? Heavy new supply typically softens prices + rents 12–24 months out; constrained supply supports both.
Investment metrics
- 1% rule
- 0.84% ✗
- Cap rate
- 6.01%
- Cash-on-cash
- -1.03%
- DSCR
- 0.95
- GRM
- 9.9
CMA / ARV
No comps found within radius.
Projected returns pro-forma
-3.0% appreciation · 3.0% rent growth · sell at horizon
- IRR
- -18.0%
- Equity multiple
- 0.37×
- Total profit
- $-79,721
- Equity at exit
- $67,082
- IRR
- -10.2%
- Equity multiple
- 0.38×
- Total profit
- $-78,040
- Equity at exit
- $38,899
Cash invested: $125,972 (down + closing). Projections, not guarantees.
Landlord ↔ Tenant lean methodology
- Overall (STATE)
- 46 Balanced
- State Minnesota
- 46 Balanced · D+2
- County
- — inherits STATE
- City
- — inherits STATE
ZIP-level market 55341
- Home prices YoY
- -16.0%
- Active inventory
- 102
- Price-to-rent
- 9.9×
Monthly cashflow live
- Estimated rent
- $3,799 medium interval (Pro) →
- Mortgage (P&I)
- −$2,359
- Tax est. 1.5%
- −$562 /mo · $6,748/yr
- Insurance
- −$187
- HOA
- −$0
- Vacancy / Maint / Mgmt
- −$798
- Net cashflow
- $-108
Break-even live
Sensitivity live
| Price | -10% $203 | -5% $48 | +0% $-108 | +5% $-263 | +10% $-419 |
|---|---|---|---|---|---|
| Rent | -10% $-408 | -5% $-258 | +0% $-108 | +5% $42 | +10% $192 |
| Rate | -1.0pp $119 | -0.5pp $6 | base $-108 | +0.5pp $-225 | +1.0pp $-343 |
UW: 25.0% down · 7.5% · 30yr · 1.5% tax · 5.0% vac · 8.0% maint · 8.0% mgmt
Financing live
Cash to close
- Down payment
- $112,475
- Closing costs
- $13,497
- Reserves months
- —
- Total cash needed
- —
Loan-product check · same deal, 3 products live
Conventional
25% down · 7.5% · 30yr
- Down + closing
- —
- Monthly P&I
- —
- Monthly cashflow
- —
- DSCR
- —
- Eligible?
- —
Personal DTI + credit; lowest rate.
DSCR
20% down · 8.5% · 30yr
- Down + closing
- —
- Monthly P&I
- —
- Monthly cashflow
- —
- DSCR
- —
- Eligible?
- —
No personal income docs; deal must DSCR.
Hard money
10% down · 12.0% · 12mo
- Down + closing
- —
- Monthly P&I
- —
- Monthly cashflow
- —
- DSCR
- —
- Eligible?
- —
Short-term bridge; refi at stabilization.
Rent comps 1 comps
| Address | Beds | Baths | Sqft | Rent | $/sqft | DOM | Units | Dist |
|---|---|---|---|---|---|---|---|---|
| 30110 107th Ave N Hanover, MN | 5.0 | 3.0 | 3000 | $3,799 | $1.27 | 18d | 1 | 0.71mi |
Listing history 9 events
-
2026-05-22status Pending
-
2026-05-15price $449,900
-
2026-05-08price $452,900
-
2026-05-01$454,900 Active
-
2026-05-01historical
-
2026-04-16price $454,900
-
2026-03-19price $457,900
-
2026-01-22price $459,900
-
2025-12-11$464,900 Active
ⓘ Source: listings_history table (triggers on properties + properties_extension) + one-shot
backfill from property_details.listing_events for pre-trigger history.
Climate risk First Street
- Flood 1/10 Low FEMA zone X (unshaded) · 0% chance over 30 yrs
- Wildfire 3/10 Moderate
- Heat 2/10 Low 7 d/yr ≥98°F today · 14 d/yr by 30 yrs out
- Wind 2/10 Low
- Air quality 2/10 Low 1 unhealthy d/yr today · 2 by 30 yrs out
Nearby sold comps map
Loading sold comps map…
Walkable amenities ~0.75 mi
Loading nearby amenities…
Taxation est. · year 1
- Rental income
- $45,588
- − Mortgage interest
- −$25,201
- − Property taxes
- −$6,748
- − Insurance
- −$2,250
- − Repairs & maintenance
- −$3,647
- − Management
- −$3,647
- − Depreciation
- −$13,088
- Taxable loss
- −$8,993
- Est. tax savings @ 24.0%
- +$2,158
- After-tax cash flow
- $863/yr
For passive investors: Depreciation is non-cash, so a rental often shows a tax loss while cash-flowing — sheltering income. Rental losses are passive: they offset passive income freely, and up to $25,000/yr can offset ordinary (W-2) income if you actively participate and your MAGI is under $100k (phasing out to $0 by $150k); unused losses carry forward. On sale, claimed depreciation is recaptured at up to 25%, and gains may owe capital-gains tax (a 1031 exchange can defer both). Figures are a year-1 estimate at your 24.0% rate — not tax advice; consult a CPA.
Schools (NCES district)
- District
- Buffalo-Hanover-Montrose Public Schools
- NCES district ID
- 2707200
- Math proficiency
- 52% ▼ -13.00%
- Reading proficiency
- 56% ▼ -9.00%
- Median HH income
- $72,549
- Composite
- 48.25/100
- National rank
- #2159
- State rank
- #63 of 301 in MN
Livability — Hanover
- Score
- 72/100
- State rank
- #293
- US rank
- #6387
Category grades
Schools grade is shown separately in the Schools card above.
Census & demographics
- Census place
- Hanover, MN
- City population
- 3,454
- Population (ZIP)
- 3,454
Population outlook (Wright County) Hauer SSP2
- Today (2025)
- 142,526 people
- By 2030
- 146,915 · +3.1%
- By 2040
- 153,625 · +7.8%
- By 2050
- 155,416 · +9.0%
- By 2075
- 150,352 · +5.5%
- By 2100
- 130,631 · -8.3%
Race, ethnicity, and origin ACS 2023
- Neighborhood character
- Predominantly White (91%)
- Race & ethnicity
- White 91% Two or more races 5% Asian 3% Native American 1%
- Common ancestry
- Portuguese 12% Romanian 5% Iranian 3%
- Foreign-born
- 2% · South Korea, Canada
- Languages at home
- 98% English-only · Other Asian/Pacific 2% German/W. Germanic 1%
Political lean MEDSL · Wright
- 2024 margin
- Strong R (+29.4) · D 34.4% · R 63.8% · Other 1.8%
- 2008→2024 swing
- -11.9pp toward R · 2008: -17.4pp · 2024: -29.4pp
- All cycles
- 2024: R+29.4 2020: R+28.6 2016: R+33.2 2012: R+21.4 2008: R+17.4
Not yet ingested
- Civics
- —
Market trends
- HPI YoY
- ▼ -44.77%
- Current HPI
- 234.7046
- Rent YoY
- —
- Metro
- —
- State GDP YoY
- ▲ 2.41%
- F500 in state
- 34
Industry mix (Fortune 500 HQ in MN)
| Industry | F500 HQs | Revenue |
|---|---|---|
| Healthcare | 2 | $407B |
|
||
| Retail | 2 | $150B |
|
||
| Consumer Goods | 2 | $32B |
|
||
| Industrial Machinery | 2 | $6B |
|
||
| Agriculture | 1 | $40B |
|
||
| Healthcare / Medical Devices | 1 | $32B |
|
||
Price history
-3.2% since first listed9 events — show timeline
- 2026-05-22 Pending — NORTHSTARMLS as Distributed by MLS Grid
- 2026-05-15 Price Changed $449,900 NORTHSTARMLS as Distributed by MLS Grid
- 2026-05-08 Price Changed $452,900 NORTHSTARMLS as Distributed by MLS Grid
- 2026-05-01 Listing Removed — NORTHSTARMLS as Distributed by MLS Grid
- 2026-05-01 Listed $454,900 NORTHSTARMLS as Distributed by MLS Grid
- 2026-04-16 Price Changed $454,900 NORTHSTARMLS as Distributed by MLS Grid
- 2026-03-19 Price Changed $457,900 NORTHSTARMLS as Distributed by MLS Grid
- 2026-01-22 Price Changed $459,900 NORTHSTARMLS as Distributed by MLS Grid
- 2025-12-11 Listed $464,900 NORTHSTARMLS as Distributed by MLS Grid
Property tax history
+177.9%/yrLatest (2025): $448 · +64.7% YoY. Source: county tax records.
Cash-flow waterfall
monthlySold comps — $/sqft
last 12 mo · ≤1 miLoading sold comps…