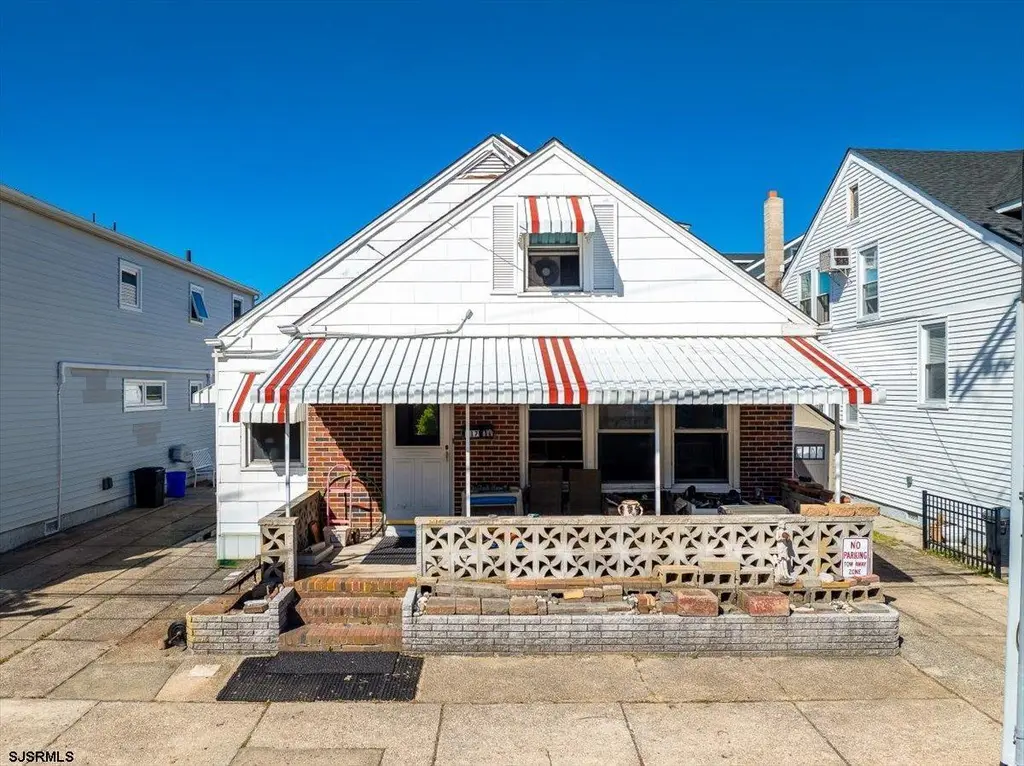
117 N Granville Ave · Margate City, NJ
Flood risk 9/10 · Severe
- FEMA flood zone
- AE
- Chance of flooding over 30 yrs
- 0.99%
- Est. flood insurance / yr
- $1,737 – $8,500
Fire risk 1/10 · Minimal
- Est. fire insurance / yr
- $526 – $976
Heat risk 9/10 · Severe
- Hot days now (above 95°F)
- 7 days/yr
- Hot days in 30 yrs
- 16 days/yr
Wind risk 8/10 · Major
- Chance of severe wind over 30 yrs
- 80.0%
Air-quality risk 2/10 · Minimal
- Unhealthy air days now
- 1 days/yr
- Unhealthy air days in 30 yrs
- 2 days/yr
Risk factors via First Street. Map © Google.
Why this score? — see what drove the A- grade
The composite is a weighted blend of 9 inputs, each scored 0–100. Each bar is that input's sub-score; the figure is the points it added to the 100-point composite (weight × sub-score).
- Cash flow +30.0/30.0
- ARV discount +15.0/15.0
- 1% rule +10.0/10.0
- DSCR +10.0/10.0
- Schools +4.8/10.0
- Rent growth +4.7/5.0
- Livability +3.8/5.0
- Condition / age +2.5/5.0
- Appreciation +0.0/10.0
$749,000
🖨 Deal sheet 📄 Offer letter ✓ Due diligence
Listing remarks MLS
BUILD YOUR DREAM BEACH HOUSE HERE!!! Generously sized lot in PRIME LOCATION just steps from Margate's popular shopping and dining, this property offers the ultimate walkable shore lifestyle! Enjoy ample off-street parking and an unbeatable location just three short blocks to the beach!!
Key facts
- Custom dream home
- Generously sized lot
- 2 parking spots
Tags
Property features AI
Finance
- Other: Property is offered for sale; Lot approximately 40 x 67.58 (under 1 acre); Not waterfront; Available documents: Lead-based paint disclosure, Seller's property condition
Exterior
- Parking: Two exterior parking spaces; No garage
- Utilities: Public water; Public sewer
- Home design: Single-family property; Facing direction: Other (see remarks)
- Construction: Brick siding; Shingle siding
- Exterior features: Porch; Curbs; Sidewalks; Concrete driveway
Interior
- Kitchen: Electric stove; Microwave; Refrigerator
- Bathrooms: Three full bathrooms
- Heating & cooling: Natural gas heating; Window air conditioning units
- Interior features: Carbon monoxide detector; Smoke/fire alarm
- Laundry & utility: Washer; Dryer; Dedicated laundry/utility room
Neighborhood map
What this means for you Summary
Snapshot
- This is a 5-bed/3.0-bath single-family listed at $749k.
Deal economics
- At list price, monthly cash flow is $6k ($71k/yr) — positive.
- The deal already cash-flows at list — no discount required.
- Meets the 1% rule at list price ($14k rent vs $749k).
- Cap rate 16.4% vs local median 7.4% in Margate City — top-decile yield for the area; either an underpriced asset or a hidden risk that comps aren't pricing in. Stress-test before assuming the spread holds.
Location & tenants
- Location reads 75/100 on livability (#149 in NJ, #3,893 nationally) — a middle-class / working-renter tenant base. Strengths: schools A+, crime A+, employment A+; Watch: amenities F, commute F, cost of living F.
- Margate City School District (suburban): math 50% / reading 58% proficiency, ranked #113 of 472 in NJ (top 24%) — acceptable for families but not a draw, mixed tenant base, ~2y average lease; only 8% free/reduced lunch — higher-income household profile.
- Market conditions: Rents rising fast (+8.9%/yr); 147 active listings in the ZIP; 18 comparable units currently listed for rent nearby; rentals at typical pace (median 21d on market — plan ~3-4 weeks tenant-placement turnaround); 44% of comp listings sitting > 30 days — soft ceiling on asking rent; high-income renter base; 672 units permitted in Atlantic County in 2024 (258 in 5+ unit buildings).
- At $13,952/mo this rent would consume 137% of the median local household income ($122k/yr) (locally 23% of renters already pay >50% of income on rent) — very limited rent-growth headroom before tenants either downsize or default.
Forward outlook
- Local home prices are declining (-3.0%/yr); year-one equity from $5k of loan paydown is wiped out by about $22k of value loss. Plan a longer hold.
- Atlantic County population projected at -12% by 2050 — secular population decline; favor cash flow + early exit over multi-decade hold.
- At projected returns (-3.0% appreciation + 8.0% rent growth), your $210k cash investment doubles in ~4 years — after that, you're playing with house money.
Negotiation context
- Only 14 days on market — expect competitive offers; lowballing is unlikely to land.
- 2 sale attempts with the ask held roughly flat each time — persistent listings suggest the price (not the market) is what's stuck; bring a comps-based counter.
Risks & watch-outs
- Watch-outs: flood insurance adds $427/mo.
- Climate carrying-cost: in FEMA flood zone AE (mandatory federal flood insurance); severe wind risk, 80% chance of damaging wind over 30y; extreme-heat days projected 7→16/yr by 2055 (HVAC capex compounding) — expect insurance premiums to compound above CPI over the hold.
Questions for the listing agent
- Built in 1960 — when were the roof, HVAC, electrical panel, plumbing, and water heater last replaced?
- What's the actual annual flood-insurance premium (NFIP or private), and is the property in a SFHA with mandatory coverage?
- Is there a deadline driving the sale (1031 exchange, divorce, estate, relocation)? That informs how much negotiation room exists.
- Schools are A-rated — typically a magnet for longer-tenancy family renters. What's the average tenant stay here, and is there a school-zone premium baked into asking?
- What's the average days-on-market for RENTAL listings here right now (not sales)? A rising rental-DOM trend means longer vacancies and softer asking-rent achievability than the comps imply.
- What's the recent tenant-quality profile in this submarket — average credit score on applications, eviction rate, late-payment / NSF rate, and stable-employment percentage? A property-management company in the area should have these aggregated.
- How much new for-sale + rental construction is in the pipeline within 1–3 miles? Heavy new supply typically softens prices + rents 12–24 months out; constrained supply supports both.
Investment metrics
- 1% rule
- 1.86% ✓
- Cap rate
- 16.41%
- Cash-on-cash
- 36.13%
- DSCR
- 2.61
- GRM
- 4.5
CMA / ARV
- ARV (on-the-fly)
- $1,391,962
- Comps found
- 12
Show comp detail 12 sales within ~0.75 mi
| Address | Dist | Beds/Ba | Sqft | Sold | Price | $/sf | Match |
|---|---|---|---|---|---|---|---|
| 109 N Douglas Ave | 0.21mi | 4/3.5 (-1) | 2,000 (-2%) | 10mo | $1,375,000 | $688 | 72 |
| 414 N Clermont Ave | 0.37mi | 4/3.0 (-1) | 2,076 (+2%) | 9mo | $760,000 | $366 | 67 |
| 108 N Clermont Ave | 0.25mi | 5/4.5 | 2,168 (+6%) | 7mo | $1,475,000 | $680 | 66 |
| 25 N Huntington Ave | 0.12mi | 4/3.0 (-1) | 2,259 (+11%) | 10mo | $1,465,000 | $649 | 64 |
| 7 S Hanover Ave | 0.28mi | 4/3.0 (-1) | 2,240 (+10%) | 3mo | $1,695,000 | $757 | 63 |
| 7 N Swarthmore Ave | 0.60mi | 4/3.0 (-1) | 2,046 (+0%) | 9mo | $1,300,000 | $635 | 59 |
| 18 N Fredericksburg Ave | 0.30mi | 5/3.5 | 2,200 (+8%) | 16mo | $1,625,000 | $739 | 58 |
| 39 N Douglas Ave | 0.22mi | 4/2.5 (-1) | 1,832 (-10%) | 14mo | $1,250,000 | $682 | 54 |
| 309 N Fredericksburg Ave | 0.48mi | 4/3.0 (-1) | 2,168 (+6%) | 11mo | $1,325,000 | $611 | 53 |
| 7723 Ventnor Ave | 0.30mi | 5/4.0 | 2,320 (+14%) | 10mo | $1,500,000 | $647 | 51 |
| 202 N Fredericksburg Ave | 0.45mi | 4/3.0 (-1) | 1,800 (-12%) | 10mo | $1,299,999 | $722 | 46 |
| 10 S Knight Ave | 0.36mi | 6/4.0 (+1) | 2,332 (+14%) | 9mo | $2,887,500 | $1,238 | 43 |
Match score weights: distance 35% · size 25% · config 20% · recency 20%. Top-matched comps best support the ARV.
Projected returns pro-forma
-3.0% appreciation · 8.0% rent growth · sell at horizon
- IRR
- 34.5%
- Equity multiple
- 2.56×
- Total profit
- $327,577
- Equity at exit
- $111,678
- IRR
- 44.0%
- Equity multiple
- 6.27×
- Total profit
- $1,104,499
- Equity at exit
- $64,760
Cash invested: $209,720 (down + closing). Projections, not guarantees.
Landlord ↔ Tenant lean methodology
- Overall (STATE)
- 21 Tenant-Leaning
- State New Jersey
- 21 Tenant-Leaning · D+6
- County
- — inherits STATE
- City
- — inherits STATE
ZIP-level market 08402
- Rents YoY
- 8.9%
- Active inventory
- 147
- Price-to-rent
- 4.5×
Monthly cashflow live
- Estimated rent
- $13,952 medium interval (Pro) →
- Mortgage (P&I)
- −$3,928
- Tax from tax record
- −$467 /mo · $5,608/yr
- Insurance
- −$312
- Flood insurance flood zone
- −$427 /mo · $5,118/yr
- HOA
- −$0
- Vacancy / Maint / Mgmt
- −$2,930
- Net cashflow
- $5,888
Break-even live
UW: 25.0% down · 7.5% · 30yr · 1.5% tax · 5.0% vac · 8.0% maint · 8.0% mgmt
Financing live
Cash to close
- Down payment
- $187,250
- Closing costs
- $22,470
- Reserves months
- —
- Total cash needed
- —
Loan-product check · same deal, 3 products live
Conventional
25% down · 7.5% · 30yr
- Down + closing
- —
- Monthly P&I
- —
- Monthly cashflow
- —
- DSCR
- —
- Eligible?
- —
Personal DTI + credit; lowest rate.
DSCR
20% down · 8.5% · 30yr
- Down + closing
- —
- Monthly P&I
- —
- Monthly cashflow
- —
- DSCR
- —
- Eligible?
- —
No personal income docs; deal must DSCR.
Hard money
10% down · 12.0% · 12mo
- Down + closing
- —
- Monthly P&I
- —
- Monthly cashflow
- —
- DSCR
- —
- Eligible?
- —
Short-term bridge; refi at stabilization.
Rent comps 18 comps
| Address | Beds | Baths | Sqft | Rent | $/sqft | DOM | Units | Dist |
|---|---|---|---|---|---|---|---|---|
| 200 N Essex Ave Margate City, NJ | 4.0 | 3.0 | 1570 | $15,000 | $9.55 | 43d | 1 | 0.16mi |
| 107 N Douglas Ave Unit AUGUST Margate City, NJ | 5.0 | 3.5 | 2312 | $33,000 | $14.27 | 20d | 1 | 0.20mi |
| 107 N Douglas Ave Margate City, NJ | 5.0 | 3.5 | 2312 | $36,000 | $15.57 | 43d | 1 | 0.20mi |
| 307 N Essex Ave Margate City, NJ | 4.0 | 2.0 | 1561 | $1,800 | $1.15 | 43d | 1 | 0.25mi |
| 7611 Ventnor Ave Margate City, NJ | 6.0 | 4.0 | 2717 | $34,000 | $12.51 | 20d | 1 | 0.33mi |
| 106 S Essex Ave Margate City, NJ | 5.0 | 3.0 | 2034 | $9,500 | $4.67 | 20d | 1 | 0.38mi |
| 119 N Belmont Ave Unit June 2026 Margate City, NJ | 4.0 | 2.5 | 2044 | $10,000 | $4.89 | 13d | 1 | 0.39mi |
| 8606 Monmouth Ave Unit August 9/13 Margate City, NJ | 4.0 | 3.5 | 2430 | $20,000 | $8.23 | 43d | 1 | 0.41mi |
| 6 N Melbourne Ave Ventnor City, NJ | 4.0 | 3.5 | 2028 | $3,000 | $1.48 | 43d | 1 | 0.64mi |
| 8208 Lagoon Dr Margate City, NJ | 4.0 | 2.5 | 2480 | $18,000 | $7.26 | 13d | 1 | 0.66mi |
| 7103 Ventnor Ave Ventnor City, NJ | 4.0 | 3.0 | 2288 | $5,500 | $2.40 | 13d | 1 | 0.68mi |
| 204 N Union Ave Margate City, NJ | 5.0 | 4.0 | 2393 | $5,000 | $2.09 | 43d | 1 | 0.69mi |
| 109 N Wissahickon Ave Unit B Ventnor City, NJ | 4.0 | 3.5 | 2000 | $25,000 | $12.50 | 20d | 1 | 0.84mi |
| 16 S Decatur Ave Unit 9/15-10/31 Margate City, NJ | 4.0 | 3.0 | 1732 | $7,000 | $4.04 | 43d | 1 | 0.90mi |
| 7 S Richards Ave Ventnor City, NJ | 4.0 | 2.0 | 1600 | $25,000 | $15.62 | 13d | 1 | 0.93mi |
| 9411 Winchester Ave Margate City, NJ | 5.0 | 3.5 | 2776 | $11,500 | $4.14 | 43d | 1 | 0.99mi |
| 9406 Amherst Ave Margate City, NJ | 4.0 | 4.0 | 2554 | $47,000 | $18.40 | 20d | 1 | 1.00mi |
| 406 N Dorset Ave Ventnor City, NJ | 4.0 | 1.5 | 1568 | $13,000 | $8.29 | 13d | 1 | 1.44mi |
Listing history 13 events
-
2026-06-19days on market $749,000 Active 14 DOM
-
2026-06-18days on market $749,000 Active 13 DOM
-
2026-06-17days on market $749,000 Active 12 DOM
-
2026-06-16days on market $749,000 Active 11 DOM
-
2026-06-15days on market $749,000 Active 10 DOM
-
2026-06-14days on market $749,000 Active 8 DOM
-
2026-06-13days on market $749,000 Active 7 DOM
-
2026-06-10remarks 432-char remark
-
2026-06-10days on market $749,000 Active 5 DOM
-
2026-06-09days on market $749,000 Active 4 DOM
-
2026-06-08days on market $749,000 Active 3 DOM
-
2026-06-07remarks 369-char remark
-
2026-06-07$749,000 Active 2 DOM
ⓘ Source: listings_history table (triggers on properties + properties_extension) + one-shot
backfill from property_details.listing_events for pre-trigger history.
Tax reassessment forecast NJ · Partial reset (capped growth)
- Current annual tax
- $5,608 · $467/mo
- Projected year-2 tax
- $12,129 · $1,011/mo
- Expected delta
- +$6,521/yr (+$543/mo · 116.3%)
ⓘ Screening estimate from a state-policy table — verify with the county assessor before closing.
Climate risk First Street
- Flood 9/10 Extreme FEMA zone AE · 99% chance over 30 yrs
- Wildfire 1/10 Low
- Heat 9/10 Extreme 7 d/yr ≥95°F today · 16 d/yr by 30 yrs out
- Wind 8/10 Severe 80% chance of damaging wind over 30 yrs
- Air quality 2/10 Low 1 unhealthy d/yr today · 2 by 30 yrs out
Nearby sold comps map
Loading sold comps map…
Walkable amenities ~0.75 mi
Loading nearby amenities…
Taxation est. · year 1
- Rental income
- $167,424
- − Mortgage interest
- −$41,956
- − Property taxes
- −$5,608
- − Insurance
- −$8,864
- − Repairs & maintenance
- −$13,394
- − Management
- −$13,394
- − Depreciation
- −$21,789
- Taxable income
- $62,420
- Est. tax owed @ 24.0%
- −$14,981
- After-tax cash flow
- $55,679/yr
For passive investors: Depreciation is non-cash, so a rental often shows a tax loss while cash-flowing — sheltering income. Rental losses are passive: they offset passive income freely, and up to $25,000/yr can offset ordinary (W-2) income if you actively participate and your MAGI is under $100k (phasing out to $0 by $150k); unused losses carry forward. On sale, claimed depreciation is recaptured at up to 25%, and gains may owe capital-gains tax (a 1031 exchange can defer both). Figures are a year-1 estimate at your 24.0% rate — not tax advice; consult a CPA.
Schools (NCES district)
- District
- Margate City School District
- NCES district ID
- 3409690
- Math proficiency
- 50% ▼ -26.00%
- Reading proficiency
- 58% ▼ -28.00%
- Median HH income
- $67,112
- Composite
- 47.71/100
- National rank
- #2241
- State rank
- #113 of 472 in NJ
Livability — Margate City
- Score
- 75/100
- State rank
- #149
- US rank
- #3893
Category grades
Schools grade is shown separately in the Schools card above.
Census & demographics
- Census place
- Margate City, NJ
- County
- Atlantic County · 143,611 people
- City population
- 5,234
- Metro
- Atlantic City-Hammonton, NJ
- Population (ZIP)
- 5,234
- Household income
- $121,800
- Rent vs Own
- Severe rent burden
- 23.0
Population outlook (Atlantic County) Hauer SSP2
- Today (2025)
- 268,948 people
- By 2030
- 264,497 · -1.7%
- By 2040
- 252,261 · -6.2%
- By 2050
- 237,846 · -11.6%
- By 2075
- 210,650 · -21.7%
- By 2100
- 180,234 · -33.0%
Race, ethnicity, and origin ACS 2023
- Neighborhood character
- Predominantly White (94%)
- Race & ethnicity
- White 94% Two or more races 3% Asian 2% Hispanic / Latino 2%
- Common ancestry
- Scotch-Irish 9% Romanian 6% Lithuanian 2%
- Foreign-born
- 5% · Canada, Jamaica
- Languages at home
- 92% English-only · Other Indo-European 2% Tagalog/Filipino 2% Spanish 1%
Political lean MEDSL · Atlantic
- 2024 margin
- Toss-up / Even · D 47.7% · R 50.7% · Other 1.6%
- 2008→2024 swing
- -18.1pp toward R · 2008: 15.1pp · 2024: -3.0pp
- All cycles
- 2024: R+3.0 2020: D+6.7 2016: D+6.2 2012: D+17.2 2008: D+15.1
Not yet ingested
- Civics
- —
Market trends
- HPI YoY
- ▼ -625.70%
- Current HPI
- 475.1366
- Rent YoY
- ▲ 8.91%
- Metro
- Atlantic City-Hammonton, NJ
- State GDP YoY
- ▲ 2.05%
- F500 in state
- 34
Industry mix (Fortune 500 HQ in NJ)
| Industry | F500 HQs | Revenue |
|---|---|---|
| Consumer Goods | 3 | $31B |
|
||
| Pharmaceuticals | 2 | $153B |
|
||
| Technology | 2 | $21B |
|
||
| Insurance | 2 | $20B |
|
||
| Healthcare | 2 | $19B |
|
||
| Financial Services | 1 | $70B |
|
||
Price history
+0.0% since first listed2 events — show timeline
- 2026-06-05 Listed $749,000 SJSRMLS
- 2026-06-03 Listed $749,000 SJSRMLS
Property tax history
+1.9%/yrLatest (2025): $5,608 · +4.6% YoY. Source: county tax records.
Cash-flow waterfall
monthlySold comps — $/sqft
last 12 mo · ≤1 miLoading sold comps…