7004 Orchard Ave · Warren, MI
Flood risk 1/10 · Minimal
- FEMA flood zone
- X (unshaded)
- Chance of flooding over 30 yrs
- 0.0%
- Est. flood insurance / yr
- $507 – $1,088
Fire risk 1/10 · Minimal
- Est. fire insurance / yr
- $784 – $1,456
Heat risk 3/10 · Minor
- Hot days now (above 97°F)
- 7 days/yr
- Hot days in 30 yrs
- 14 days/yr
Wind risk 1/10 · Minimal
- Chance of severe wind over 30 yrs
- —
Air-quality risk 3/10 · Minor
- Unhealthy air days now
- 3 days/yr
- Unhealthy air days in 30 yrs
- 4 days/yr
Risk factors via First Street. Map © Google.
Why this score? — see what drove the C grade
The composite is a weighted blend of 9 inputs, each scored 0–100. Each bar is that input's sub-score; the figure is the points it added to the 100-point composite (weight × sub-score).
- Cash flow +26.2/30.0
- DSCR +8.9/10.0
- ARV discount +7.0/15.0
- 1% rule +6.3/10.0
- Livability +3.7/5.0
- Rent growth +3.1/5.0
- Condition / age +2.5/5.0
- Schools +1.8/10.0
- Appreciation +0.0/10.0
$159,900
🖨 Deal sheet 📄 Offer letter ✓ Due diligence
Listing remarks MLS
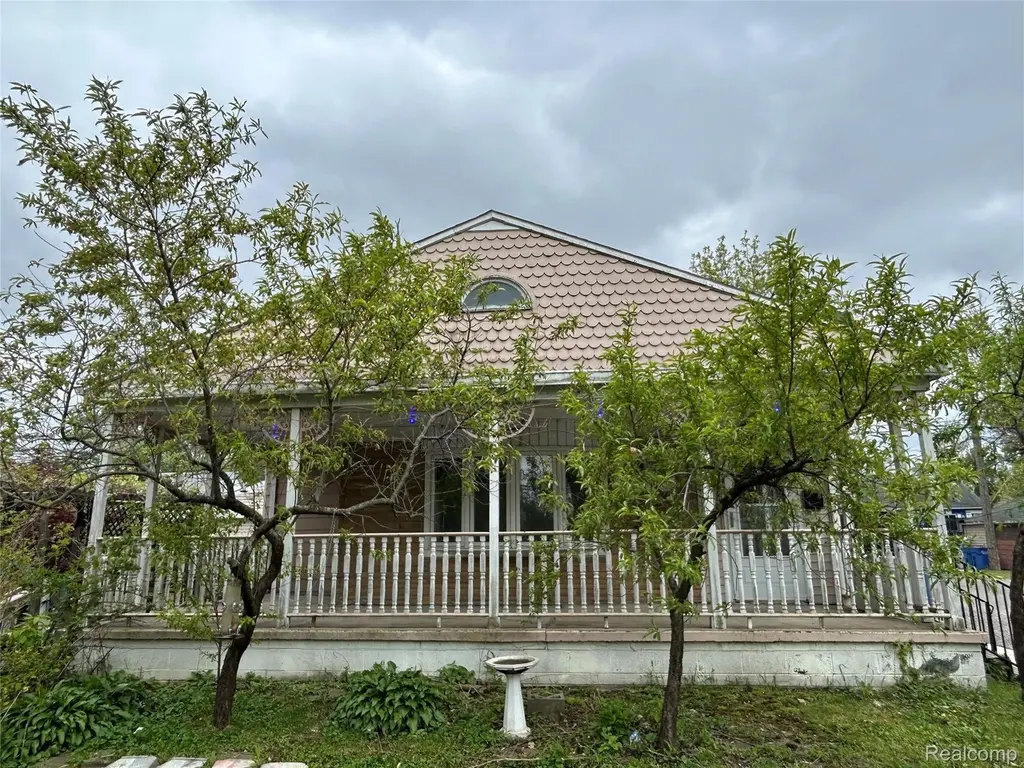
INVESTOR SPECIAL - INCREDIBLE OPPORTUNITY to either update or move right into a home that lives up to it's namesake on Orchard Ave - the most spacious home on the corner of a quiet tree lined neighborhood with a blooming garden full of mature fruit trees, perennials and a covered front porch to enjoy morning coffee. Massive space - 5 bedrooms, 3 full baths, tandem garage can fit two small cars back to back with built in work bench, hooks and shelving. Many updates in last two years include gorgeous spa-like full bath on first floor with luxury tub and shower, blue tooth speaker light combo and cushy fixtures to help you relax after a long day. Home on private double lot with capability of multi family home or back area to be used as an in-law suite with its own private entry, dedicated furnace and new tankless water heater, bedroom, full bath and living area with room for a full kitchen. There are two furnaces, two tankless water heaters, some newer vinyl windows, newer carpet throughout the home and 5 ceiling fans. Upper level has two bedrooms connected to a full bath. Bonus rooms for extra space that can be used as an office, pay area or just flex space. BATVAI. Home is offered AS IS and owner will make no repairs or updates whatsoever. Seller may consider Land Contract - MUST show proof of income, taxes, credit report, cash reserves, credit worthiness and at least half down for no longer than 3 years. Call today and make this majestic home your own today!
Key facts
- Covered front porch
- In-law suite
- Mature fruit trees
Tags
Property features AI
Finance
- Financial info: Annual property tax approximately $1,447
Exterior
- Parking: Attached tandem 2-car garage with direct access, garage door opener, workshop area; garage faces side and rear
- Utilities: Public water; Public sewer
- Home design: Single-family residence; Two stories; Ground-level entry with steps
- Construction: Built with other construction materials; Slab foundation
- Exterior features: Covered porch; Front and back yard fencing; Paved road access
Interior
- Bathrooms: 3 full bathrooms
- Heating & cooling: Electric forced-air heating; No central cooling
- Interior features: Crawl space basement; 11 total rooms
Neighborhood map
What this means for you Summary
Snapshot
- This is a 5-bed/1.5-bath single-family listed at $160k.
Deal economics
- At list price, monthly cash flow is $407 ($5k/yr) — positive.
- The deal already cash-flows at list — no discount required.
- Meets the 1% rule at list price ($2k rent vs $160k).
- Recommended offer: $155k (3.0% below list) — sets the bar for market timing.
- Cap rate 9.3% vs local median 5.3% in Warren — top-decile yield for the area; either an underpriced asset or a hidden risk that comps aren't pricing in. Stress-test before assuming the spread holds.
Location & tenants
- Location reads 74/100 on livability (#171 in MI, #4,491 nationally) — a middle-class / working-renter tenant base. Strengths: commute A+, cost of living A+, housing A+; Watch: schools D, amenities D, employment D.
- Center Line Public Schools (suburban): math 14% / reading 29% proficiency, ranked #459 of 540 in MI (top 85%) — low school quality limits family demand, transient renter base, plan for 1-2y turnover; 60% free/reduced lunch — lower-income household profile, screen leases tightly.
- Market conditions: Rents rising (+2.4%/yr); 168 active listings in the ZIP; 4 comparable units currently listed for rent nearby; rentals lingering (median 44d on market — plan ~5-8 weeks vacancy on turnover, expect pricing pressure); 50% of comp listings sitting > 30 days — soft ceiling on asking rent; 1,321 units permitted in Macomb County in 2024 (86 in 5+ unit buildings).
- This rent runs 40% of the median local income ($54k/yr) — at the standard rent-burdened threshold; future hikes will face affordability resistance.
Forward outlook
- Local home prices are declining (-3.0%/yr); year-one equity from $1k of loan paydown is wiped out by about $5k of value loss. Plan a longer hold.
- Macomb County population projected at +9% by 2050 — modest demand growth; plan on rents tracking national, not racing it.
Negotiation context
- It's been on market 35 days — a 3% lower offer ($155k) is reasonable based on typical stale-listing flexibility.
- 15 sale attempts since 19y ago; this cycle's ask has dropped $10k (6%) from the opening price — seller is motivated, your offer sets the floor, not the list.
- Current owner paid $30k; list at $160k implies a 433% gain — meaningful room to come down on a strong offer.
Risks & watch-outs
- Watch-outs: built in 1930 — expect roof / HVAC / electrical / plumbing capex.
Questions for the listing agent
- It's been on market 35 days. Have you received any prior offers? Is the seller open to a 3% concession, seller financing, or rate buy-down credit?
- Built in 1930 — when were the roof, HVAC, electrical panel, plumbing, and water heater last replaced?
- Is there a deadline driving the sale (1031 exchange, divorce, estate, relocation)? That informs how much negotiation room exists.
- Schools are D-rated, which usually means shorter tenancies and higher turnover. Who's the typical renter profile here, and what's been the actual vacancy rate?
- Crime grade is D in this area — have there been break-ins, vandalism, or insurance claims at this property in the last 3 years? What carrier currently insures it and at what premium?
- What's the average days-on-market for RENTAL listings here right now (not sales)? A rising rental-DOM trend means longer vacancies and softer asking-rent achievability than the comps imply.
- What's the recent tenant-quality profile in this submarket — average credit score on applications, eviction rate, late-payment / NSF rate, and stable-employment percentage? A property-management company in the area should have these aggregated.
- How much new for-sale + rental construction is in the pipeline within 1–3 miles? Heavy new supply typically softens prices + rents 12–24 months out; constrained supply supports both.
Investment metrics
- 1% rule
- 1.13% ✓
- Cap rate
- 9.35%
- Cash-on-cash
- 10.90%
- DSCR
- 1.49
- GRM
- 7.3
CMA / ARV
- ARV (median comp)
- $158,087
- List price
- $159,900
- Delta
- 1.15%
- Verdict
- FAIR
- Comps
- 12 within 1.0 mi
Show comp detail 12 sales within ~0.75 mi
| Address | Dist | Beds/Ba | Sqft | Sold | Price | $/sf | Match |
|---|---|---|---|---|---|---|---|
| 7641 Westminster Ave | 0.31mi | 4/1.5 (-1) | 1,415 (+2%) | 0mo | $155,000 | $110 | 77 |
| 7052 Toepfer Rd | 0.07mi | 5/1.0 | 1,519 (+10%) | 6mo | $160,000 | $105 | 74 |
| 7060 Orchard Ave | 0.05mi | 4/2.0 (-1) | 1,323 (-4%) | 16mo | $179,900 | $136 | 70 |
| 7552 Meadow Ave | 0.21mi | 4/2.0 (-1) | 1,350 (-2%) | 17mo | $156,000 | $116 | 65 |
| 8444 Chalmers Ave | 0.62mi | 4/1.0 (-1) | 1,344 (-3%) | 8mo | $150,000 | $112 | 53 |
| 7516 Jackson Ave | 0.38mi | 5/2.0 | 1,301 (-6%) | 22mo | $110,000 | $85 | 52 |
| 21659 Conners Ave | 0.15mi | 4/2.0 (-1) | 1,188 (-14%) | 13mo | $167,000 | $141 | 52 |
| 8080 Jackson Ave | 0.54mi | 4/1.0 (-1) | 1,400 (+1%) | 18mo | $99,900 | $71 | 51 |
| 20178 Stotter ST St | 0.75mi | 5/3.0 | 1,440 (+4%) | 7mo | $31,096 | $22 | 47 |
| 7075 Victory Ave | 0.09mi | 4/1.0 (-1) | 1,188 (-14%) | 23mo | $96,000 | $81 | 46 |
| 8237 Packard Ave | 0.56mi | 4/2.5 (-1) | 1,565 (+13%) | 11mo | $218,000 | $139 | 34 |
| 8293 Ford Ave | 0.66mi | 4/2.0 (-1) | 1,200 (-13%) | 14mo | $165,000 | $138 | 29 |
Match score weights: distance 35% · size 25% · config 20% · recency 20%. Top-matched comps best support the ARV.
Projected returns pro-forma
-3.0% appreciation · 2.35% rent growth · sell at horizon
- IRR
- -0.7%
- Equity multiple
- 0.97×
- Total profit
- $-1,206
- Equity at exit
- $23,842
- IRR
- 8.3%
- Equity multiple
- 1.61×
- Total profit
- $27,447
- Equity at exit
- $13,825
Cash invested: $44,772 (down + closing). Projections, not guarantees.
Landlord ↔ Tenant lean methodology
- Overall (STATE)
- 62 Landlord-Friendly
- State Michigan
- 62 Landlord-Friendly · EVEN
- County
- — inherits STATE
- City
- — inherits STATE
ZIP-level market 48091
- Rents YoY
- 2.4%
- Active inventory
- 168
- Price-to-rent
- 7.3×
Monthly cashflow live
- Estimated rent
- $1,813 medium interval (Pro) →
- Mortgage (P&I)
- −$839
- Tax from tax record
- −$121 /mo · $1,446/yr
- Insurance
- −$67
- HOA
- −$0
- Vacancy / Maint / Mgmt
- −$381
- Net cashflow
- $407
Break-even live
UW: 25.0% down · 7.5% · 30yr · 1.5% tax · 5.0% vac · 8.0% maint · 8.0% mgmt
Financing live
Cash to close
- Down payment
- $39,975
- Closing costs
- $4,797
- Reserves months
- —
- Total cash needed
- —
Loan-product check · same deal, 3 products live
Conventional
25% down · 7.5% · 30yr
- Down + closing
- —
- Monthly P&I
- —
- Monthly cashflow
- —
- DSCR
- —
- Eligible?
- —
Personal DTI + credit; lowest rate.
DSCR
20% down · 8.5% · 30yr
- Down + closing
- —
- Monthly P&I
- —
- Monthly cashflow
- —
- DSCR
- —
- Eligible?
- —
No personal income docs; deal must DSCR.
Hard money
10% down · 12.0% · 12mo
- Down + closing
- —
- Monthly P&I
- —
- Monthly cashflow
- —
- DSCR
- —
- Eligible?
- —
Short-term bridge; refi at stabilization.
Rent comps 4 comps
| Address | Beds | Baths | Sqft | Rent | $/sqft | DOM | Units | Dist |
|---|---|---|---|---|---|---|---|---|
| 7584 Hudson Ave Warren, MI | 5.0 | 1.0 | 1554 | $1,800 | $1.16 | 24d | 1 | 0.30mi |
| 20042 Rogge St Detroit, MI | 4.0 | 2.0 | 1232 | $1,394 | $1.13 | 43d | 1 | 0.82mi |
| 20058 Bloom St Detroit, MI | 4.0 | 1.0 | 1350 | $1,450 | $1.07 | 16d | 1 | 1.19mi |
| 11076 Essex Ave Warren, MI | 4.0 | 1.0 | 1072 | $1,400 | $1.31 | 43d | 1 | 1.26mi |
Listing history 50 events
-
2026-06-18days on market $159,900 Active 35 DOM
-
2026-06-17days on market $159,900 Active 34 DOM
-
2026-06-16days on market $159,900 Active 33 DOM
-
2026-06-15days on market $159,900 Active 32 DOM
-
2026-06-13days on market $159,900 Active 30 DOM
-
2026-06-09days on market $159,900 Active 26 DOM
-
2026-06-08days on market $159,900 Active 25 DOM
-
2026-06-07days on market $159,900 Active 24 DOM
-
2026-06-04days on market $159,900 Active 21 DOM
-
2026-06-03days on market $159,900 Active 20 DOM
-
2026-06-02days on market $159,900 Active 19 DOM
-
2026-06-01days on market $159,900 Active 18 DOM
-
2026-05-31pricedays on market $159,900 Active 17 DOM
-
2026-05-14$169,900 Active 1233-char remark
Show marketing remark (1482 chars)
INVESTOR SPECIAL - INCREDIBLE OPPORTUNITY to either update or move right into a home that lives up to it's namesake on Orchard Ave - the most spacious home on the corner of a quiet tree lined neighborhood with a blooming garden full of mature fruit trees, perennials and a covered front porch to enjoy morning coffee. Massive space - 5 bedrooms, 3 full baths, tandem garage can fit two small cars back to back with built in work bench, hooks and shelving. Many updates in last two years include gorgeous spa-like full bath on first floor with luxury tub and shower, blue tooth speaker light combo and cushy fixtures to help you relax after a long day. Home on private double lot with capability of multi family home or back area to be used as an in-law suite with its own private entry, dedicated furnace and new tankless water heater, bedroom, full bath and living area with room for a full kitchen. There are two furnaces, two tankless water heaters, some newer vinyl windows, newer carpet throughout the home and 5 ceiling fans. Upper level has two bedrooms connected to a full bath. Bonus rooms for extra space that can be used as an office, pay area or just flex space. BATVAI. Home is offered AS IS and owner will make no repairs or updates whatsoever. Seller may consider Land Contract - MUST show proof of income, taxes, credit report, cash reserves, credit worthiness and at least half down for no longer than 3 years. Call today and make this majestic home your own today!
-
2024-12-11historical
-
2024-12-11historical
-
2024-12-01price $149,900
-
2024-12-01price $149,900
-
2024-11-24$165,000 Active
-
2024-11-24$165,000 Active
-
2024-11-22historical
-
2024-11-22historical
-
2022-12-11historical
-
2022-12-11historical
-
2022-11-17$99,999 Active
-
2022-11-17$99,999 Active
-
2022-11-16historical
-
2022-11-16historical
-
2022-11-06price $109,900
-
2022-11-06price $109,900
-
2022-09-23price $119,900
-
2022-09-22price $119,900
-
2022-08-07price $129,900
-
2022-08-07price $129,900
-
2022-07-14$139,900 Active
-
2022-07-14$139,900 Active
-
2022-06-08historical
-
2022-06-08historical
-
2022-05-18price $169,900
-
2022-05-17price $169,900
-
2022-05-07$174,900 Active
-
2022-05-07$174,900 Active
-
2013-03-13historical
-
2013-03-12historical
-
2013-01-17historical
-
2012-10-24$74,900
-
2012-10-23$65,000
-
2012-10-23$65,000
-
2007-11-12soldstatus $30,000
ⓘ Source: listings_history table (triggers on properties + properties_extension) + one-shot
backfill from property_details.listing_events for pre-trigger history.
Tax reassessment forecast MI · Partial reset (capped growth)
- Current annual tax
- $1,446 · $121/mo
- Projected year-2 tax
- $1,954 · $163/mo
- Expected delta
- +$508/yr (+$42/mo · 35.1%)
ⓘ Screening estimate from a state-policy table — verify with the county assessor before closing.
Climate risk First Street
- Flood 1/10 Low FEMA zone X (unshaded) · 0% chance over 30 yrs
- Wildfire 1/10 Low
- Heat 3/10 Moderate 7 d/yr ≥97°F today · 14 d/yr by 30 yrs out
- Wind 1/10 Low
- Air quality 3/10 Moderate 3 unhealthy d/yr today · 4 by 30 yrs out
Nearby sold comps map
Loading sold comps map…
Walkable amenities ~0.75 mi
Loading nearby amenities…
Taxation est. · year 1
- Rental income
- $21,758
- − Mortgage interest
- −$8,957
- − Property taxes
- −$1,446
- − Insurance
- −$800
- − Repairs & maintenance
- −$1,741
- − Management
- −$1,741
- − Depreciation
- −$4,652
- Taxable income
- $2,422
- Est. tax owed @ 24.0%
- −$581
- After-tax cash flow
- $4,299/yr
For passive investors: Depreciation is non-cash, so a rental often shows a tax loss while cash-flowing — sheltering income. Rental losses are passive: they offset passive income freely, and up to $25,000/yr can offset ordinary (W-2) income if you actively participate and your MAGI is under $100k (phasing out to $0 by $150k); unused losses carry forward. On sale, claimed depreciation is recaptured at up to 25%, and gains may owe capital-gains tax (a 1031 exchange can defer both). Figures are a year-1 estimate at your 24.0% rate — not tax advice; consult a CPA.
Schools (NCES district)
- District
- Center Line Public Schools
- NCES district ID
- 2608580
- Math proficiency
- 14% ▼ -8.00%
- Reading proficiency
- 29% ▼ -3.00%
- Median HH income
- $38,011
- Composite
- 17.95/100
- National rank
- #8992
- State rank
- #459 of 540 in MI
Livability — Warren
- Score
- 74/100
- State rank
- #171
- US rank
- #4491
Category grades
Schools grade is shown separately in the Schools card above.
Census & demographics
- Census place
- Warren, MI
- County
- Macomb County · 638,552 people
- City population
- 114,937
- Metro
- Detroit-Warren-Dearborn, MI
- Population (ZIP)
- 30,696
- Household income
- $54,230
- Rent vs Own
- Severe rent burden
- 1296.0
Population outlook (Macomb County) Hauer SSP2
- Today (2025)
- 925,296 people
- By 2030
- 948,226 · +2.5%
- By 2040
- 983,961 · +6.3%
- By 2050
- 1,010,200 · +9.2%
- By 2075
- 1,076,222 · +16.3%
- By 2100
- 1,077,065 · +16.4%
Race, ethnicity, and origin ACS 2023
- Neighborhood character
- Diverse neighborhood (Simpson 0.68)
- Race & ethnicity
- White 47% Black 25% Asian 19% Two or more races 5% Hispanic / Latino 3% Native American 2%
- Common ancestry
- Romanian 7% Lithuanian 2% Slovak 1%
- Foreign-born
- 16% · Canada
- Languages at home
- 77% English-only · Other Indo-European 14% Other Asian/Pacific 3% Russian/Polish/Slavic 2%
Political lean MEDSL · Macomb
- 2024 margin
- R (+13.7) · D 42.2% · R 55.9% · Other 1.9%
- 2008→2024 swing
- -22.3pp toward R · 2008: 8.6pp · 2024: -13.7pp
- All cycles
- 2024: R+13.7 2020: R+8.1 2016: R+11.6 2012: D+4.0 2008: D+8.6
Not yet ingested
- Civics
- —
Market trends
- HPI YoY
- ▼ -199.66%
- Current HPI
- 177.9273
- Rent YoY
- ▲ 2.35%
- Metro
- Detroit-Warren-Dearborn, MI
- State GDP YoY
- ▲ 1.37%
- F500 in state
- 28
Industry mix (Fortune 500 HQ in MI)
| Industry | F500 HQs | Revenue |
|---|---|---|
| Automotive Parts | 3 | $48B |
|
||
| Automotive | 2 | $372B |
|
||
| Chemicals | 1 | $45B |
|
||
| Automotive Retail | 1 | $29B |
|
||
| Healthcare / Medical Devices | 1 | $23B |
|
||
| Automotive Technology | 1 | $20B |
|
||
Price history
+358.2% since first listed43 events — show timeline
- 2026-05-30 Price Changed $159,900 MiRealSource-MiMLS
- 2026-05-30 Price Changed $159,900 REALCOMP
- 2026-05-14 Listed $169,900 REALCOMP
- 2026-05-14 Listed $169,900 MiRealSource-MiMLS
- 2024-12-11 Listing Removed — REALCOMP
- 2024-12-11 Listing Removed — MiRealSource-MiMLS
- 2024-12-01 Price Changed $149,900 MiRealSource-MiMLS
- 2024-12-01 Price Changed $149,900 REALCOMP
- 2024-11-24 Listed $165,000 MiRealSource-MiMLS
- 2024-11-24 Listed $165,000 REALCOMP
- 2024-11-22 Coming Soon — MiRealSource-MiMLS
- 2024-11-22 Coming Soon — REALCOMP
- 2022-12-11 Listing Removed — MiRealSource-MiMLS
- 2022-12-11 Listing Removed — REALCOMP
- 2022-11-17 Listed $99,999 MiRealSource-MiMLS
- 2022-11-17 Listed $99,999 REALCOMP
- 2022-11-16 Listing Removed — MiRealSource-MiMLS
- 2022-11-16 Listing Removed — REALCOMP
- 2022-11-06 Price Changed $109,900 MiRealSource-MiMLS
- 2022-11-06 Price Changed $109,900 REALCOMP
- 2022-09-23 Price Changed $119,900 MiRealSource-MiMLS
- 2022-09-22 Price Changed $119,900 REALCOMP
- 2022-08-07 Price Changed $129,900 MiRealSource-MiMLS
- 2022-08-07 Price Changed $129,900 REALCOMP
- 2022-07-14 Listed $139,900 MiRealSource-MiMLS
- 2022-07-14 Listed $139,900 REALCOMP
- 2022-06-08 Listing Removed — REALCOMP
- 2022-06-08 Listing Removed — MiRealSource-MiMLS
- 2022-05-18 Price Changed $169,900 MiRealSource-MiMLS
- 2022-05-17 Price Changed $169,900 REALCOMP
- 2022-05-07 Listed $174,900 MiRealSource-MiMLS
- 2022-05-07 Listed $174,900 REALCOMP
- 2013-03-13 Listing Removed — MiRealSource-MiMLS
- 2013-03-12 Listing Removed — REALCOMP
- 2013-01-17 Listing Removed — MiRealSource-MiMLS
- 2012-10-24 Listed $74,900 MiRealSource-MiMLS
- 2012-10-23 Listed $65,000 REALCOMP
- 2012-10-23 Listed $65,000 MiRealSource-MiMLS
- 2007-11-12 Sold (MLS) $30,000 MiRealSource-MiMLS
- 2007-11-12 Sold (MLS) $30,000 REALCOMP
- 2007-10-02 Listing Removed — MiRealSource-MiMLS
- 2007-08-13 Listed $34,900 MiRealSource-MiMLS
- 2007-08-13 Listed $34,900 REALCOMP
Property tax history
+2.2%/yrLatest (2025): $1,446 · +1.7% YoY. Source: county tax records.
Cash-flow waterfall
monthlySold comps — $/sqft
last 12 mo · ≤1 miLoading sold comps…