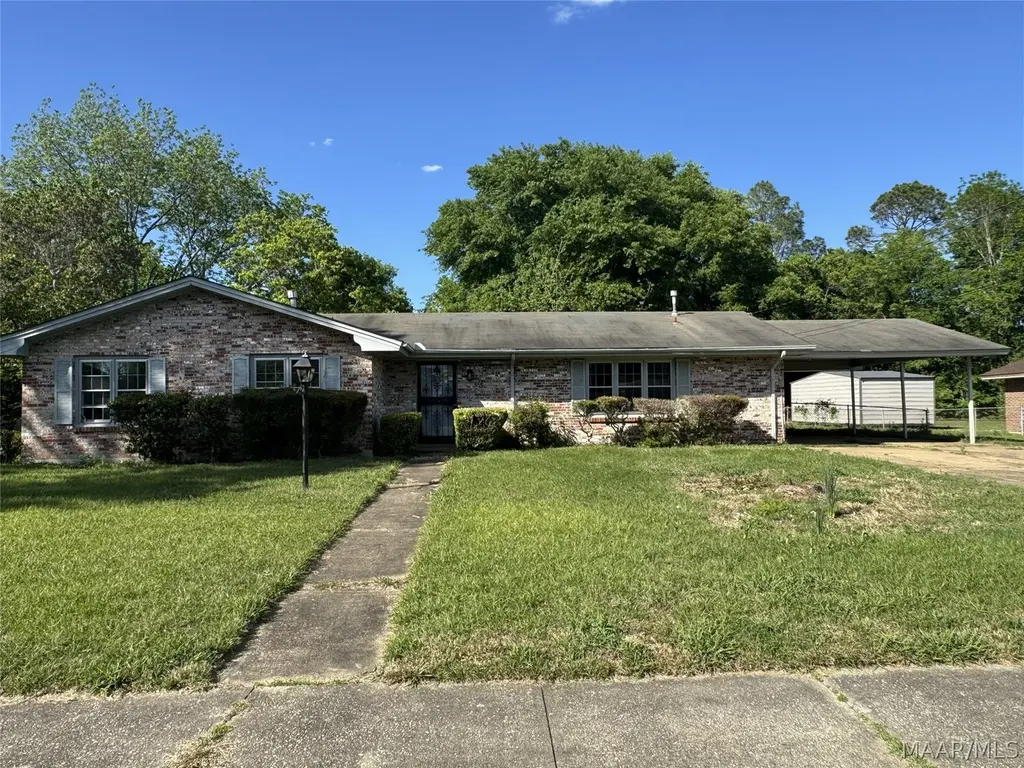
415 W Wilding Dr · Montgomery, AL
Flood risk 1/10 · Minimal
- FEMA flood zone
- X (unshaded)
- Chance of flooding over 30 yrs
- 0.0%
- Est. flood insurance / yr
- $507 – $1,088
Fire risk 2/10 · Minimal
- Est. fire insurance / yr
- $916 – $1,700
Heat risk 7/10 · Major
- Hot days now (above 108°F)
- 7 days/yr
- Hot days in 30 yrs
- 20 days/yr
Wind risk 8/10 · Major
- Chance of severe wind over 30 yrs
- 80.0%
Air-quality risk 2/10 · Minimal
- Unhealthy air days now
- 1 days/yr
- Unhealthy air days in 30 yrs
- 1 days/yr
Risk factors via First Street. Map © Google.
Why this score? — see what drove the B+ grade
The composite is a weighted blend of 9 inputs, each scored 0–100. Each bar is that input's sub-score; the figure is the points it added to the 100-point composite (weight × sub-score).
- Cash flow +30.0/30.0
- ARV discount +15.0/15.0
- 1% rule +10.0/10.0
- DSCR +10.0/10.0
- Rent growth +3.9/5.0
- Livability +3.2/5.0
- Condition / age +2.5/5.0
- Schools +1.7/10.0
- Appreciation +0.0/10.0
$83,000
🖨 Deal sheet 📄 Offer letter ✓ Due diligence
Listing remarks MLS
Comfortable living, this much loved single owner home is ready for your family. It has four bedrooms, two baths, two spacious living areas, a large master bedroom and a nice paint job inside and out. The entry foyer overlooks the living and dining combo. The HVAC system appears to be clean and in good working order. The kitchen has a Maytag dishwasher and Maytag double ovens, a gas cooktop. It is an eat-in kitchen and den/family room is open and adjacent to the den. Den also has an area with an overhead fixture for an additional eating area is desired and a full wall of built-ins on the other side of the den from the kitchen. Relax in the big den and overlook the spacious back yard. The covered patio gives an opportunity for outdoor living, a covered place for children to play. There is a grill. The yard if fully fenced and the workshop offers a getaway space which is lighted. The attached carport easily parks two vehicles. There is an existing termite bond on the property. Come home to nice neighbors who take care of each other.
Key facts
- Covered porch
- Carport
- 0.5-acre lot
Tags
Property features AI
Exterior
- Parking: Attached carport; Two carport spaces
- Utilities: Public water; Public sewer; Cable available
- Home design: Single-story home; Brick construction; Slab foundation
- Construction: Brick exterior; Built according to public records
- Exterior features: Covered patio; Patio; Fully fenced yard; Storage structure
Interior
- Kitchen: Kitchen open to family room
- Bedrooms: Three bedrooms on the first floor
- Flooring: Carpet; Tile
- Bathrooms: Two full bathrooms on the first floor
- Heating & cooling: Central heating (gas); Central electric air conditioning
- Interior features: Carpet and tile flooring; Kitchen and family room combo
- Laundry & utility: Utility room on the first floor; Gas water heater
Neighborhood map
What this means for you Summary
Snapshot
- This is a 4-bed/2.0-bath single-family listed at $83k.
Deal economics
- At list price, monthly cash flow is $762 ($9k/yr) — positive.
- The deal already cash-flows at list — no discount required.
- Meets the 1% rule at list price ($2k rent vs $83k).
- Recommended offer: $81k (3.0% below list) — sets the bar for market timing.
- Cap rate 17.3% vs local median 6.0% in Montgomery — top-decile yield for the area; either an underpriced asset or a hidden risk that comps aren't pricing in. Stress-test before assuming the spread holds.
Location & tenants
- Location reads 65/100 on livability (#138 in AL) — a middle-class / working-renter tenant base. Strengths: cost of living A+, housing A+; Watch: schools C-, employment D, crime F.
- Montgomery County (urban): math 9% / reading 31% proficiency, ranked #106 of 129 in AL (top 82%) — low school quality limits family demand, transient renter base, plan for 1-2y turnover; 70% free/reduced lunch — lower-income household profile, screen leases tightly.
- Market conditions: Rents rising fast (+5.7%/yr); 293 active listings in the ZIP; 10 comparable units currently listed for rent nearby; rentals lingering (median 44d on market — plan ~5-8 weeks vacancy on turnover, expect pricing pressure); 60% of comp listings sitting > 30 days — soft ceiling on asking rent; 460 units permitted in Montgomery County in 2024 (37 in 5+ unit buildings).
- This rent runs 35% of the median local income ($55k/yr) — at the standard rent-burdened threshold; future hikes will face affordability resistance.
Forward outlook
- Local home prices are declining (-3.0%/yr); year-one equity from $574 of loan paydown is wiped out by about $2k of value loss. Plan a longer hold.
- Montgomery County population projected to shrink 8% by 2050 — rents likely to lag national; underwrite the cash flow, not the appreciation.
- At projected returns (-3.0% appreciation + 5.7% rent growth), your $23k cash investment doubles in ~3 years — after that, you're playing with house money.
Negotiation context
- It's been on market 49 days — a 3% lower offer ($81k) is reasonable based on typical stale-listing flexibility.
- 2 sale attempts since 9y ago with the ask held roughly flat each time — persistent listings suggest the price (not the market) is what's stuck; bring a comps-based counter.
Risks & watch-outs
- Climate carrying-cost: severe wind risk, 80% chance of damaging wind over 30y; extreme-heat days projected 7→20/yr by 2055 (HVAC capex compounding) — expect insurance premiums to compound above CPI over the hold.
Questions for the listing agent
- It's been on market 49 days. Have you received any prior offers? Is the seller open to a 3% concession, seller financing, or rate buy-down credit?
- Built in 1970 — when were the roof, HVAC, electrical panel, plumbing, and water heater last replaced?
- Is there a deadline driving the sale (1031 exchange, divorce, estate, relocation)? That informs how much negotiation room exists.
- Crime grade is F in this area — have there been break-ins, vandalism, or insurance claims at this property in the last 3 years? What carrier currently insures it and at what premium?
- What's the average days-on-market for RENTAL listings here right now (not sales)? A rising rental-DOM trend means longer vacancies and softer asking-rent achievability than the comps imply.
- What's the recent tenant-quality profile in this submarket — average credit score on applications, eviction rate, late-payment / NSF rate, and stable-employment percentage? A property-management company in the area should have these aggregated.
- How much new for-sale + rental construction is in the pipeline within 1–3 miles? Heavy new supply typically softens prices + rents 12–24 months out; constrained supply supports both.
Investment metrics
- 1% rule
- 1.96% ✓
- Cap rate
- 17.31%
- Cash-on-cash
- 39.34%
- DSCR
- 2.75
- GRM
- 4.3
CMA / ARV
- ARV (on-the-fly)
- $136,734
- Comps found
- 12
Show comp detail 12 sales within ~0.75 mi
| Address | Dist | Beds/Ba | Sqft | Sold | Price | $/sf | Match |
|---|---|---|---|---|---|---|---|
| 301 Rosedon Dr | 0.27mi | 3/2.0 (-1) | 1,775 (+1%) | 9mo | $120,000 | $68 | 73 |
| 761 Spring Valley Rd | 0.39mi | 4/2.0 | 1,827 (+4%) | 3mo | $127,000 | $70 | 72 |
| 242 Smallbrook Dr | 0.41mi | 4/2.0 | 1,671 (-5%) | 1mo | $130,000 | $78 | 72 |
| 3425 Woodpark Dr | 0.39mi | 3/2.0 (-1) | 1,776 (+1%) | 8mo | $144,500 | $81 | 68 |
| 642 Mayflower Dr | 0.37mi | 3/2.0 (-1) | 1,795 (+2%) | 8mo | $156,500 | $87 | 67 |
| 218 W Wilding Dr | 0.24mi | 4/2.0 | 1,525 (-13%) | 2mo | $165,000 | $108 | 66 |
| 2621 Norwich Dr | 0.60mi | 3/2.0 (-1) | 1,765 (+1%) | 6mo | $125,000 | $71 | 61 |
| 260 Smallbrook Dr | 0.42mi | 3/2.0 (-1) | 1,594 (-9%) | 3mo | $125,000 | $78 | 58 |
| 755 Spring Valley Rd | 0.39mi | 4/2.0 | 1,992 (+14%) | 3mo | $139,900 | $70 | 56 |
| 3761 Malabar Rd | 0.69mi | 3/2.0 (-1) | 1,656 (-6%) | 2mo | $85,000 | $51 | 52 |
| 3218 Riderwood Dr | 0.68mi | 4/2.0 | 1,882 (+7%) | 9mo | $134,000 | $71 | 49 |
| 3524 Kings Cliff Rd | 0.65mi | 3/2.0 (-1) | 1,652 (-6%) | 8mo | $165,000 | $100 | 48 |
Match score weights: distance 35% · size 25% · config 20% · recency 20%. Top-matched comps best support the ARV.
Projected returns pro-forma
-3.0% appreciation · 5.65% rent growth · sell at horizon
- IRR
- 38.5%
- Equity multiple
- 2.70×
- Total profit
- $39,514
- Equity at exit
- $12,376
- IRR
- 46.2%
- Equity multiple
- 6.00×
- Total profit
- $116,122
- Equity at exit
- $7,176
Cash invested: $23,240 (down + closing). Projections, not guarantees.
Landlord ↔ Tenant lean methodology
- Overall (STATE)
- 90 Strongly Landlord-Friendly
- State Alabama
- 90 Strongly Landlord-Friendly · R+15
- County
- — inherits STATE
- City
- — inherits STATE
ZIP-level market 36116
- Home prices YoY
- -9.7%
- Rents YoY
- 5.7%
- Active inventory
- 293
- Price-to-rent
- 4.3×
Monthly cashflow live
- Estimated rent
- $1,624 high interval (Pro) →
- Mortgage (P&I)
- −$435
- Tax from tax record
- −$51 /mo · $618/yr
- Insurance
- −$35
- HOA
- −$0
- Vacancy / Maint / Mgmt
- −$341
- Net cashflow
- $762
Break-even live
UW: 25.0% down · 7.5% · 30yr · 1.5% tax · 5.0% vac · 8.0% maint · 8.0% mgmt
Financing live
Cash to close
- Down payment
- $20,750
- Closing costs
- $2,490
- Reserves months
- —
- Total cash needed
- —
Loan-product check · same deal, 3 products live
Conventional
25% down · 7.5% · 30yr
- Down + closing
- —
- Monthly P&I
- —
- Monthly cashflow
- —
- DSCR
- —
- Eligible?
- —
Personal DTI + credit; lowest rate.
DSCR
20% down · 8.5% · 30yr
- Down + closing
- —
- Monthly P&I
- —
- Monthly cashflow
- —
- DSCR
- —
- Eligible?
- —
No personal income docs; deal must DSCR.
Hard money
10% down · 12.0% · 12mo
- Down + closing
- —
- Monthly P&I
- —
- Monthly cashflow
- —
- DSCR
- —
- Eligible?
- —
Short-term bridge; refi at stabilization.
Rent comps 10 comps
| Address | Beds | Baths | Sqft | Rent | $/sqft | DOM | Units | Dist |
|---|---|---|---|---|---|---|---|---|
| 654 Mayflower Dr Montgomery, AL | 3.0 | 2.0 | 1777 | $1,400 | $0.79 | 43d | 1 | 0.34mi |
| 3324 Cross Creek Dr Montgomery, AL | 3.0 | 2.0 | 1791 | $1,395 | $0.78 | 20d | 1 | 0.35mi |
| 3633 Woodley Rd Montgomery, AL | 4.0 | 2.0 | 1734 | $1,600 | $0.92 | 20d | 1 | 0.47mi |
| 3855 Woodley Rd Montgomery, AL | 4.0 | 2.0 | 1450 | $1,450 | $1.00 | 43d | 1 | 0.49mi |
| 2699 Whispering Pine Dr Montgomery, AL | 4.0 | 2.0 | 1500 | $1,500 | $1.00 | 13d | 1 | 0.69mi |
| 3252 Cheltenham Dr Montgomery, AL | 3.0 | 2.0 | 1705 | $1,200 | $0.70 | 43d | 1 | 0.93mi |
| 2724 Endicott Dr Montgomery, AL | 5.0 | 4.0 | 1857 | $1,750 | $0.94 | 43d | 1 | 0.98mi |
| 2724 Forsyth Ln Montgomery, AL | 4.0 | 2.0 | 1794 | $1,400 | $0.78 | 43d | 1 | 1.03mi |
| 2916 Moorcroft Dr Unit 1043818P Montgomery, AL | 5.0 | 2.5 | 1496 | $5,435 | $3.63 | 13d | 1 | 1.14mi |
| 2619 Brantford Pl Montgomery, AL | 3.0 | 2.0 | 1323 | $1,200 | $0.91 | 43d | 1 | 1.23mi |
Listing history 10 events
-
2026-06-18days on market $83,000 Active 49 DOM
-
2026-06-17days on market $83,000 Active 48 DOM
-
2026-06-16days on market $83,000 Active 47 DOM
-
2026-06-15days on market $83,000 Active 46 DOM
-
2026-06-14status $83,000 Active 44 DOM
-
2026-05-02historical Contingent
-
2026-04-13$83,000 Active
-
2017-09-18soldstatus $77,000
-
2017-09-15soldstatus $76,840 1046-char remark
Show marketing remark (1046 chars)
Comfortable living, this much loved single owner home is ready for your family. It has four bedrooms, two baths, two spacious living areas, a large master bedroom and a nice paint job inside and out. The entry foyer overlooks the living and dining combo. The HVAC system appears to be clean and in good working order. The kitchen has a Maytag dishwasher and Maytag double ovens, a gas cooktop. It is an eat-in kitchen and den/family room is open and adjacent to the den. Den also has an area with an overhead fixture for an additional eating area is desired and a full wall of built-ins on the other side of the den from the kitchen. Relax in the big den and overlook the spacious back yard. The covered patio gives an opportunity for outdoor living, a covered place for children to play. There is a grill. The yard if fully fenced and the workshop offers a getaway space which is lighted. The attached carport easily parks two vehicles. There is an existing termite bond on the property. Come home to nice neighbors who take care of each other.
-
2017-03-07$84,900 1046-char remark
Show marketing remark (1046 chars)
Comfortable living, this much loved single owner home is ready for your family. It has four bedrooms, two baths, two spacious living areas, a large master bedroom and a nice paint job inside and out. The entry foyer overlooks the living and dining combo. The HVAC system appears to be clean and in good working order. The kitchen has a Maytag dishwasher and Maytag double ovens, a gas cooktop. It is an eat-in kitchen and den/family room is open and adjacent to the den. Den also has an area with an overhead fixture for an additional eating area is desired and a full wall of built-ins on the other side of the den from the kitchen. Relax in the big den and overlook the spacious back yard. The covered patio gives an opportunity for outdoor living, a covered place for children to play. There is a grill. The yard if fully fenced and the workshop offers a getaway space which is lighted. The attached carport easily parks two vehicles. There is an existing termite bond on the property. Come home to nice neighbors who take care of each other.
ⓘ Source: listings_history table (triggers on properties + properties_extension) + one-shot
backfill from property_details.listing_events for pre-trigger history.
Tax reassessment forecast AL · Resets to sale price
- Current annual tax
- $618 · $51/mo
- Projected year-2 tax
- $618 · $51/mo
- Expected delta
- $0/yr ($0/mo · 0.0%)
ⓘ Screening estimate from a state-policy table — verify with the county assessor before closing.
Climate risk First Street
- Flood 1/10 Low FEMA zone X (unshaded) · 0% chance over 30 yrs
- Wildfire 2/10 Low
- Heat 7/10 Severe 7 d/yr ≥108°F today · 20 d/yr by 30 yrs out
- Wind 8/10 Severe 80% chance of damaging wind over 30 yrs
- Air quality 2/10 Low 1 unhealthy d/yr today · 1 by 30 yrs out
Nearby sold comps map
Loading sold comps map…
Walkable amenities ~0.75 mi
Loading nearby amenities…
Taxation est. · year 1
- Rental income
- $19,492
- − Mortgage interest
- −$4,649
- − Property taxes
- −$618
- − Insurance
- −$415
- − Repairs & maintenance
- −$1,559
- − Management
- −$1,559
- − Depreciation
- −$2,415
- Taxable income
- $8,277
- Est. tax owed @ 24.0%
- −$1,986
- After-tax cash flow
- $7,156/yr
For passive investors: Depreciation is non-cash, so a rental often shows a tax loss while cash-flowing — sheltering income. Rental losses are passive: they offset passive income freely, and up to $25,000/yr can offset ordinary (W-2) income if you actively participate and your MAGI is under $100k (phasing out to $0 by $150k); unused losses carry forward. On sale, claimed depreciation is recaptured at up to 25%, and gains may owe capital-gains tax (a 1031 exchange can defer both). Figures are a year-1 estimate at your 24.0% rate — not tax advice; consult a CPA.
Schools (NCES district)
- District
- Montgomery County
- NCES district ID
- 0102430
- Math proficiency
- 9% ▼ -21.00%
- Reading proficiency
- 31% ▼ -1.00%
- Median HH income
- $43,902
- Composite
- 17.24/100
- National rank
- #9093
- State rank
- #106 of 129 in AL
Livability — Montgomery
- Score
- 65/100
- State rank
- #138
- US rank
- #13416
Category grades
Schools grade is shown separately in the Schools card above.
Census & demographics
- Census place
- Montgomery, AL
- County
- Montgomery County · 190,016 people
- City population
- 175,913
- Metro
- Montgomery, AL
- Population (ZIP)
- 45,250
- Household income
- $55,160
- Rent vs Own
- Severe rent burden
- 2786.0
Population outlook (Montgomery County) Hauer SSP2
- Today (2025)
- 224,008 people
- By 2030
- 221,460 · -1.1%
- By 2040
- 214,179 · -4.4%
- By 2050
- 204,912 · -8.5%
- By 2075
- 177,821 · -20.6%
- By 2100
- 145,134 · -35.2%
Race, ethnicity, and origin ACS 2023
- Neighborhood character
- Predominantly Black (80%)
- Race & ethnicity
- Black 80% White 12% Two or more races 4% Asian 3% Hispanic / Latino 2%
- Common ancestry
- Italian 1%
- Foreign-born
- 5% · Canada, South Korea
- Languages at home
- 94% English-only · Spanish 2% Other Indo-European 1% Korean 1%
Political lean MEDSL · Montgomery
- 2024 margin
- Solid D (+30.7) · D 64.8% · R 34.1% · Other 1.1%
- 2008→2024 swing
- +11.5pp toward D · 2008: 19.2pp · 2024: 30.7pp
- All cycles
- 2024: D+30.7 2020: D+31.5 2016: D+26.2 2012: D+24.3 2008: D+19.2
Not yet ingested
- Civics
- —
Market trends
- HPI YoY
- ▼ -16.31%
- Current HPI
- 151.8598
- Rent YoY
- ▲ 5.65%
- Metro
- Montgomery, AL
- State GDP YoY
- ▲ 2.94%
- F500 in state
- 4
Industry mix (Fortune 500 HQ in AL)
| Industry | F500 HQs | Revenue |
|---|---|---|
| Financial Services | 1 | $8B |
|
||
| Healthcare | 1 | $5B |
|
||
Price history
-2.2% since first listed5 events — show timeline
- 2026-05-02 Contingent — MAAR
- 2026-04-13 Listed $83,000 MAAR
- 2017-09-18 Sold (Public Records) $77,000 Public Records
- 2017-09-15 Sold (MLS) $76,840 MAAR
- 2017-03-07 Listed $84,900 MAAR
Property tax history
+5.1%/yrLatest (2025): $618 · -4.6% YoY. Source: county tax records.
Cash-flow waterfall
monthlySold comps — $/sqft
last 12 mo · ≤1 miLoading sold comps…