 Multi-family
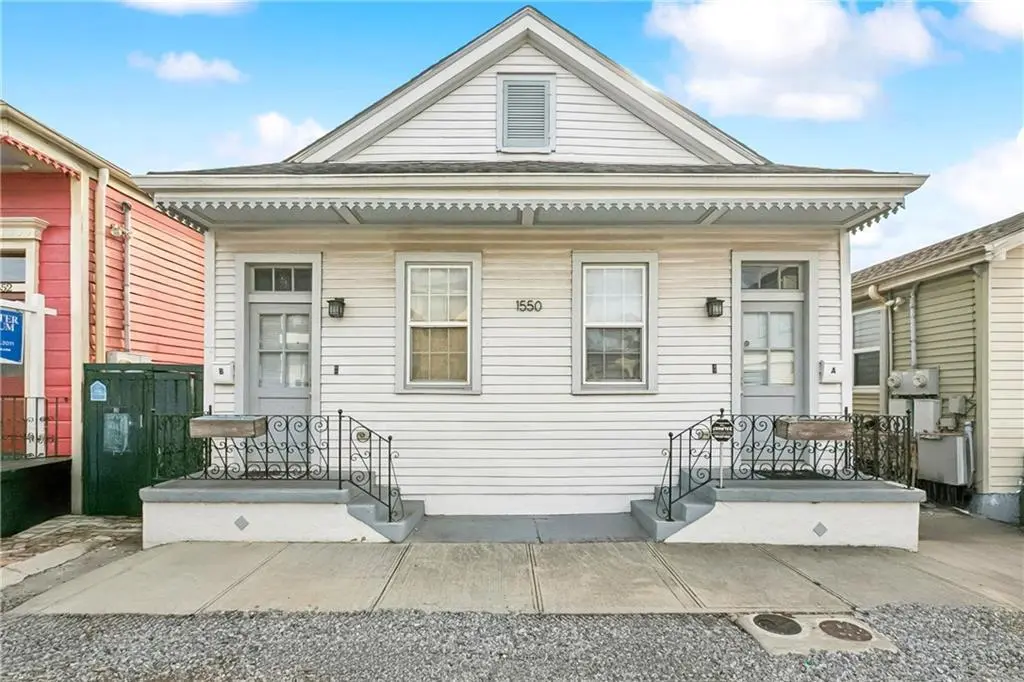
1550 N Derbigny St · New Orleans, LA
Flood risk No data
- FEMA flood zone
- —
- Chance of flooding over 30 yrs
- —
- Est. flood insurance / yr
- —
Fire risk No data
- Est. fire insurance / yr
- —
Heat risk No data
- Hot days now (above threshold)
- —
- Hot days in 30 yrs
- —
Wind risk No data
- Chance of severe wind over 30 yrs
- —
Air-quality risk No data
- Unhealthy air days now
- —
- Unhealthy air days in 30 yrs
- —
Risk factors via First Street. Map © Google.
Why this score? — see what drove the D grade
The composite is a weighted blend of 9 inputs, each scored 0–100. Each bar is that input's sub-score; the figure is the points it added to the 100-point composite (weight × sub-score).
- Cash flow +17.3/30.0
- DSCR +5.4/10.0
- ARV discount +5.0/15.0
- 1% rule +4.7/10.0
- Livability +4.0/5.0
- Rent growth +3.1/5.0
- Condition / age +2.5/5.0
- Schools +1.6/10.0
- Appreciation +0.0/10.0
$325,000
🖨 Deal sheet (PDF) 📄 Offer letter ✓ Due diligence
Multi-family units
County records classify this as Multi-Family (2-4 Unit). Listing-text estimate: 1 unit. estimate disagrees with records
Listing remarks MLS
Let's Turn Some Keys, Baby.....INCOME PRODUCING, TIMELESS, MODERN, WELL ESTABLISHED DOUBLE IN THE HEART OF THE HISTORIC 7TH WARD. YOUR REVENUE GENERATING HOME FEATURES 3 BEDS 2 BATHS ON ONE SIDE AND 2 BEDS 1 BATH ON THE OTHER. YOUR HOME OFFERS THE OPPORTUNITY TO RENT BOTH SIDES OR LIVE ON ONE SIDE AND RENT THE OTHER SIDE. SECONDS AWAY FROM ALL LOCAL ATTRACTIONS AND MINUTES AWAY FROM THE CBD. YOUR SECLUDED BACKYARD IS SIZED FOR ENJOYMENT OR JUST RELAXING. HERE'S YOUR CHANCE TO TURN SOME KEYS WHILE PROUDCING AN ADDITONAL INCOME. DID I MENTION YOUR HOME IS IN AN X FLOOD ZONE!
Key facts
- Secluded backyard
- Historic 7th ward
- Built 1920
Tags
Neighborhood map
What this means for you Summary
Snapshot
- This is a 4-bed/2.0-bath multifamily listed at $325k.
Deal economics
- At list price, monthly cash flow is $237 ($3k/yr) — positive.
- The deal already cash-flows at list — no discount required.
- To meet the 1% rule (rent ≥ 1% of price), the offer needs to be $316k (2.8% below list).
- Recommended offer: $306k (6.0% below list) — sets the bar for market timing.
- Cap rate 7.2% vs local median 4.4% in New Orleans — top-decile yield for the area; either an underpriced asset or a hidden risk that comps aren't pricing in. Stress-test before assuming the spread holds.
Location & tenants
- Location reads 81/100 on livability (#3 in LA, #1,383 nationally) — a professional / high-income tenant draw. Strengths: amenities A+, commute A+, health & safety A+; Watch: crime C-, employment D.
- Orleans Parish (urban): math 11% / reading 27% proficiency, ranked #69 of 98 in LA (top 70%) — low school quality limits family demand, transient renter base, plan for 1-2y turnover; 68% free/reduced lunch — lower-income household profile, screen leases tightly.
- Zoned schools: Benjamin Franklin Elem. Math And Science (math 12% / reading 23%, grade F, #479 of 646 statewide, top 75%, 747 students, 98% FRL, charter) — zoned schools average 98% FRL vs 68% district-wide (30 pts higher); higher-poverty schools than district average — tighter screening recommended.
- Market conditions: Rents rising (+2.5%/yr); 587 active listings in the ZIP; 40 comparable units currently listed for rent nearby; rentals at typical pace (median 26d on market — plan ~3-4 weeks tenant-placement turnaround); 710 units permitted in Orleans Parish in 2024 (244 in 5+ unit buildings).
- At $3,158/mo this rent would consume 83% of the median local household income ($46k/yr) (locally 1988% of renters already pay >50% of income on rent) — very limited rent-growth headroom before tenants either downsize or default.
Forward outlook
- Local home prices are declining (-3.0%/yr); year-one equity from $2k of loan paydown is wiped out by about $10k of value loss. Plan a longer hold.
- Orleans County population projected at +61% by 2050 — long-run rental-demand tailwind backs the buy-and-hold thesis.
Negotiation context
- It's been on market 67 days — a 6% lower offer ($306k) is reasonable based on typical stale-listing flexibility.
- 14 sale attempts since 25y ago; this cycle's ask has dropped $55k (14%) from the opening price — seller is motivated, your offer sets the floor, not the list.
Risks & watch-outs
- Watch-outs: built in 1920 — expect roof / HVAC / electrical / plumbing capex.
Questions for the listing agent
- It's been on market 67 days. Have you received any prior offers? Is the seller open to a 6% concession, seller financing, or rate buy-down credit?
- Built in 1920 — when were the roof, HVAC, electrical panel, plumbing, and water heater last replaced?
- Why hasn't it sold? Are there any deal-killer items the seller is aware of (foundation, flood, title, zoning, code violations)?
- Is there a deadline driving the sale (1031 exchange, divorce, estate, relocation)? That informs how much negotiation room exists.
- The area grade is low — what's the realistic commute time and amenity access for the typical tenant pool here? Any planned neighborhood developments (good or bad) we should know about?
- What's the average days-on-market for RENTAL listings here right now (not sales)? A rising rental-DOM trend means longer vacancies and softer asking-rent achievability than the comps imply.
- What's the recent tenant-quality profile in this submarket — average credit score on applications, eviction rate, late-payment / NSF rate, and stable-employment percentage? A property-management company in the area should have these aggregated.
- How much new apartment / multifamily construction is in the pipeline within 1–3 miles? Heavy new supply (>2% of stock underway) typically softens rents 12–24 months out; light construction supports rent growth.
Investment metrics
- 1% rule
- 0.97% ✗
- Cap rate
- 7.17%
- Cash-on-cash
- 3.13%
- DSCR
- 1.14
- GRM
- 8.6
CMA / ARV
- ARV (median comp)
- $307,642
- List price
- $325,000
- Delta
- 5.64%
- Verdict
- FAIR
- Comps
- 20 within 1.0 mi
Show comp detail 12 sales within ~0.75 mi
| Address | Dist | Beds/Ba | Sqft | Sold | Price | $/sf | Match |
|---|---|---|---|---|---|---|---|
| 1552 54 N Derbigny St | 0.01mi | 4/3.0 | 1,681 (+2%) | 5mo | $330,000 | $196 | 88 |
| 2118 20 Onzaga St | 0.32mi | 4/2.0 | 1,526 (-7%) | 1mo | $182,000 | $119 | 72 |
| 917 N Prieur St | 0.56mi | 4/2.0 | 1,700 (+3%) | 4mo | $315,000 | $185 | 66 |
| 2520 22 D'abadie St | 0.69mi | 4/2.0 | 1,632 (-1%) | 3mo | $278,600 | $171 | 64 |
| 1727 29 Marigny St | 0.70mi | 4/2.0 | 1,716 (+4%) | 1mo | $285,000 | $166 | 60 |
| 1345 Saint Anthony St | 0.37mi | 5/2.5 (+1) | 1,776 (+8%) | 7mo | $60,000 | $34 | 57 |
| 2132 Touro St | 0.61mi | 4/2.0 | 1,550 (-6%) | 6mo | $169,000 | $109 | 56 |
| 1923-25 Pauger St | 0.45mi | 4/2.0 | 1,879 (+14%) | 4mo | $70,000 | $37 | 52 |
| 1834 36 Marigny St | 0.70mi | 4/2.0 | 1,508 (-8%) | 2mo | $215,000 | $143 | 51 |
| 2134 Annette St | 0.49mi | 4/4.0 | 1,816 (+10%) | 3mo | $210,000 | $116 | 50 |
| 1917-19 N Dorgenois St | 0.67mi | 4/2.0 | 1,775 (+8%) | 7mo | $150,000 | $85 | 50 |
| 1432-1434 Ursulines Ave | 0.48mi | 4/1.0 | 1,888 (+15%) | 6mo | $228,000 | $121 | 44 |
Match score weights: distance 35% · size 25% · config 20% · recency 20%. Top-matched comps best support the ARV.
Projected returns pro-forma
-3.0% appreciation · 2.49% rent growth · sell at horizon
- IRR
- -11.9%
- Equity multiple
- 0.57×
- Total profit
- $-39,110
- Equity at exit
- $48,459
- IRR
- -3.5%
- Equity multiple
- 0.77×
- Total profit
- $-20,923
- Equity at exit
- $28,100
Cash invested: $91,000 (down + closing). Projections, not guarantees.
Landlord ↔ Tenant lean methodology
- Overall (STATE)
- 90 Strongly Landlord-Friendly
- State Louisiana
- 90 Strongly Landlord-Friendly · R+12
- County
- — inherits STATE
- City
- — inherits STATE
ZIP-level market 70117
- Rents YoY
- 2.5%
- Active inventory
- 587
- Price-to-rent
- 16.3×
Monthly cashflow live
- Estimated rent
- $3,158 high interval (Pro) →
- Mortgage (P&I)
- −$1,704
- Tax from tax record
- −$418 /mo · $5,014/yr
- Insurance
- −$135
- HOA
- −$0
- Vacancy / Maint / Mgmt
- −$663
- Net cashflow
- $237
Break-even live
Sensitivity live
| Price | -10% $421 | -5% $329 | +0% $237 | +5% $145 | +10% $53 |
|---|---|---|---|---|---|
| Rent | -10% $-12 | -5% $113 | +0% $237 | +5% $362 | +10% $487 |
| Rate | -1.0pp $401 | -0.5pp $320 | base $237 | +0.5pp $153 | +1.0pp $67 |
2-unit breakdown (identical units grouped — click to expand)
| Units | Beds | Baths | Est. rent |
|---|---|---|---|
| 1× unit | 3 | 2 | $1,661 |
| 1× unit | 2 | 1 | $1,497 |
| Total (2 units) | $3,158 | ||
UW: 25.0% down · 7.5% · 30yr · 1.5% tax · 5.0% vac · 8.0% maint · 8.0% mgmt
Financing live
Cash to close
- Down payment
- $81,250
- Closing costs
- $9,750
- Reserves months
- —
- Total cash needed
- —
Loan-product check · same deal, 3 products live
Conventional
25% down · 7.5% · 30yr
- Down + closing
- —
- Monthly P&I
- —
- Monthly cashflow
- —
- DSCR
- —
- Eligible?
- —
Personal DTI + credit; lowest rate.
DSCR
20% down · 8.5% · 30yr
- Down + closing
- —
- Monthly P&I
- —
- Monthly cashflow
- —
- DSCR
- —
- Eligible?
- —
No personal income docs; deal must DSCR.
Hard money
10% down · 12.0% · 12mo
- Down + closing
- —
- Monthly P&I
- —
- Monthly cashflow
- —
- DSCR
- —
- Eligible?
- —
Short-term bridge; refi at stabilization.
Rent comps 40 comps
| Address | Beds | Baths | Sqft | Rent | $/sqft | DOM | Units | Dist |
|---|---|---|---|---|---|---|---|---|
| 1472 N Claiborne Ave New Orleans, LA | 3.0 | 1.0 | 1312 | $1,900 | $1.45 | 17d | 1 | 0.17mi |
| 1245 Kerlerec St New Orleans, LA | 3.0 | 2.0 | 1500 | $2,500 | $1.67 | 45d | 1 | 0.37mi |
| 1247 Kerlerec St New Orleans, LA | 3.0 | 2.0 | 1500 | $2,500 | $1.67 | 45d | 1 | 0.37mi |
| 1936 N Johnson St Unit 36 New Orleans, LA | 3.0 | 2.0 | 1844 | $2,400 | $1.30 | 25d | 1 | 0.40mi |
| 1938 N Johnson St Unit 38 New Orleans, LA | 3.0 | 2.0 | 1844 | $2,400 | $1.30 | 25d | 1 | 0.40mi |
| 1217 Kerlerec St Unit B New Orleans, LA | 3.0 | 1.0 | 1300 | $2,100 | $1.62 | 5d | 1 | 0.40mi |
| 1923 N Robertson St New Orleans, LA | 3.0 | 2.0 | 1051 | $1,950 | $1.86 | 5d | 1 | 0.41mi |
| 2329 Laharpe St New Orleans, LA | 3.0 | 1.0 | 1250 | $1,000 | $0.80 | 21d | 1 | 0.44mi |
| 1831 N Miro St New Orleans, LA | 3.0 | 2.0 | 1882 | $2,500 | $1.33 | 45d | 1 | 0.44mi |
| 1035 N Derbigny St New Orleans, LA | 3.0 | 1.0 | 1075 | $1,399 | $1.30 | 25d | 1 | 0.45mi |
| 2331 Columbus St New Orleans, LA | 3.0 | 1.0 | 1976 | $1,850 | $0.94 | 25d | 1 | 0.46mi |
| 1735 N Tonti St New Orleans, LA | 3.0 | 1.0 | 1197 | $1,650 | $1.38 | 25d | 1 | 0.47mi |
| 1837 Touro St New Orleans, LA | 3.0 | 1.0 | 1994 | $2,000 | $1.00 | 25d | 1 | 0.50mi |
| 2920 Pauger St New Orleans, LA | 4.0 | 2.0 | 1882 | $1,995 | $1.06 | 25d | 1 | 0.58mi |
| 1929 Dumaine St New Orleans, LA | 3.0 | 1.0 | 1293 | $1,500 | $1.16 | 5d | 1 | 0.59mi |
| 2338 Annette St Unit 1 New Orleans, LA | 3.0 | 1.0 | 1150 | $1,400 | $1.22 | 21d | 1 | 0.60mi |
| 928 Kerlerec St New Orleans, LA | 3.0 | 3.5 | 1684 | $2,750 | $1.63 | 4d | 1 | 0.60mi |
| 928 Kerlerec St New Orleans, LA | 3.0 | 3.5 | 1684 | $2,750 | $1.63 | 5d | 1 | 0.60mi |
| 1021 Henriette Delille St New Orleans, LA | 3.0 | 2.0 | 2012 | $2,250 | $1.12 | 19d | 1 | 0.61mi |
| 2129 Dumaine St New Orleans, LA | 3.0 | 2.0 | 1226 | $1,850 | $1.51 | 5d | 1 | 0.63mi |
| 2517 Ursulines Ave New Orleans, LA | 3.0 | 2.0 | 1136 | $1,950 | $1.72 | 25d | 1 | 0.65mi |
| 1710 Marigny St New Orleans, LA | 3.0 | 2.0 | 1120 | $1,750 | $1.56 | 25d | 1 | 0.66mi |
| 2220 N Prieur St New Orleans, LA | 3.0 | 2.0 | 1334 | $2,000 | $1.50 | 25d | 1 | 0.67mi |
| 1525 N Broad St New Orleans, LA | 3.0 | 1.0 | 1100 | $1,600 | $1.45 | 25d | 1 | 0.68mi |
| 2107 Elysian Fields Ave New Orleans, LA | 4.0 | 2.0 | 1794 | $1,650 | $0.92 | 5d | 1 | 0.71mi |
| 2115 Elysian Fields Ave Unit 2115 New Orleans, LA | 3.0 | 1.0 | 1100 | $1,450 | $1.32 | 25d | 1 | 0.72mi |
| 3228 Pauger St New Orleans, LA | 5.0 | 2.0 | 1600 | $2,100 | $1.31 | 25d | 1 | 0.77mi |
| 2310 George Nick Connor Dr New Orleans, LA | 3.0 | 2.0 | 1050 | $1,600 | $1.52 | 25d | 1 | 0.77mi |
| 2664 Lepage St New Orleans, LA | 3.0 | 2.0 | 1750 | $2,725 | $1.56 | 45d | 1 | 0.78mi |
| 1418 Royal St Unit 1418 New Orleans, LA | 4.0 | 2.0 | 1300 | $2,450 | $1.88 | 25d | 1 | 0.79mi |
| 1818 Paul Morphy St Unit B New Orleans, LA | 3.0 | 2.0 | 1065 | $1,800 | $1.69 | 25d | 1 | 0.80mi |
| 2317 N Rampart St Unit 1272378P New Orleans, LA | 3.0–6.0 | 2.0–4.0 | 1581 | $4,154 | $2.63 | 5d | 2 | 0.81mi |
| 734 Ursulines Ave New Orleans, LA | 3.0 | 2.0 | 1340 | $2,800 | $2.09 | 45d | 1 | 0.82mi |
| 811 Burgundy St New Orleans, LA | 4.0 | 2.5 | 2059 | $5,000 | $2.43 | 45d | 1 | 0.83mi |
| 2115 Mandeville St New Orleans, LA | 3.0 | 2.0 | 1400 | $1,650 | $1.18 | 25d | 1 | 0.84mi |
| 2322 Burgundy St Unit C New Orleans, LA | 3.0 | 2.0 | 1250 | $2,200 | $1.76 | 25d | 1 | 0.86mi |
| 2731 Saint Philip St Unit 2733 New Orleans, LA | 4.0 | 2.0 | 2000 | $2,600 | $1.30 | 25d | 1 | 0.87mi |
| 1466 N White St New Orleans, LA | 3.0 | 1.5 | 1500 | $2,250 | $1.50 | 5d | 1 | 0.87mi |
| 1908 Saint Louis St New Orleans, LA | 3.0 | 3.0 | 1234 | $2,300 | $1.86 | 25d | 1 | 0.89mi |
| 618 N Rampart St #204 New Orleans, LA | 3.0 | 2.5 | 1904 | $4,500 | $2.36 | 45d | 1 | 0.91mi |
Listing history 42 events
-
2026-06-21days on market $325,000 Active 67 DOM
-
2026-06-18days on market $325,000 Active 64 DOM
-
2026-06-17days on market $325,000 Active 63 DOM
-
2026-06-16days on market $325,000 Active 62 DOM
-
2026-06-15days on market $325,000 Active 61 DOM
-
2026-06-13days on market $325,000 Active 59 DOM
-
2026-06-10days on market $325,000 Active 56 DOM
-
2026-06-09days on market $325,000 Active 55 DOM
-
2026-06-08days on market $325,000 Active 54 DOM
-
2026-06-07days on market $325,000 Active 53 DOM
-
2026-06-05days on market $325,000 Active 50 DOM
-
2026-06-03pricedays on market $325,000 Active 49 DOM
-
2026-06-02days on market $350,000 Active 48 DOM
-
2026-06-01days on market $350,000 Active 47 DOM
-
2026-05-31days on market $350,000 Active 46 DOM
-
2026-05-04price $375,000 579-char remark
Show marketing remark (583 chars)
Let's Turn Some Keys, Baby. .. .. INCOME PRODUCING, TIMELESS, MODERN, WELL ESTABLISHED DOUBLE IN THE HEART OF THE HISTORIC 7TH WARD. YOUR REVENUE GENERATING HOME FEATURES 3 BEDS 2 BATHS ON ONE SIDE AND 2 BEDS 1 BATH ON THE OTHER. YOUR HOME OFFERS THE OPPORTUNITY TO RENT BOTH SIDES OR LIVE ON ONE SIDE AND RENT THE OTHER SIDE. SECONDS AWAY FROM ALL LOCAL ATTRACTIONS AND MINUTES AWAY FROM THE CBD. YOUR SECLUDED BACKYARD IS SIZED FOR ENJOYMENT OR JUST RELAXING. HERE'S YOUR CHANCE TO TURN SOME KEYS WHILE PROUDCING AN ADDITONAL INCOME. DID I MENTION YOUR HOME IS IN AN X FLOOD ZONE!
-
2026-05-04price $375,000 583-char remark
Show marketing remark (583 chars)
Let's Turn Some Keys, Baby. .. .. INCOME PRODUCING, TIMELESS, MODERN, WELL ESTABLISHED DOUBLE IN THE HEART OF THE HISTORIC 7TH WARD. YOUR REVENUE GENERATING HOME FEATURES 3 BEDS 2 BATHS ON ONE SIDE AND 2 BEDS 1 BATH ON THE OTHER. YOUR HOME OFFERS THE OPPORTUNITY TO RENT BOTH SIDES OR LIVE ON ONE SIDE AND RENT THE OTHER SIDE. SECONDS AWAY FROM ALL LOCAL ATTRACTIONS AND MINUTES AWAY FROM THE CBD. YOUR SECLUDED BACKYARD IS SIZED FOR ENJOYMENT OR JUST RELAXING. HERE'S YOUR CHANCE TO TURN SOME KEYS WHILE PROUDCING AN ADDITONAL INCOME. DID I MENTION YOUR HOME IS IN AN X FLOOD ZONE!
-
2026-04-15$380,000 Active 579-char remark
Show marketing remark (583 chars)
Let's Turn Some Keys, Baby. .. .. INCOME PRODUCING, TIMELESS, MODERN, WELL ESTABLISHED DOUBLE IN THE HEART OF THE HISTORIC 7TH WARD. YOUR REVENUE GENERATING HOME FEATURES 3 BEDS 2 BATHS ON ONE SIDE AND 2 BEDS 1 BATH ON THE OTHER. YOUR HOME OFFERS THE OPPORTUNITY TO RENT BOTH SIDES OR LIVE ON ONE SIDE AND RENT THE OTHER SIDE. SECONDS AWAY FROM ALL LOCAL ATTRACTIONS AND MINUTES AWAY FROM THE CBD. YOUR SECLUDED BACKYARD IS SIZED FOR ENJOYMENT OR JUST RELAXING. HERE'S YOUR CHANCE TO TURN SOME KEYS WHILE PROUDCING AN ADDITONAL INCOME. DID I MENTION YOUR HOME IS IN AN X FLOOD ZONE!
-
2026-04-15$380,000 Active 583-char remark
Show marketing remark (583 chars)
Let's Turn Some Keys, Baby. .. .. INCOME PRODUCING, TIMELESS, MODERN, WELL ESTABLISHED DOUBLE IN THE HEART OF THE HISTORIC 7TH WARD. YOUR REVENUE GENERATING HOME FEATURES 3 BEDS 2 BATHS ON ONE SIDE AND 2 BEDS 1 BATH ON THE OTHER. YOUR HOME OFFERS THE OPPORTUNITY TO RENT BOTH SIDES OR LIVE ON ONE SIDE AND RENT THE OTHER SIDE. SECONDS AWAY FROM ALL LOCAL ATTRACTIONS AND MINUTES AWAY FROM THE CBD. YOUR SECLUDED BACKYARD IS SIZED FOR ENJOYMENT OR JUST RELAXING. HERE'S YOUR CHANCE TO TURN SOME KEYS WHILE PROUDCING AN ADDITONAL INCOME. DID I MENTION YOUR HOME IS IN AN X FLOOD ZONE!
-
2025-06-27price $370,000
-
2025-06-27price $370,000
-
2025-06-03price $380,000
-
2025-06-03price $380,000
-
2025-04-02$390,000 Active
-
2021-01-19soldstatus $380,000
-
2021-01-14soldstatus $380,000 Closed
-
2020-12-21status Pending
-
2020-12-10$398,000
-
2020-12-10$398,000 Active
-
2020-10-24$398,500
-
2020-09-17price $398,500
-
2020-09-09$398,500
-
2020-07-18price $405,900
-
2020-06-07$405,900
-
2010-04-26$74,500
-
2010-04-26$74,500
-
2002-05-31soldstatus $65,000
-
2001-12-24$65,650
-
2001-12-24$65,650
-
2001-09-14soldstatus $15,000
-
2001-09-07$21,000
-
2001-09-07$21,000
ⓘ Source: listings_history table (triggers on properties + properties_extension) + one-shot
backfill from property_details.listing_events for pre-trigger history.
Tax reassessment forecast LA · Resets to sale price
- Current annual tax
- $5,014 · $418/mo
- Projected year-2 tax
- $5,014 · $418/mo
- Expected delta
- $0/yr ($0/mo · 0.0%)
ⓘ Screening estimate from a state-policy table — verify with the county assessor before closing.
Nearby sold comps map
Loading sold comps map…
Walkable amenities ~0.75 mi
Loading nearby amenities…
Taxation est. · year 1
- Rental income
- $37,896
- − Mortgage interest
- −$18,205
- − Property taxes
- −$5,014
- − Insurance
- −$1,625
- − Repairs & maintenance
- −$3,032
- − Management
- −$3,032
- − Depreciation
- −$9,455
- Taxable loss
- −$2,465
- Est. tax savings @ 24.0%
- +$592
- After-tax cash flow
- $3,439/yr
For passive investors: Depreciation is non-cash, so a rental often shows a tax loss while cash-flowing — sheltering income. Rental losses are passive: they offset passive income freely, and up to $25,000/yr can offset ordinary (W-2) income if you actively participate and your MAGI is under $100k (phasing out to $0 by $150k); unused losses carry forward. On sale, claimed depreciation is recaptured at up to 25%, and gains may owe capital-gains tax (a 1031 exchange can defer both). Figures are a year-1 estimate at your 24.0% rate — not tax advice; consult a CPA.
Schools (NCES district)
- District
- Orleans Parish
- NCES district ID
- 2201170
- Math proficiency
- 11% ▼ -52.00%
- Reading proficiency
- 27% ▼ -46.00%
- Median HH income
- $37,011
- Composite
- 15.78/100
- National rank
- #9271
- State rank
- #69 of 98 in LA
Livability — New Orleans
- Score
- 81/100
- State rank
- #3
- US rank
- #1383
Category grades
Schools grade is shown separately in the Schools card above.
Census & demographics
- Census place
- New Orleans, LA
- County
- Orleans Parish · 338,817 people
- City population
- 338,817
- Metro
- New Orleans-Metairie, LA
- Population (ZIP)
- 25,652
- Household income
- $45,764
- Rent vs Own
- Severe rent burden
- 1988.0
Population outlook (Orleans County) Hauer SSP2
- Today (2025)
- 513,025 people
- By 2030
- 575,781 · +12.2%
- By 2040
- 700,174 · +36.5%
- By 2050
- 826,541 · +61.1%
- By 2075
- 1,123,374 · +119.0%
- By 2100
- 1,355,609 · +164.2%
Race, ethnicity, and origin ACS 2023
- Neighborhood character
- Majority Black (60%)
- Race & ethnicity
- Black 60% White 30% Two or more races 6% Hispanic / Latino 5%
- Common ancestry
- Lithuanian 5% Italian 1% Romanian 1%
- Foreign-born
- 5% · Canada, South Korea
- Languages at home
- 93% English-only · Spanish 3% Other Indo-European 1% French/Haitian/Cajun 1%
Political lean MEDSL · Orleans
- 2024 margin
- Solid D (+67.0) · D 82.2% · R 15.2% · Other 2.7%
- 2008→2024 swing
- +6.7pp toward D · 2008: 60.3pp · 2024: 67.0pp
- All cycles
- 2024: D+67.0 2020: D+68.2 2016: D+66.2 2012: D+62.5 2008: D+60.3
Not yet ingested
- Civics
- —
Market trends
- HPI YoY
- ▼ -177.22%
- Current HPI
- 184.6061
- Rent YoY
- ▲ 2.49%
- Metro
- New Orleans-Metairie, LA
- State GDP YoY
- ▲ 3.29%
- F500 in state
- 10
Industry mix (Fortune 500 HQ in LA)
| Industry | F500 HQs | Revenue |
|---|---|---|
| Telecommunications | 2 | $23B |
|
||
| Utilities | 1 | $12B |
|
||
| Wholesale / Distribution | 1 | $5B |
|
||
| Advertising | 1 | $2B |
|
||
Price history
+1685.7% since first listed27 events — show timeline
- 2026-05-04 Price Changed $375,000 AcadianaMLS
- 2026-05-04 Price Changed $375,000 GSREIN
- 2026-04-15 Listed $380,000 GSREIN
- 2026-04-15 Listed $380,000 AcadianaMLS
- 2025-06-27 Price Changed $370,000 AcadianaMLS
- 2025-06-27 Price Changed $370,000 GSREIN
- 2025-06-03 Price Changed $380,000 AcadianaMLS
- 2025-06-03 Price Changed $380,000 GSREIN
- 2025-04-02 Listed $390,000 AcadianaMLS
- 2021-01-19 Sold (Public Records) $380,000 Public Records
- 2021-01-14 Sold (MLS) $380,000 GSREIN
- 2020-12-21 Pending — GSREIN
- 2020-12-10 Listed $398,000 GSREIN
- 2020-12-10 Listed $398,000 AcadianaMLS
- 2020-10-24 Listed $398,500 AcadianaMLS
- 2020-09-17 Price Changed $398,500 GSREIN
- 2020-09-09 Listed $398,500 AcadianaMLS
- 2020-07-18 Price Changed $405,900 GSREIN
- 2020-06-07 Listed $405,900 AcadianaMLS
- 2010-04-26 Listed $74,500 GSREIN
- 2010-04-26 Listed $74,500 AcadianaMLS
- 2002-05-31 Sold (MLS) $65,000 GSREIN
- 2001-12-24 Listed $65,650 AcadianaMLS
- 2001-12-24 Listed $65,650 GSREIN
- 2001-09-14 Sold (MLS) $15,000 GSREIN
- 2001-09-07 Listed $21,000 GSREIN
- 2001-09-07 Listed $21,000 AcadianaMLS
Property tax history
+13.4%/yrLatest (2026): $5,014 · +1.1% YoY. Source: county tax records.
Cash-flow waterfall
monthlySold comps — $/sqft
last 12 mo · ≤1 miLoading sold comps…