15010 SW 25th Pl · Rainbow Park, FL
Flood risk No data
- FEMA flood zone
- —
- Chance of flooding over 30 yrs
- —
- Est. flood insurance / yr
- —
Fire risk No data
- Est. fire insurance / yr
- —
Heat risk No data
- Hot days now (above threshold)
- —
- Hot days in 30 yrs
- —
Wind risk No data
- Chance of severe wind over 30 yrs
- —
Air-quality risk No data
- Unhealthy air days now
- —
- Unhealthy air days in 30 yrs
- —
Risk factors via First Street. Map © Google.
Why this score? — see what drove the D+ grade
The composite is a weighted blend of 9 inputs, each scored 0–100. Each bar is that input's sub-score; the figure is the points it added to the 100-point composite (weight × sub-score).
- Cash flow +13.3/30.0
- ARV discount +12.8/15.0
- Condition / age +5.0/5.0
- DSCR +4.0/10.0
- 1% rule +3.7/10.0
- Schools +3.6/10.0
- Rent growth +2.5/5.0
- Livability +2.5/5.0
- Appreciation +0.0/10.0
$209,900
🖨 Deal sheet (PDF) 📄 Offer letter ✓ Due diligence
Listing remarks
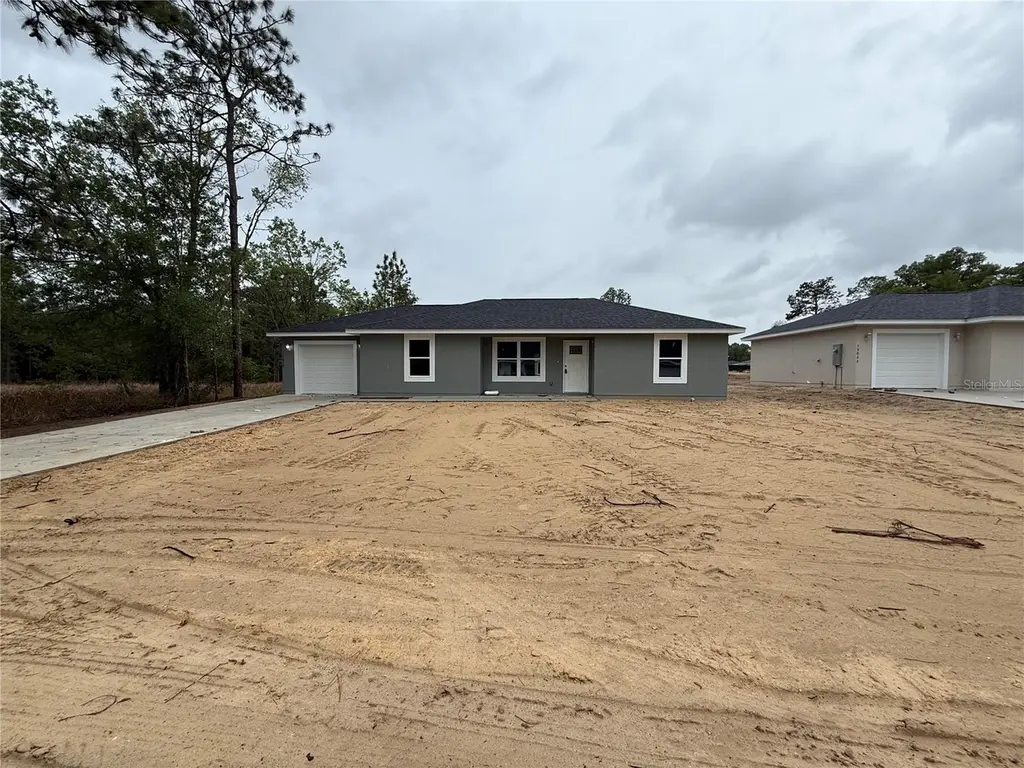
Brand new spacious Stucco exterior frame home at an affordable price! Split plan three bedroom / two bathroom with attached finished one car garage that is equipped with a garage door opener. The kitchen offers Granite counter tops with upgraded cabinets. Stainless steel appliance package which includes the range, microwave, dishwasher and refrigerator. Tile in the bathrooms, Ceiling fans and more. Great location to shopping, activities, medical facilities and restaurants.
Key facts
- Ceiling fans
- Stucco exterior
- Granite counter tops
Tags
Property features AI
Finance
- Other: Lot approximately 0.23 acre (75 x 135); Projected completion date April 30, 2026; Permit number 123456; Zoning: R1
Exterior
- Parking: Attached garage (1 car, 12x20); Carport present
- Security: Smoke detector(s)
- Utilities: Well water; Septic tank; Electricity connected
- Home design: Single family residence; One story; New construction (completed); Property faces north; Attached property
- Construction: Stucco and frame construction; Shingle roof; Slab foundation; Built by Brooks Construction (model JC1)
- Exterior features: Sliding doors; Cleared lot; Corner lot; In-county location; Limerock road frontage; Public maintained road
Interior
- Kitchen: Dishwasher; Microwave; Range; Refrigerator
- Bedrooms: 3 bedrooms
- Flooring: Tile
- Bathrooms: 2 full bathrooms
- Heating & cooling: Heat pump; Central air conditioning
- Interior features: High ceilings; Split bedroom layout; Programmable thermostat; Walk-in closet(s); Inside utility/additional room; Smoke detector(s)
- Laundry & utility: Laundry inside
Neighborhood map
What this means for you Summary
Snapshot
- This is a 3-bed/2.0-bath single-family listed at $210k. Condition is rated excellent.
Deal economics
- At list price, monthly cash flow is $-1 ($-11/yr) — negative.
- To cash-flow at today's rent, offer at most $210k (0.1% below list).
- To meet the 1% rule (rent ≥ 1% of price), the offer needs to be $183k (12.6% below list).
- Recommended offer: $183k (12.6% below list) — sets the bar for 1% rule.
Location & tenants
- Location reads: area grade D — affects rentability + tenant quality, not the cash-flow math above.
- Marion (rural): math 42% / reading 43% proficiency, ranked #61 of 73 in FL (top 84%) — families likely to look elsewhere, expect single-tenant / working-renter base with shorter leases; 61% free/reduced lunch — lower-income household profile, screen leases tightly.
- Zoned schools: Dunnellon Elementary School (math 46% / reading 48%, grade D-, #1,191 of 2,144 statewide, top 57%, 580 students, 61% FRL); Dunnellon Middle School (math 48% / reading 42%, grade D, #310 of 571 statewide, top 56%, 678 students, 68% FRL); Dunnellon High School (math 30% / reading 32%, grade F, #429 of 667 statewide, top 65%, 1,350 students, 63% FRL) — zoned schools at 64% FRL track the district average.
- Market conditions: 1161 active listings in the ZIP; 5 comparable units currently listed for rent nearby; rentals at typical pace (median 16d on market — plan ~3-4 weeks tenant-placement turnaround); 7,071 units permitted in Marion County in 2024 (534 in 5+ unit buildings).
- This rent runs 38% of the median local income ($57k/yr) — at the standard rent-burdened threshold; future hikes will face affordability resistance.
Forward outlook
- Local home prices are declining (-3.0%/yr); year-one equity from $1k of loan paydown is wiped out by about $6k of value loss. Plan a longer hold.
- Marion County population projected at +13% by 2050 — modest demand growth; plan on rents tracking national, not racing it.
Negotiation context
- Only 10 days on market — expect competitive offers; lowballing is unlikely to land.
- 2 sale attempts with the ask held roughly flat each time — persistent listings suggest the price (not the market) is what's stuck; bring a comps-based counter.
Questions for the listing agent
- What do current leases actually rent for vs. the listed asking? Can we see a recent rent roll and the last 12 months of T-12 income?
- Is there a deadline driving the sale (1031 exchange, divorce, estate, relocation)? That informs how much negotiation room exists.
- The area grade is low — what's the realistic commute time and amenity access for the typical tenant pool here? Any planned neighborhood developments (good or bad) we should know about?
- What's the average days-on-market for RENTAL listings here right now (not sales)? A rising rental-DOM trend means longer vacancies and softer asking-rent achievability than the comps imply.
- What's the recent tenant-quality profile in this submarket — average credit score on applications, eviction rate, late-payment / NSF rate, and stable-employment percentage? A property-management company in the area should have these aggregated.
- How much new for-sale + rental construction is in the pipeline within 1–3 miles? Heavy new supply typically softens prices + rents 12–24 months out; constrained supply supports both.
Investment metrics
- 1% rule
- 0.87% ✗
- Cap rate
- 6.29%
- Cash-on-cash
- -0.02%
- DSCR
- 1.00
- GRM
- 9.5
CMA / ARV
- ARV (on-the-fly)
- $237,776
- Comps found
- 12
Show comp detail 12 sales within ~0.75 mi
| Address | Dist | Beds/Ba | Sqft | Sold | Price | $/sf | Match |
|---|---|---|---|---|---|---|---|
| 14911 SW 27th St | 0.14mi | 3/2.0 | 1,266 (+3%) | 21mo | $235,000 | $186 | 71 |
| 14689 SW 30th Pl | 0.49mi | 3/2.0 | 1,232 (0%) | 8mo | $210,900 | $171 | 71 |
| 14663 SW 30th Pl | 0.50mi | 3/2.0 | 1,232 (0%) | 9mo | $205,900 | $167 | 70 |
| 15228 SW 16th St | 0.67mi | 3/2.0 | 1,267 (+3%) | 8mo | $237,900 | $188 | 57 |
| 15512 SW 29 St | 0.58mi | 3/2.0 | 1,267 (+3%) | 18mo | $244,900 | $193 | 54 |
| 15422 SW 30 St | 0.46mi | 3/2.0 | 1,089 (-12%) | 10mo | $224,000 | $206 | 51 |
| 15555 SW 27th Ln | 0.51mi | 3/2.0 | 1,089 (-12%) | 8mo | $215,000 | $197 | 50 |
| 14386 SW 26th Ln | 0.66mi | 3/2.0 | 1,127 (-8%) | 14mo | $225,000 | $200 | 43 |
| 2329 SW 143rd Ct | 0.65mi | 3/2.0 | 1,380 (+12%) | 12mo | $259,900 | $188 | 40 |
| 3290 SW 151st Ave | 0.58mi | 3/2.0 | 1,066 (-14%) | 15mo | $212,995 | $200 | 38 |
| 15445 SW 29 St | 0.53mi | 3/2.0 | 1,058 (-14%) | 17mo | $209,000 | $198 | 37 |
| 2388 SW 143rd Ct | 0.65mi | 3/2.0 | 1,058 (-14%) | 16mo | $199,900 | $189 | 33 |
Match score weights: distance 35% · size 25% · config 20% · recency 20%. Top-matched comps best support the ARV.
Projected returns pro-forma
-3.0% appreciation · 3.0% rent growth · sell at horizon
- IRR
- -16.3%
- Equity multiple
- 0.42×
- Total profit
- $-34,044
- Equity at exit
- $31,297
- IRR
- -8.0%
- Equity multiple
- 0.50×
- Total profit
- $-29,609
- Equity at exit
- $18,148
Cash invested: $58,772 (down + closing). Projections, not guarantees.
Landlord ↔ Tenant lean methodology
- Overall (STATE)
- 87 Strongly Landlord-Friendly
- State Florida
- 87 Strongly Landlord-Friendly · R+3
- County
- — inherits STATE
- City
- — inherits STATE
ZIP-level market 34481
- Home prices YoY
- -25.2%
- Active inventory
- 1161
- Price-to-rent
- 9.5×
Monthly cashflow live
- Estimated rent
- $1,835 high interval (Pro) →
- Mortgage (P&I)
- −$1,101
- Tax est. 1.5%
- −$262 /mo · $3,148/yr
- Insurance
- −$87
- HOA
- −$0
- Vacancy / Maint / Mgmt
- −$385
- Net cashflow
- $-1
Break-even live
Sensitivity live
| Price | -10% $144 | -5% $72 | +0% $-1 | +5% $-73 | +10% $-146 |
|---|---|---|---|---|---|
| Rent | -10% $-146 | -5% $-73 | +0% $-1 | +5% $72 | +10% $144 |
| Rate | -1.0pp $105 | -0.5pp $52 | base $-1 | +0.5pp $-55 | +1.0pp $-111 |
UW: 25.0% down · 7.5% · 30yr · 1.5% tax · 5.0% vac · 8.0% maint · 8.0% mgmt
Financing live
Cash to close
- Down payment
- $52,475
- Closing costs
- $6,297
- Reserves months
- —
- Total cash needed
- —
Loan-product check · same deal, 3 products live
Conventional
25% down · 7.5% · 30yr
- Down + closing
- —
- Monthly P&I
- —
- Monthly cashflow
- —
- DSCR
- —
- Eligible?
- —
Personal DTI + credit; lowest rate.
DSCR
20% down · 8.5% · 30yr
- Down + closing
- —
- Monthly P&I
- —
- Monthly cashflow
- —
- DSCR
- —
- Eligible?
- —
No personal income docs; deal must DSCR.
Hard money
10% down · 12.0% · 12mo
- Down + closing
- —
- Monthly P&I
- —
- Monthly cashflow
- —
- DSCR
- —
- Eligible?
- —
Short-term bridge; refi at stabilization.
Rent comps 5 comps
| Address | Beds | Baths | Sqft | Rent | $/sqft | DOM | Units | Dist |
|---|---|---|---|---|---|---|---|---|
| 14665 SW 22nd Pl Ocala, FL | 3.0 | 2.0 | 1226 | $1,900 | $1.55 | 15d | 1 | 0.40mi |
| 15388 SW 26th Pl Ocala, FL | 3.0 | 2.0 | 1218 | $1,800 | $1.48 | 15d | 1 | 0.40mi |
| 14445 SW 22nd Pl Ocala, FL | 3.0 | 2.0 | 1000 | $1,400 | $1.40 | 23d | 1 | 0.59mi |
| 14070 SW 17th Pl Ocala, FL | 3.0 | 2.0 | 1388 | $1,500 | $1.08 | 23d | 1 | 1.04mi |
| 15854 SW 38th Pl Ocala, FL | 3.0 | 2.0 | 1267 | $1,750 | $1.38 | 15d | 1 | 1.29mi |
Listing history 4 events
-
2026-05-04status Pending
-
2026-04-30status Active
-
2026-04-16status Pending
-
2026-04-10$209,900 Active
ⓘ Source: listings_history table (triggers on properties + properties_extension) + one-shot
backfill from property_details.listing_events for pre-trigger history.
Nearby sold comps map
Loading sold comps map…
Walkable amenities ~0.75 mi
Loading nearby amenities…
Taxation est. · year 1
- Rental income
- $22,020
- − Mortgage interest
- −$11,758
- − Property taxes
- −$3,148
- − Insurance
- −$1,050
- − Repairs & maintenance
- −$1,762
- − Management
- −$1,762
- − Depreciation
- −$6,106
- Taxable loss
- −$3,565
- Est. tax savings @ 24.0%
- +$856
- After-tax cash flow
- $844/yr
For passive investors: Depreciation is non-cash, so a rental often shows a tax loss while cash-flowing — sheltering income. Rental losses are passive: they offset passive income freely, and up to $25,000/yr can offset ordinary (W-2) income if you actively participate and your MAGI is under $100k (phasing out to $0 by $150k); unused losses carry forward. On sale, claimed depreciation is recaptured at up to 25%, and gains may owe capital-gains tax (a 1031 exchange can defer both). Figures are a year-1 estimate at your 24.0% rate — not tax advice; consult a CPA.
Condition & rehab AI · 1 photo
This brand new Stucco exterior frame home is move-in ready with excellent condition and no visible repairs or maintenance needed.
Value-add opportunities
- Both Landscaping — Enhances curb appeal and adds value
- Both Painting — Fresh paint can make the home look newer
- Both Landscaping and curb appeal — Improves the home's appearance and adds value
Renovation cost estimate screening
Value-add ROI direction
- Both Landscaping — Enhances curb appeal and adds value ↑
- Both Painting — Fresh paint can make the home look newer ↑
- Both Landscaping and curb appeal — Improves the home's appearance and adds value ↑
ⓘ Cost ranges are severity-bucket heuristics (US national rule-of-thumb). Get contractor quotes + a written scope before underwriting a rehab budget.
Schools (NCES district)
- District
- Marion
- NCES district ID
- 1201260
- Math proficiency
- 42% ▼ -7.00%
- Reading proficiency
- 43% ▼ -4.00%
- Median HH income
- $40,015
- Composite
- 35.61/100
- National rank
- #4890
- State rank
- #61 of 73 in FL
Livability — Rainbow Park
No livability data for this city. (Only ~50 U.S. cities are tracked.)
Census & demographics
- Census place
- Rainbow Park, FL
- County
- Marion County · 315,796 people
- Metro
- Ocala, FL
- Population (ZIP)
- 26,782
- Household income
- $57,324
- Rent vs Own
- Severe rent burden
- 313.0
Population outlook (Marion County) Hauer SSP2
- Today (2025)
- 365,905 people
- By 2030
- 376,768 · +3.0%
- By 2040
- 396,555 · +8.4%
- By 2050
- 412,723 · +12.8%
- By 2075
- 446,090 · +21.9%
- By 2100
- 436,193 · +19.2%
Race, ethnicity, and origin ACS 2023
- Neighborhood character
- Predominantly White (80%)
- Race & ethnicity
- White 80% Hispanic / Latino 11% Black 7% Two or more races 5%
- Hispanic origin (detail)
- Mexican 4% Puerto Rican 4% Cuban 1%
- Common ancestry
- Romanian 7% Lithuanian 3% Slovak 2%
- Foreign-born
- 8% · Canada, Jamaica
- Languages at home
- 88% English-only · Spanish 9% French/Haitian/Cajun 1% German/W. Germanic 1%
Political lean MEDSL · Marion
- 2024 margin
- Solid R (+31.6) · D 33.8% · R 65.5%
- 2008→2024 swing
- -20.0pp toward R · 2008: -11.6pp · 2024: -31.6pp
- All cycles
- 2024: R+31.6 2020: R+25.9 2016: R+26.2 2012: R+16.2 2008: R+11.6
Not yet ingested
- Civics
- —
Market trends
- HPI YoY
- ▼ -67.48%
- Current HPI
- 199.986
- Rent YoY
- —
- Metro
- Ocala, FL
- State GDP YoY
- ▲ 3.28%
- F500 in state
- 36
Industry mix (Fortune 500 HQ in FL)
| Industry | F500 HQs | Revenue |
|---|---|---|
| Industrial Technology | 2 | $29B |
|
||
| Insurance | 2 | $17B |
|
||
| Retail | 1 | $60B |
|
||
| Technology Distribution | 1 | $58B |
|
||
| Homebuilding | 1 | $35B |
|
||
| Technology Manufacturing | 1 | $35B |
|
||
Price history
4 events — show timeline
- 2026-05-04 Pending — Stellar MLS as Distributed by MLS Grid
- 2026-04-30 Relisted — Stellar MLS as Distributed by MLS Grid
- 2026-04-16 Pending — Stellar MLS as Distributed by MLS Grid
- 2026-04-10 Listed $209,900 Stellar MLS as Distributed by MLS Grid
Cash-flow waterfall
monthlySold comps — $/sqft
last 12 mo · ≤1 miLoading sold comps…