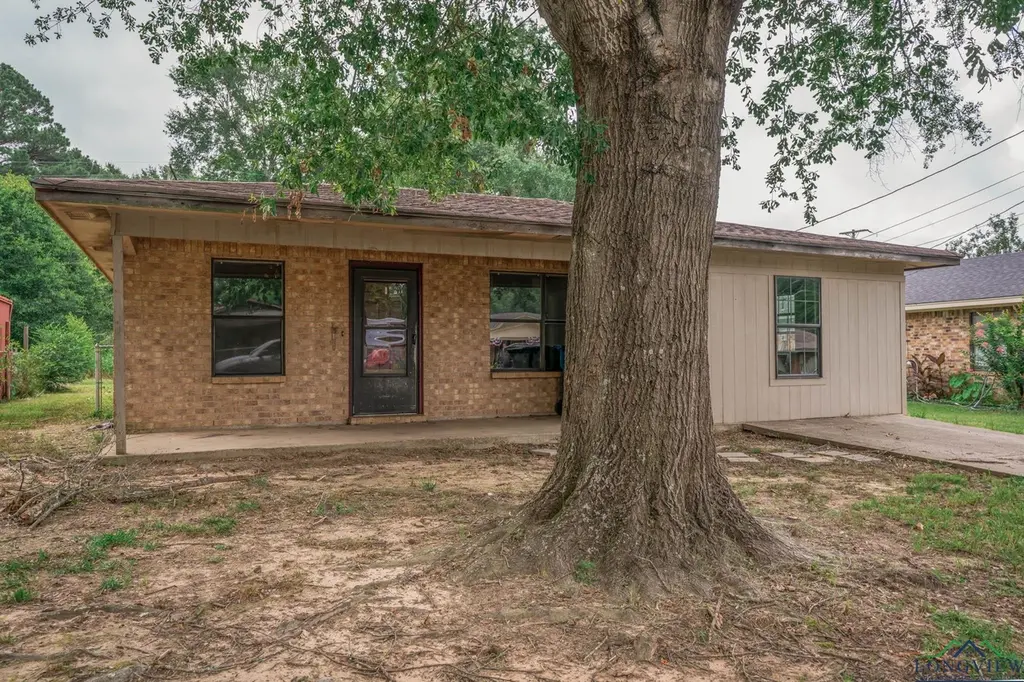
308 N Lee Dr · Gladewater, TX
Flood risk 1/10 · Minimal
- FEMA flood zone
- X (unshaded)
- Chance of flooding over 30 yrs
- 0.0%
- Est. flood insurance / yr
- $507 – $1,088
Fire risk 4/10 · Minor
- Est. fire insurance / yr
- $1,222 – $2,270
Heat risk 7/10 · Major
- Hot days now (above 110°F)
- 7 days/yr
- Hot days in 30 yrs
- 25 days/yr
Wind risk 6/10 · Moderate
- Chance of severe wind over 30 yrs
- 53.0%
Air-quality risk 2/10 · Minimal
- Unhealthy air days now
- 0 days/yr
- Unhealthy air days in 30 yrs
- 1 days/yr
Risk factors via First Street. Map © Google.
Why this score? — see what drove the B grade
The composite is a weighted blend of 9 inputs, each scored 0–100. Each bar is that input's sub-score; the figure is the points it added to the 100-point composite (weight × sub-score).
- Cash flow +30.0/30.0
- ARV discount +13.0/15.0
- DSCR +10.0/10.0
- 1% rule +9.4/10.0
- Livability +3.2/5.0
- Schools +2.7/10.0
- Rent growth +2.5/5.0
- Condition / age +2.5/5.0
- Appreciation +0.0/10.0
$135,000
🖨 Deal sheet 📄 Offer letter ✓ Due diligence
Listing remarks MLS
This 4-bedroom, 1-bath home offers a smart opportunity for first-time buyers or investors. Featuring vinyl plank flooring and a practical floor plan, this home is move-in ready with tons of potential. The fenced-in backyard is ideal for pets, kids, or weekend gatherings. With an affordable price tag and solid bones, it’s a great chance to build equity or add to your rental portfolio. Schedule your showing today!
Key facts
- Practical floor plan
- Fenced-in backyard
- Vinyl plank flooring
Tags
Neighborhood map
What this means for you Summary
Snapshot
- This is a 4-bed/1.0-bath single-family listed at $135k.
Deal economics
- At list price, monthly cash flow is $535 ($6k/yr) — positive.
- The deal already cash-flows at list — no discount required.
- Meets the 1% rule at list price ($2k rent vs $135k).
- Recommended offer: $119k (12.0% below list) — sets the bar for market timing.
- Cap rate 11.0% vs local median 5.0% in Gladewater — top-decile yield for the area; either an underpriced asset or a hidden risk that comps aren't pricing in. Stress-test before assuming the spread holds.
Location & tenants
- Location reads 64/100 on livability (#805 in TX) — a middle-class / working-renter tenant base. Strengths: cost of living A+, housing A; Watch: crime C-, schools D+, amenities F.
- Gladewater ISD (suburban): math 29% / reading 34% proficiency, ranked #594 of 826 in TX (top 72%) — families likely to look elsewhere, expect single-tenant / working-renter base with shorter leases; 63% free/reduced lunch — lower-income household profile, screen leases tightly.
- Market conditions: 178 active listings in the ZIP; 2 comparable units currently listed for rent nearby; 193 units permitted in Gregg County in 2024 (0 in 5+ unit buildings).
Forward outlook
- Local home prices are declining (-3.0%/yr); year-one equity from $933 of loan paydown is wiped out by about $4k of value loss. Plan a longer hold.
- At projected returns (-3.0% appreciation + 3.0% rent growth), your $38k cash investment doubles in ~8 years — after that, you're playing with house money.
Negotiation context
- It's been on market 363 days — a 12% lower offer ($119k) is reasonable based on typical stale-listing flexibility.
Risks & watch-outs
- Climate carrying-cost: major wind risk, 53% chance of damaging wind over 30y; extreme-heat days projected 7→25/yr by 2055 (HVAC capex compounding) — expect insurance premiums to compound above CPI over the hold.
Questions for the listing agent
- It's been on market 363 days. Have you received any prior offers? Is the seller open to a 12% concession, seller financing, or rate buy-down credit?
- Why hasn't it sold? Are there any deal-killer items the seller is aware of (foundation, flood, title, zoning, code violations)?
- Is there a deadline driving the sale (1031 exchange, divorce, estate, relocation)? That informs how much negotiation room exists.
- Schools are D-rated, which usually means shorter tenancies and higher turnover. Who's the typical renter profile here, and what's been the actual vacancy rate?
- What's the average days-on-market for RENTAL listings here right now (not sales)? A rising rental-DOM trend means longer vacancies and softer asking-rent achievability than the comps imply.
- What's the recent tenant-quality profile in this submarket — average credit score on applications, eviction rate, late-payment / NSF rate, and stable-employment percentage? A property-management company in the area should have these aggregated.
- How much new for-sale + rental construction is in the pipeline within 1–3 miles? Heavy new supply typically softens prices + rents 12–24 months out; constrained supply supports both.
Investment metrics
- 1% rule
- 1.44% ✓
- Cap rate
- 11.05%
- Cash-on-cash
- 16.98%
- DSCR
- 1.76
- GRM
- 5.8
CMA / ARV
- ARV (median comp)
- $153,770
- List price
- $135,000
- Delta
- -12.21%
- Verdict
- UNDERPRICED
- Comps
- 2 within 2.0 mi
Projected returns pro-forma
-3.0% appreciation · 3.0% rent growth · sell at horizon
- IRR
- 8.3%
- Equity multiple
- 1.32×
- Total profit
- $12,272
- Equity at exit
- $20,129
- IRR
- 17.5%
- Equity multiple
- 2.45×
- Total profit
- $54,862
- Equity at exit
- $11,672
Cash invested: $37,800 (down + closing). Projections, not guarantees.
Landlord ↔ Tenant lean methodology
- Overall (STATE)
- 87 Strongly Landlord-Friendly
- State Texas
- 87 Strongly Landlord-Friendly · R+5
- County
- — inherits STATE
- City
- — inherits STATE
ZIP-level market 75647
- Home prices YoY
- -8.2%
- Active inventory
- 178
- Price-to-rent
- 5.8×
Monthly cashflow live
- Estimated rent
- $1,950 medium interval (Pro) →
- Mortgage (P&I)
- −$708
- Tax from tax record
- −$241 /mo · $2,896/yr
- Insurance
- −$56
- HOA
- −$0
- Vacancy / Maint / Mgmt
- −$410
- Net cashflow
- $535
Break-even live
UW: 25.0% down · 7.5% · 30yr · 1.5% tax · 5.0% vac · 8.0% maint · 8.0% mgmt
Financing live
Cash to close
- Down payment
- $33,750
- Closing costs
- $4,050
- Reserves months
- —
- Total cash needed
- —
Loan-product check · same deal, 3 products live
Conventional
25% down · 7.5% · 30yr
- Down + closing
- —
- Monthly P&I
- —
- Monthly cashflow
- —
- DSCR
- —
- Eligible?
- —
Personal DTI + credit; lowest rate.
DSCR
20% down · 8.5% · 30yr
- Down + closing
- —
- Monthly P&I
- —
- Monthly cashflow
- —
- DSCR
- —
- Eligible?
- —
No personal income docs; deal must DSCR.
Hard money
10% down · 12.0% · 12mo
- Down + closing
- —
- Monthly P&I
- —
- Monthly cashflow
- —
- DSCR
- —
- Eligible?
- —
Short-term bridge; refi at stabilization.
Rent comps 2 comps
| Address | Beds | Baths | Sqft | Rent | $/sqft | DOM | Units | Dist |
|---|---|---|---|---|---|---|---|---|
| 109 Lyle St Gladewater, TX | 3.0 | 2.0 | 1385 | $1,950 | $1.41 | 13d | 1 | 1.06mi |
| 502 Jeanette Ave Gladewater, TX | 3.0 | 2.0 | 1385 | $1,950 | $1.41 | 13d | 1 | 1.13mi |
Listing history 20 events
-
2026-06-19days on market $135,000 Active 363 DOM
-
2026-06-18days on market $135,000 Active 362 DOM
-
2026-06-17days on market $135,000 Active 361 DOM
-
2026-06-16days on market $135,000 Active 360 DOM
-
2026-06-15days on market $135,000 Active 359 DOM
-
2026-06-14days on market $135,000 Active 357 DOM
-
2026-06-13days on market $135,000 Active 356 DOM
-
2026-06-10days on market $135,000 Active 354 DOM
-
2026-06-09days on market $135,000 Active 353 DOM
-
2026-06-08days on market $135,000 Active 352 DOM
-
2026-06-07days on market $135,000 Active 351 DOM
-
2026-06-03days on market $135,000 Active 347 DOM
-
2026-06-02days on market $135,000 Active 346 DOM
-
2026-06-01days on market $135,000 Active 345 DOM
-
2026-05-31days on market $135,000 Active 344 DOM
-
2026-05-30days on market $135,000 Active 343 DOM
-
2025-06-21$135,000 Active 421-char remark
Show marketing remark (421 chars)
This 4-bedroom, 1-bath home offers a smart opportunity for first-time buyers or investors. Featuring vinyl plank flooring and a practical floor plan, this home is move-in ready with tons of potential. The fenced-in backyard is ideal for pets, kids, or weekend gatherings. With an affordable price tag and solid bones, it’s a great chance to build equity or add to your rental portfolio. Schedule your showing today!
-
2020-07-13soldstatus
-
2013-10-10soldstatus
-
2004-08-05soldstatus
ⓘ Source: listings_history table (triggers on properties + properties_extension) + one-shot
backfill from property_details.listing_events for pre-trigger history.
Tax reassessment forecast TX · Resets to sale price
- Current annual tax
- $2,896 · $241/mo
- Projected year-2 tax
- $2,896 · $241/mo
- Expected delta
- $0/yr ($0/mo · 0.0%)
ⓘ Screening estimate from a state-policy table — verify with the county assessor before closing.
Climate risk First Street
- Flood 1/10 Low FEMA zone X (unshaded) · 0% chance over 30 yrs
- Wildfire 4/10 Moderate
- Heat 7/10 Severe 7 d/yr ≥110°F today · 25 d/yr by 30 yrs out
- Wind 6/10 Major 53% chance of damaging wind over 30 yrs
- Air quality 2/10 Low 0 unhealthy d/yr today · 1 by 30 yrs out
Nearby sold comps map
Loading sold comps map…
Walkable amenities ~0.75 mi
Loading nearby amenities…
Taxation est. · year 1
- Rental income
- $23,400
- − Mortgage interest
- −$7,562
- − Property taxes
- −$2,896
- − Insurance
- −$675
- − Repairs & maintenance
- −$1,872
- − Management
- −$1,872
- − Depreciation
- −$3,927
- Taxable income
- $4,596
- Est. tax owed @ 24.0%
- −$1,103
- After-tax cash flow
- $5,317/yr
For passive investors: Depreciation is non-cash, so a rental often shows a tax loss while cash-flowing — sheltering income. Rental losses are passive: they offset passive income freely, and up to $25,000/yr can offset ordinary (W-2) income if you actively participate and your MAGI is under $100k (phasing out to $0 by $150k); unused losses carry forward. On sale, claimed depreciation is recaptured at up to 25%, and gains may owe capital-gains tax (a 1031 exchange can defer both). Figures are a year-1 estimate at your 24.0% rate — not tax advice; consult a CPA.
Schools (NCES district)
- District
- Gladewater ISD
- NCES district ID
- 4820760
- Math proficiency
- 29% ▼ -12.00%
- Reading proficiency
- 34% ▼ -1.00%
- Median HH income
- $41,485
- Composite
- 26.62/100
- National rank
- #7177
- State rank
- #594 of 826 in TX
Livability — Gladewater
- Score
- 64/100
- State rank
- #805
- US rank
- #14670
Category grades
Schools grade is shown separately in the Schools card above.
Census & demographics
- Census place
- Gladewater, TX
- Population (ZIP)
- 13,457
Population outlook (Gregg County) Hauer SSP2
- Today (2025)
- 125,947 people
- By 2030
- 126,542 · +0.5%
- By 2040
- 127,311 · +1.1%
- By 2050
- 127,289 · +1.1%
- By 2075
- 124,954 · -0.8%
- By 2100
- 113,737 · -9.7%
Race, ethnicity, and origin ACS 2023
- Neighborhood character
- Predominantly White (73%)
- Race & ethnicity
- White 73% Black 12% Hispanic / Latino 9% Two or more races 8%
- Hispanic origin (detail)
- Mexican 8%
- Common ancestry
- Serbian 3% Slovak 2% Italian 2%
- Foreign-born
- 3% · Canada
- Languages at home
- 96% English-only · Spanish 4%
Political lean MEDSL · Gregg
- 2024 margin
- Solid R (+42.2) · D 28.5% · R 70.7%
- 2008→2024 swing
- -4.6pp toward R · 2008: -37.6pp · 2024: -42.2pp
- All cycles
- 2024: R+42.2 2020: R+36.9 2016: R+41.3 2012: R+39.5 2008: R+37.6
Not yet ingested
- Civics
- —
Market trends
- HPI YoY
- ▼ -27.12%
- Current HPI
- 303.1316
- Rent YoY
- —
- Metro
- —
- State GDP YoY
- ▲ 3.95%
- F500 in state
- 110
Industry mix (Fortune 500 HQ in TX)
| Industry | F500 HQs | Revenue |
|---|---|---|
| Energy | 16 | $1,198B |
|
||
| Technology | 5 | $198B |
|
||
| Engineering / Construction | 4 | $72B |
|
||
| Energy Services | 3 | $60B |
|
||
| Utilities | 3 | $41B |
|
||
| Healthcare | 2 | $330B |
|
||
Price history
4 events — show timeline
- 2025-06-21 Listed $135,000 LAAR
- 2020-07-13 Sold (Public Records) — Public Records
- 2013-10-10 Sold (Public Records) — Public Records
- 2004-08-05 Sold (Public Records) — Public Records
Property tax history
+4.4%/yrLatest (2025): $2,896 · +4.1% YoY. Source: county tax records.
Cash-flow waterfall
monthlySold comps — $/sqft
last 12 mo · ≤1 miLoading sold comps…