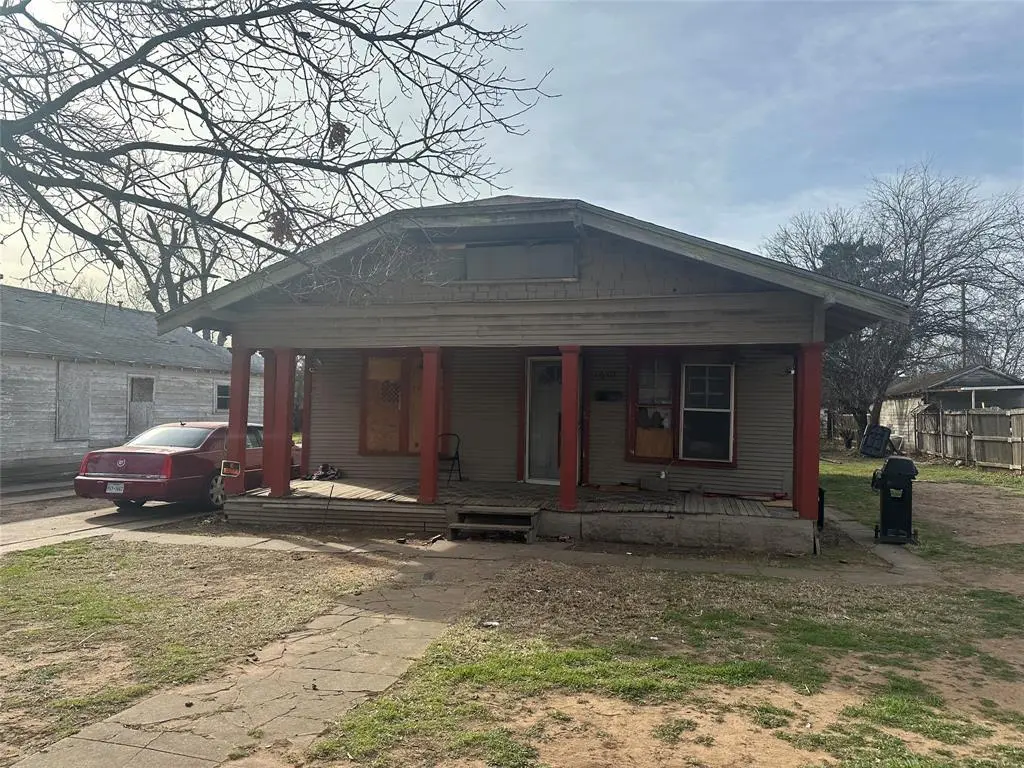
1607 Elizabeth Ave · Wichita Falls, TX
Flood risk 1/10 · Minimal
- FEMA flood zone
- X (unshaded)
- Chance of flooding over 30 yrs
- 0.0%
- Est. flood insurance / yr
- $507 – $1,088
Fire risk 2/10 · Minimal
- Est. fire insurance / yr
- $1,222 – $2,270
Heat risk 7/10 · Major
- Hot days now (above 109°F)
- 7 days/yr
- Hot days in 30 yrs
- 20 days/yr
Wind risk 4/10 · Minor
- Chance of severe wind over 30 yrs
- 8.0%
Air-quality risk 1/10 · Minimal
- Unhealthy air days now
- 0 days/yr
- Unhealthy air days in 30 yrs
- 0 days/yr
Risk factors via First Street. Map © Google.
Why this score? — see what drove the B- grade
The composite is a weighted blend of 9 inputs, each scored 0–100. Each bar is that input's sub-score; the figure is the points it added to the 100-point composite (weight × sub-score).
- Cash flow +30.0/30.0
- 1% rule +10.0/10.0
- DSCR +10.0/10.0
- ARV discount +7.5/15.0
- Rent growth +3.8/5.0
- Livability +3.5/5.0
- Schools +2.7/10.0
- Condition / age +2.5/5.0
- Appreciation +0.0/10.0
$25,000
🖨 Deal sheet (PDF) 📄 Offer letter ✓ Due diligence
Listing remarks
Affordable opportunity with flexible terms available. Cash buyers welcome and owner carries first available for qualified buyers. 3-bedroom home with strong potential for renovation, rental income, resale, or long-term investment. Property is being sold AS-IS and is priced accordingly. Large covered front porch and corner-lot appeal provide a solid foundation for an investor or handyman looking for their next project. Seller will consider cash offers and owner-carry proposals. All owner-carry transactions will be processed through a licensed RMLO in compliance with applicable regulations. Property acquired through tax foreclosure sale. Seller will provide available title and foreclosure doc
Key facts
- 9,017 sq ft lot
- Built 1922
- Listed 5 days
Property features AI
Finance
- Other: Special taxing entities: No; Possession negotiable (30–60 days, at closing/funding, or negotiable)
- Financial info: Listing terms include Cash, Contact Agent, Contract, FHA-203K, Owner Will Carry, Private Financing Available, Other
- HOA & community: No association
Exterior
- Parking: Driveway parking; On-street parking; Open parking (no covered or carport spaces)
- Security: Security features listed as unknown/other
- Utilities: City water; City sewer; Electricity available; Cable available; Asphalt access; Overhead utilities
- Home design: Single-family residence; Residential property; One story; Not attached to another property
- Construction: Built in 1922 (preowned); Frame/siding/wood construction; Pillar/post/pier foundation; Composition/shingle roof
- Exterior features: Less than 0.5-acre lot; Lot in Southland subdivision; Directions: From Old Iowa Park Rd, turn onto Elizabeth Ave. Property is on the right.
Interior
- Kitchen: Kitchen on main level (approx. 10 x 9); Appliances: Other/none listed
- Bedrooms: 3 bedrooms — all on the main level; Primary bedroom on main level (approx. 12 x 11); Second bedroom on main level (approx. 11 x 10); Third bedroom on main level (approx. 10 x 10)
- Flooring: Combination of flooring types; Wood flooring; Other/none listed
- Bathrooms: 1 full bathroom (main level, approx. 8 x 5)
- Heating & cooling: No heating listed; No cooling listed
- Interior features: Paneling; Other interior features; 7 total rooms; One-level layout; 1 living area; 1 dining area
- Laundry & utility: No specific laundry appliances listed
Neighborhood map
What this means for you Summary
Snapshot
- This is a 2-bed/1.0-bath single-family listed at $25k.
Deal economics
- At list price, monthly cash flow is $594 ($7k/yr) — positive.
- The deal already cash-flows at list — no discount required.
- Meets the 1% rule at list price ($969 rent vs $25k).
- Cap rate 34.8% vs local median 4.7% in Wichita Falls — top-decile yield for the area; either an underpriced asset or a hidden risk that comps aren't pricing in. Stress-test before assuming the spread holds.
Location & tenants
- Location reads 69/100 on livability (#437 in TX) — a middle-class / working-renter tenant base. Strengths: cost of living A+, housing A+; Watch: health & safety C-, employment D+, crime D.
- Wichita Falls ISD (urban): math 31% / reading 33% proficiency, ranked #585 of 826 in TX (top 71%) — families likely to look elsewhere, expect single-tenant / working-renter base with shorter leases.
- Zoned schools: Scotland Park El (math 20% / reading 24%, grade F, #3,333 of 4,322 statewide, top 80%, 473 students, 92% FRL) — zoned schools average 92% FRL vs 54% district-wide (39 pts higher); higher-poverty schools than district average — tighter screening recommended.
- Market conditions: Rents rising fast (+5.3%/yr); 133 active listings in the ZIP; 12 comparable units currently listed for rent nearby; rentals lingering (median 45d on market — plan ~5-8 weeks vacancy on turnover, expect pricing pressure); 100% of comp listings sitting > 30 days — soft ceiling on asking rent; lower-income renter base — watch delinquency; 231 units permitted in Wichita County in 2024 (10 in 5+ unit buildings).
Forward outlook
- Local home prices are declining (-3.0%/yr); year-one equity from $173 of loan paydown is wiped out by about $750 of value loss. Plan a longer hold.
- Wichita County population projected to shrink 7% by 2050 — rents likely to lag national; underwrite the cash flow, not the appreciation.
- At projected returns (-3.0% appreciation + 5.3% rent growth), your $7k cash investment doubles in ~2 years — after that, you're playing with house money.
Negotiation context
- Only 6 days on market — expect competitive offers; lowballing is unlikely to land.
- 2 sale attempts with the ask held roughly flat each time — persistent listings suggest the price (not the market) is what's stuck; bring a comps-based counter.
Risks & watch-outs
- Watch-outs: built in 1922 — expect roof / HVAC / electrical / plumbing capex.
- Climate carrying-cost: extreme-heat days projected 7→20/yr by 2055 (HVAC capex compounding) — expect insurance premiums to compound above CPI over the hold.
Questions for the listing agent
- Built in 1922 — when were the roof, HVAC, electrical panel, plumbing, and water heater last replaced?
- Is there a deadline driving the sale (1031 exchange, divorce, estate, relocation)? That informs how much negotiation room exists.
- Schools are D-rated, which usually means shorter tenancies and higher turnover. Who's the typical renter profile here, and what's been the actual vacancy rate?
- Crime grade is D in this area — have there been break-ins, vandalism, or insurance claims at this property in the last 3 years? What carrier currently insures it and at what premium?
- What's the average days-on-market for RENTAL listings here right now (not sales)? A rising rental-DOM trend means longer vacancies and softer asking-rent achievability than the comps imply.
- What's the recent tenant-quality profile in this submarket — average credit score on applications, eviction rate, late-payment / NSF rate, and stable-employment percentage? A property-management company in the area should have these aggregated.
- How much new for-sale + rental construction is in the pipeline within 1–3 miles? Heavy new supply typically softens prices + rents 12–24 months out; constrained supply supports both.
Investment metrics
- 1% rule
- 3.88% ✓
- Cap rate
- 34.83%
- Cash-on-cash
- 101.91%
- DSCR
- 5.53
- GRM
- 2.2
CMA / ARV
- ARV (median comp)
- $72,177
- List price
- $25,000
- Delta
- -62.59%
- Verdict
- UNDERPRICED
- Comps
- 6 within 1.0 mi
Projected returns pro-forma
-3.0% appreciation · 5.27% rent growth · sell at horizon
- IRR
- —
- Equity multiple
- 6.16×
- Total profit
- $36,089
- Equity at exit
- $3,728
- IRR
- —
- Equity multiple
- 13.85×
- Total profit
- $89,963
- Equity at exit
- $2,162
Cash invested: $7,000 (down + closing). Projections, not guarantees.
Landlord ↔ Tenant lean methodology
- Overall (STATE)
- 87 Strongly Landlord-Friendly
- State Texas
- 87 Strongly Landlord-Friendly · R+5
- County
- — inherits STATE
- City
- — inherits STATE
ZIP-level market 76301
- Home prices YoY
- -34.1%
- Rents YoY
- 5.3%
- Active inventory
- 133
- Price-to-rent
- 2.2×
Monthly cashflow live
- Estimated rent
- $969 high interval (Pro) →
- Mortgage (P&I)
- −$131
- Tax from tax record
- −$29 /mo · $353/yr
- Insurance
- −$10
- HOA
- −$0
- Vacancy / Maint / Mgmt
- −$203
- Net cashflow
- $594
Break-even live
Sensitivity live
| Price | -10% $609 | -5% $602 | +0% $594 | +5% $587 | +10% $580 |
|---|---|---|---|---|---|
| Rent | -10% $518 | -5% $556 | +0% $594 | +5% $633 | +10% $671 |
| Rate | -1.0pp $607 | -0.5pp $601 | base $594 | +0.5pp $588 | +1.0pp $581 |
UW: 25.0% down · 7.5% · 30yr · 1.5% tax · 5.0% vac · 8.0% maint · 8.0% mgmt
Financing live
Cash to close
- Down payment
- $6,250
- Closing costs
- $750
- Reserves months
- —
- Total cash needed
- —
Loan-product check · same deal, 3 products live
Conventional
25% down · 7.5% · 30yr
- Down + closing
- —
- Monthly P&I
- —
- Monthly cashflow
- —
- DSCR
- —
- Eligible?
- —
Personal DTI + credit; lowest rate.
DSCR
20% down · 8.5% · 30yr
- Down + closing
- —
- Monthly P&I
- —
- Monthly cashflow
- —
- DSCR
- —
- Eligible?
- —
No personal income docs; deal must DSCR.
Hard money
10% down · 12.0% · 12mo
- Down + closing
- —
- Monthly P&I
- —
- Monthly cashflow
- —
- DSCR
- —
- Eligible?
- —
Short-term bridge; refi at stabilization.
Rent comps 12 comps
| Address | Beds | Baths | Sqft | Rent | $/sqft | DOM | Units | Dist |
|---|---|---|---|---|---|---|---|---|
| 1824 Collins Ave Wichita Falls, TX | 1.0 | 1.0 | 750 | $795 | $1.06 | 44d | 1 | 0.61mi |
| 1810 7th St Unit 1/2 Wichita Falls, TX | 2.0 | 1.0 | 806 | $775 | $0.96 | 44d | 1 | 0.75mi |
| 2007 10th St Unit B Wichita Falls, TX | 1.0 | 1.0 | 744 | $750 | $1.01 | 44d | 1 | 0.79mi |
| 2003 Wilson Ave Unit 1/2 Wichita Falls, TX | 1.0 | 1.0 | 680 | $650 | $0.96 | 44d | 1 | 0.80mi |
| 1301 Giddings St Wichita Falls, TX | 3.0 | 1.0 | 1000 | $1,150 | $1.15 | 44d | 1 | 0.91mi |
| 1901 Giddings St Wichita Falls, TX | 3.0 | 2.0 | 909 | $1,175 | $1.29 | 44d | 1 | 1.00mi |
| 2130 Avenue K Wichita Falls, TX | 3.0 | 2.0 | 1090 | $1,390 | $1.28 | 44d | 1 | 1.11mi |
| 2006 Bell St Wichita Falls, TX | 3.0 | 1.0 | 1120 | $1,000 | $0.89 | 44d | 1 | 1.14mi |
| 504 Fillmore St Wichita Falls, TX | 1.0–2.0 | 1.0 | 734 | $895 | $1.22 | 44d | 6 | 1.32mi |
| 1515 Fillmore St Wichita Falls, TX | 3.0 | 2.0 | 909 | $1,225 | $1.35 | 44d | 1 | 1.32mi |
| 1813 Polk St Wichita Falls, TX | 3.0 | 2.0 | 1090 | $1,364 | $1.25 | 44d | 1 | 1.36mi |
| 1710 Fillmore St Apt C Wichita Falls, TX | 1.0 | 1.0 | 648 | $625 | $0.96 | 44d | 1 | 1.43mi |
Listing history 21 events
-
2026-06-19days on market $25,000 Active 6 DOM
-
2026-06-18days on market $25,000 Active 5 DOM
-
2026-06-17days on market $25,000 Active 4 DOM
-
2026-06-16days on market $25,000 Active 3 DOM
-
2026-06-15days on market $25,000 Active 2 DOM
-
2026-06-14pricedays on market $25,000 Active 1 DOM
-
2026-06-10days on market $27,000 Active 181 DOM
-
2026-06-09days on market $27,000 Active 180 DOM
-
2026-06-08days on market $27,000 Active 179 DOM
-
2026-06-07remarks 699-char remark
-
2026-06-07days on market $27,000 Active 178 DOM
-
2026-06-05days on market $27,000 Active 175 DOM
-
2026-06-02days on market $27,000 Active 173 DOM
-
2026-06-01days on market $27,000 Active 172 DOM
-
2026-05-31days on market $27,000 Active 171 DOM
-
2026-05-30days on market $27,000 Active 170 DOM
-
2026-01-09price $27,000 822-char remark
-
2025-12-22price $29,000 822-char remark
-
2025-12-17price $35,000 822-char remark
-
2025-12-11$50,000 Active 822-char remark
-
2020-04-28soldstatus
ⓘ Source: listings_history table (triggers on properties + properties_extension) + one-shot
backfill from property_details.listing_events for pre-trigger history.
Tax reassessment forecast TX · Resets to sale price
- Current annual tax
- $353 · $29/mo
- Projected year-2 tax
- $458 · $38/mo
- Expected delta
- +$105/yr (+$9/mo · 29.8%)
ⓘ Screening estimate from a state-policy table — verify with the county assessor before closing.
Climate risk First Street
- Flood 1/10 Low FEMA zone X (unshaded) · 0% chance over 30 yrs
- Wildfire 2/10 Low
- Heat 7/10 Severe 7 d/yr ≥109°F today · 20 d/yr by 30 yrs out
- Wind 4/10 Moderate 8% chance of damaging wind over 30 yrs
- Air quality 1/10 Low 0 unhealthy d/yr today · 0 by 30 yrs out
Nearby sold comps map
Loading sold comps map…
Walkable amenities ~0.75 mi
Loading nearby amenities…
Taxation est. · year 1
- Rental income
- $11,626
- − Mortgage interest
- −$1,400
- − Property taxes
- −$353
- − Insurance
- −$125
- − Repairs & maintenance
- −$930
- − Management
- −$930
- − Depreciation
- −$727
- Taxable income
- $7,161
- Est. tax owed @ 24.0%
- −$1,719
- After-tax cash flow
- $5,415/yr
For passive investors: Depreciation is non-cash, so a rental often shows a tax loss while cash-flowing — sheltering income. Rental losses are passive: they offset passive income freely, and up to $25,000/yr can offset ordinary (W-2) income if you actively participate and your MAGI is under $100k (phasing out to $0 by $150k); unused losses carry forward. On sale, claimed depreciation is recaptured at up to 25%, and gains may owe capital-gains tax (a 1031 exchange can defer both). Figures are a year-1 estimate at your 24.0% rate — not tax advice; consult a CPA.
Schools (NCES district)
- District
- Wichita Falls ISD
- NCES district ID
- 4845780
- Math proficiency
- 31% ▼ -10.00%
- Reading proficiency
- 33% ▼ -7.00%
- Median HH income
- $41,604
- Composite
- 27.06/100
- National rank
- #7051
- State rank
- #585 of 826 in TX
Livability — Wichita Falls
- Score
- 69/100
- State rank
- #437
- US rank
- #8940
Category grades
Schools grade is shown separately in the Schools card above.
Census & demographics
- Census place
- Wichita Falls, TX
- County
- Wichita County · 95,694 people
- City population
- 95,694
- Metro
- Wichita Falls, TX
- Population (ZIP)
- 15,479
- Household income
- $41,947
- Rent vs Own
- Severe rent burden
- 577.0
Population outlook (Wichita County) Hauer SSP2
- Today (2025)
- 129,638 people
- By 2030
- 128,366 · -1.0%
- By 2040
- 124,466 · -4.0%
- By 2050
- 120,499 · -7.0%
- By 2075
- 113,884 · -12.2%
- By 2100
- 101,818 · -21.5%
Race, ethnicity, and origin ACS 2023
- Neighborhood character
- Diverse neighborhood (Simpson 0.67)
- Race & ethnicity
- White 40% Hispanic / Latino 38% Black 18% Two or more races 15% Asian 1%
- Hispanic origin (detail)
- Mexican 36%
- Common ancestry
- Slovak 3% Lithuanian 2% Italian 1%
- Foreign-born
- 11% · Canada, Vietnam
- Languages at home
- 76% English-only · Spanish 22%
Political lean MEDSL · Wichita
- 2024 margin
- Solid R (+44.0) · D 27.5% · R 71.5%
- 2008→2024 swing
- -5.2pp toward R · 2008: -38.9pp · 2024: -44.0pp
- All cycles
- 2024: R+44.0 2020: R+41.1 2016: R+49.7 2012: R+47.1 2008: R+38.9
Not yet ingested
- Civics
- —
Market trends
- HPI YoY
- ▼ -69.89%
- Current HPI
- 135.1511
- Rent YoY
- ▲ 5.27%
- Metro
- Wichita Falls, TX
- State GDP YoY
- ▲ 3.95%
- F500 in state
- 110
Industry mix (Fortune 500 HQ in TX)
| Industry | F500 HQs | Revenue |
|---|---|---|
| Energy | 16 | $1,198B |
|
||
| Technology | 5 | $198B |
|
||
| Engineering / Construction | 4 | $72B |
|
||
| Energy Services | 3 | $60B |
|
||
| Utilities | 3 | $41B |
|
||
| Healthcare | 2 | $330B |
|
||
Price history
-50.0% since first listed7 events — show timeline
- 2026-06-13 Listed $25,000 NTREIS
- 2026-06-11 Listing Removed — NTREIS
- 2026-01-09 Price Changed $27,000 NTREIS
- 2025-12-22 Price Changed $29,000 NTREIS
- 2025-12-17 Price Changed $35,000 NTREIS
- 2025-12-11 Listed $50,000 NTREIS
- 2020-04-28 Sold (Public Records) — Public Records
Property tax history
-3.3%/yrLatest (2025): $353 · -12.7% YoY. Source: county tax records.
Cash-flow waterfall
monthlySold comps — $/sqft
last 12 mo · ≤1 miLoading sold comps…