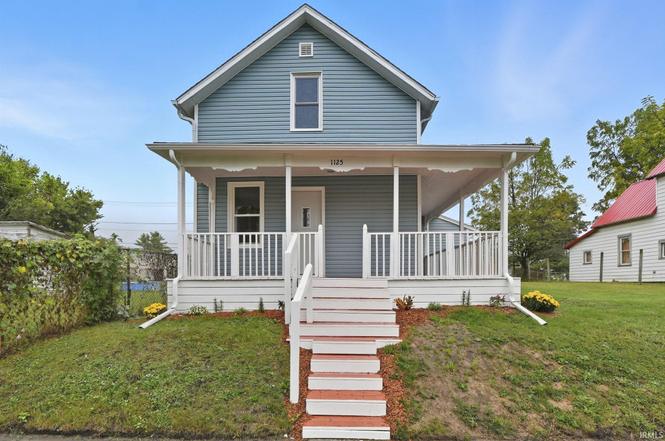
1125 E Washington St · Muncie, IN
Flood risk 3/10 · Minor
- FEMA flood zone
- X (unshaded)
- Chance of flooding over 30 yrs
- 0.16%
- Est. flood insurance / yr
- $473 – $860
Fire risk 1/10 · Minimal
- Est. fire insurance / yr
- $717 – $1,331
Heat risk 3/10 · Minor
- Hot days now (above 100°F)
- 7 days/yr
- Hot days in 30 yrs
- 18 days/yr
Wind risk 2/10 · Minimal
- Chance of severe wind over 30 yrs
- 0.0%
Air-quality risk 3/10 · Minor
- Unhealthy air days now
- 2 days/yr
- Unhealthy air days in 30 yrs
- 3 days/yr
Risk factors via First Street. Map © Google.
Why this score? — see what drove the D grade
The composite is a weighted blend of 9 inputs, each scored 0–100. Each bar is that input's sub-score; the figure is the points it added to the 100-point composite (weight × sub-score).
- Cash flow +11.0/30.0
- Appreciation +7.6/10.0
- ARV discount +7.5/15.0
- Livability +4.0/5.0
- Rent growth +3.3/5.0
- DSCR +3.2/10.0
- Condition / age +2.5/5.0
- 1% rule +2.4/10.0
- Schools +1.7/10.0
$149,900
🖨 Deal sheet (PDF) 📄 Offer letter ✓ Due diligence
Listing remarks
Welcome to 1125 E Washington Street — a beautifully refreshed two-story home that blends timeless character with modern comfort. Offering 3 spacious bedrooms, 2 full baths, and approximately 1,800 square feet of living space, this property delivers room to grow at an affordable price point. Built in 1900 and thoughtfully updated, the home features a charming covered front porch perfect for relaxing evenings, a fresh exterior with inviting curb appeal, and a layout designed for both everyday living and entertaining. Inside, you’ll find generous room sizes, natural light throughout, and functional flow that makes the space feel even larger. Conveniently located in Muncie, close to
Key facts
- Eat-in kitchen
- Off-street parking
- Remodeled residence
Tags
Property features AI
Exterior
- Parking: Off-street parking
- Security: Smoke detectors
- Utilities: Public water; Public sewer
- Home design: Single-family site-built home; One story
- Construction: Vinyl siding; Asphalt roof; Crawl space foundation; Built in 1,800 above-grade finished area
- Exterior features: Covered porch; Porch; Level lot; Shed
Interior
- Kitchen: Dishwasher; Microwave; Refrigerator; Exhaust fan; Electric oven; Electric range
- Flooring: Carpet; Vinyl
- Bathrooms: Two full bathrooms (both on the main level)
- Heating & cooling: Forced-air heating (natural gas); Ceiling fans for cooling
- Interior features: Vaulted ceilings; Walk-in closets; Ceiling fans; Kitchen island; Built-in features; One fireplace
- Laundry & utility: Washer hookup on main level; Electric dryer hookup on main level; Electric water heater
Neighborhood map
What this means for you Summary
Snapshot
- This is a 3-bed/1.0-bath single-family listed at $150k.
Deal economics
- At list price, monthly cash flow is $-62 ($-747/yr) — negative.
- To cash-flow at today's rent, offer at most $139k (7.3% below list).
- To meet the 1% rule (rent ≥ 1% of price), the offer needs to be $112k (25.6% below list).
- Recommended offer: $112k (25.6% below list) — sets the bar for 1% rule.
Location & tenants
- Location reads 80/100 on livability (#18 in IN, #1,654 nationally) — a professional / high-income tenant draw. Strengths: amenities A+, commute A+, cost of living A+; Watch: crime F, employment F.
- Muncie Community Schools (urban): math 18% / reading 25% proficiency, ranked #275 of 301 in IN (top 91%) — low school quality limits family demand, transient renter base, plan for 1-2y turnover; 68% free/reduced lunch — lower-income household profile, screen leases tightly.
- Zoned schools: East Washington Academy (math 41% / reading 42%, grade F, #478 of 994 statewide, top 49%, 468 students, 70% FRL); Northside Middle School (math 17% / reading 36%, grade F, #236 of 330 statewide, top 72%, 583 students, 70% FRL); Muncie Central High School (math 20% / reading 39%, 1,326 students, 70% FRL) — zoned schools at 70% FRL track the district average.
- Market conditions: Rents rising (+3.3%/yr); 27 active listings in the ZIP; 8 comparable units currently listed for rent nearby; rentals lingering (median 46d on market — plan ~5-8 weeks vacancy on turnover, expect pricing pressure); 100% of comp listings sitting > 30 days — soft ceiling on asking rent; lower-income renter base — watch delinquency; 171 units permitted in Delaware County in 2024 (57 in 5+ unit buildings).
- This rent runs 37% of the median local income ($36k/yr) — at the standard rent-burdened threshold; future hikes will face affordability resistance.
Forward outlook
- In year one you build about $9k of equity ($1k loan paydown + $8k appreciation (5.3% local appreciation)).
- Delaware County population projected at -11% by 2050 — secular population decline; favor cash flow + early exit over multi-decade hold.
- At projected returns (5.3% appreciation + 3.3% rent growth), your $42k cash investment doubles in ~5 years — after that, you're playing with house money.
- By year 4, paydown + projected appreciation supports a ~$30k cash-out refi (75% LTV) — recoverable capital for the next deal without selling this one.
Negotiation context
- It's been on market 241 days — a 12% lower offer ($132k) is reasonable based on typical stale-listing flexibility.
- 4 sale attempts since 2y ago; this cycle's ask has dropped $10k (6%) from the opening price — seller is motivated, your offer sets the floor, not the list.
- Current owner paid $29k; list at $150k implies a 417% gain — meaningful room to come down on a strong offer.
Risks & watch-outs
- Watch-outs: built in 1900 — expect roof / HVAC / electrical / plumbing capex.
Questions for the listing agent
- What do current leases actually rent for vs. the listed asking? Can we see a recent rent roll and the last 12 months of T-12 income?
- It's been on market 241 days. Have you received any prior offers? Is the seller open to a 26% concession, seller financing, or rate buy-down credit?
- Built in 1900 — when were the roof, HVAC, electrical panel, plumbing, and water heater last replaced?
- Why hasn't it sold? Are there any deal-killer items the seller is aware of (foundation, flood, title, zoning, code violations)?
- Is there a deadline driving the sale (1031 exchange, divorce, estate, relocation)? That informs how much negotiation room exists.
- Schools are D-rated, which usually means shorter tenancies and higher turnover. Who's the typical renter profile here, and what's been the actual vacancy rate?
- Crime grade is F in this area — have there been break-ins, vandalism, or insurance claims at this property in the last 3 years? What carrier currently insures it and at what premium?
- The area grade is low — what's the realistic commute time and amenity access for the typical tenant pool here? Any planned neighborhood developments (good or bad) we should know about?
- What's the average days-on-market for RENTAL listings here right now (not sales)? A rising rental-DOM trend means longer vacancies and softer asking-rent achievability than the comps imply.
- What's the recent tenant-quality profile in this submarket — average credit score on applications, eviction rate, late-payment / NSF rate, and stable-employment percentage? A property-management company in the area should have these aggregated.
- How much new for-sale + rental construction is in the pipeline within 1–3 miles? Heavy new supply typically softens prices + rents 12–24 months out; constrained supply supports both.
Investment metrics
- 1% rule
- 0.74% ✗
- Cap rate
- 5.79%
- Cash-on-cash
- -1.78%
- DSCR
- 0.92
- GRM
- 11.2
CMA / ARV
- ARV (on-the-fly)
- $90,000
- Comps found
- 12
Show comp detail 12 sales within ~0.75 mi
| Address | Dist | Beds/Ba | Sqft | Sold | Price | $/sf | Match |
|---|---|---|---|---|---|---|---|
| 1025 E Washington St | 0.06mi | 3/2.0 | 1,694 (-6%) | 4mo | $147,500 | $87 | 80 |
| 1319 E Jackson St | 0.18mi | 4/1.0 (+1) | 1,735 (-4%) | 2mo | $16,000 | $9 | 78 |
| 803 S Pershing Dr | 0.52mi | 3/1.0 | 1,800 (0%) | 10mo | $90,000 | $50 | 68 |
| 324 S Beacon St | 0.22mi | 4/2.0 (+1) | 1,848 (+3%) | 11mo | $21,150 | $11 | 67 |
| 229 N Hackley St | 0.20mi | 3/2.5 | 1,822 (+1%) | 20mo | $165,500 | $91 | 66 |
| 600 S Vine St | 0.45mi | 3/2.0 | 1,760 (-2%) | 12mo | $140,000 | $80 | 61 |
| 405 N Pershing Dr | 0.28mi | 4/1.5 (+1) | 1,600 (-11%) | 8mo | $104,000 | $65 | 55 |
| 907 E Main St | 0.17mi | 3/1.5 | 1,992 (+11%) | 21mo | $40,000 | $20 | 55 |
| 801 E Charles St | 0.32mi | 3/1.5 | 1,541 (-14%) | 8mo | $27,500 | $18 | 52 |
| 1405 E Washington St | 0.20mi | 4/2.0 (+1) | 1,958 (+9%) | 20mo | $87,500 | $45 | 51 |
| 710 E 6th St | 0.74mi | 3/2.0 | 1,700 (-6%) | 14mo | $124,000 | $73 | 41 |
| 807 N Elm St | 0.69mi | 4/1.0 (+1) | 2,064 (+15%) | 8mo | $50,000 | $24 | 32 |
Match score weights: distance 35% · size 25% · config 20% · recency 20%. Top-matched comps best support the ARV.
Projected returns pro-forma
5.27% appreciation · 3.27% rent growth · sell at horizon
- IRR
- 12.2%
- Equity multiple
- 1.79×
- Total profit
- $33,207
- Equity at exit
- $87,457
- IRR
- 13.2%
- Equity multiple
- 3.46×
- Total profit
- $103,298
- Equity at exit
- $153,056
Cash invested: $41,972 (down + closing). Projections, not guarantees.
Landlord ↔ Tenant lean methodology
- Overall (STATE)
- 90 Strongly Landlord-Friendly
- State Indiana
- 90 Strongly Landlord-Friendly · R+11
- County
- — inherits STATE
- City
- — inherits STATE
ZIP-level market 47305
- Home prices YoY
- 2.0%
- Rents YoY
- 3.3%
- Active inventory
- 27
- Price-to-rent
- 11.2×
Monthly cashflow live
- Estimated rent
- $1,115 high interval (Pro) →
- Mortgage (P&I)
- −$786
- Tax from tax record
- −$95 /mo · $1,136/yr
- Insurance
- −$62
- HOA
- −$0
- Vacancy / Maint / Mgmt
- −$234
- Net cashflow
- $-62
Break-even live
Sensitivity live
| Price | -10% $23 | -5% $-20 | +0% $-62 | +5% $-105 | +10% $-147 |
|---|---|---|---|---|---|
| Rent | -10% $-150 | -5% $-106 | +0% $-62 | +5% $-18 | +10% $26 |
| Rate | -1.0pp $13 | -0.5pp $-24 | base $-62 | +0.5pp $-101 | +1.0pp $-141 |
UW: 25.0% down · 7.5% · 30yr · 1.5% tax · 5.0% vac · 8.0% maint · 8.0% mgmt
Financing live
Cash to close
- Down payment
- $37,475
- Closing costs
- $4,497
- Reserves months
- —
- Total cash needed
- —
Loan-product check · same deal, 3 products live
Conventional
25% down · 7.5% · 30yr
- Down + closing
- —
- Monthly P&I
- —
- Monthly cashflow
- —
- DSCR
- —
- Eligible?
- —
Personal DTI + credit; lowest rate.
DSCR
20% down · 8.5% · 30yr
- Down + closing
- —
- Monthly P&I
- —
- Monthly cashflow
- —
- DSCR
- —
- Eligible?
- —
No personal income docs; deal must DSCR.
Hard money
10% down · 12.0% · 12mo
- Down + closing
- —
- Monthly P&I
- —
- Monthly cashflow
- —
- DSCR
- —
- Eligible?
- —
Short-term bridge; refi at stabilization.
Rent comps 8 comps
| Address | Beds | Baths | Sqft | Rent | $/sqft | DOM | Units | Dist |
|---|---|---|---|---|---|---|---|---|
| 1521 E Kirby Ave Muncie, IN | 2.0–4.0 | 1.0–2.0 | 972 | $1,150 | $1.18 | 45d | 2 | 0.45mi |
| 412 W Howard St Muncie, IN | 3.0 | 1.0 | 1300 | $1,000 | $0.77 | 45d | 1 | 0.91mi |
| 808 W Beechwood Ave Muncie, IN | 4.0 | 2.0 | 1261 | $900 | $0.71 | 45d | 1 | 1.17mi |
| 609 N Waldemere Ave Muncie, IN | 4.0 | 1.0 | 1664 | $1,300 | $0.78 | 45d | 1 | 1.30mi |
| 623 W 9th St Muncie, IN | 3.0 | 1.0 | 1574 | $1,499 | $0.95 | 45d | 1 | 1.35mi |
| 605 W 10th St Muncie, IN | 3.0 | 1.0 | 1688 | $1,150 | $0.68 | 45d | 1 | 1.37mi |
| 816 N New York Ave Muncie, IN | 3.0–4.0 | 1.0 | 1200 | $1,000 | $0.83 | 45d | 10 | 1.47mi |
| 711 W Centennial Ave Muncie, IN | 3.0 | 2.0 | 1372 | $1,200 | $0.87 | 45d | 1 | 1.48mi |
Listing history 29 events
-
2026-06-22days on market $149,900 Active 241 DOM
-
2026-06-19days on market $149,900 Active 239 DOM
-
2026-06-18days on market $149,900 Active 238 DOM
-
2026-06-17days on market $149,900 Active 237 DOM
-
2026-06-16days on market $149,900 Active 236 DOM
-
2026-06-15days on market $149,900 Active 235 DOM
-
2026-06-14days on market $149,900 Active 233 DOM
-
2026-06-13days on market $149,900 Active 232 DOM
-
2026-06-10days on market $149,900 Active 230 DOM
-
2026-06-09days on market $149,900 Active 229 DOM
-
2026-06-08days on market $149,900 Active 228 DOM
-
2026-06-07days on market $149,900 Active 227 DOM
-
2026-06-05days on market $149,900 Active 224 DOM
-
2026-06-03days on market $149,900 Active 223 DOM
-
2026-06-02days on market $149,900 Active 222 DOM
-
2026-06-01days on market $149,900 Active 221 DOM
-
2026-05-31days on market $149,900 Active 220 DOM
-
2026-05-30days on market $149,900 Active 219 DOM
-
2026-05-22status Active
-
2026-04-27status Pending
-
2026-03-04status Active
-
2026-02-27historical Active Under Contract
-
2026-02-26price $149,900
-
2025-09-27$159,900 Active
-
2025-04-02soldstatus $29,000 Closed
-
2025-03-31status Pending
-
2025-02-10price $35,000
-
2025-01-14price $38,000
-
2024-12-07$43,000 Active
ⓘ Source: listings_history table (triggers on properties + properties_extension) + one-shot
backfill from property_details.listing_events for pre-trigger history.
Tax reassessment forecast IN · Partial reset (capped growth)
- Current annual tax
- $1,136 · $95/mo
- Projected year-2 tax
- $1,205 · $100/mo
- Expected delta
- +$69/yr (+$6/mo · 6.1%)
ⓘ Screening estimate from a state-policy table — verify with the county assessor before closing.
Climate risk First Street
- Flood 3/10 Moderate FEMA zone X (unshaded) · 16% chance over 30 yrs
- Wildfire 1/10 Low
- Heat 3/10 Moderate 7 d/yr ≥100°F today · 18 d/yr by 30 yrs out
- Wind 2/10 Low 0% chance of damaging wind over 30 yrs
- Air quality 3/10 Moderate 2 unhealthy d/yr today · 3 by 30 yrs out
Nearby sold comps map
Loading sold comps map…
Walkable amenities ~0.75 mi
Loading nearby amenities…
Taxation est. · year 1
- Rental income
- $13,382
- − Mortgage interest
- −$8,397
- − Property taxes
- −$1,136
- − Insurance
- −$750
- − Repairs & maintenance
- −$1,071
- − Management
- −$1,071
- − Depreciation
- −$4,361
- Taxable loss
- −$3,402
- Est. tax savings @ 24.0%
- +$817
- After-tax cash flow
- $69/yr
For passive investors: Depreciation is non-cash, so a rental often shows a tax loss while cash-flowing — sheltering income. Rental losses are passive: they offset passive income freely, and up to $25,000/yr can offset ordinary (W-2) income if you actively participate and your MAGI is under $100k (phasing out to $0 by $150k); unused losses carry forward. On sale, claimed depreciation is recaptured at up to 25%, and gains may owe capital-gains tax (a 1031 exchange can defer both). Figures are a year-1 estimate at your 24.0% rate — not tax advice; consult a CPA.
Schools (NCES district)
- District
- Muncie Community Schools
- NCES district ID
- 1807320
- Math proficiency
- 18% ▼ -9.00%
- Reading proficiency
- 25% ▼ -4.00%
- Median HH income
- $30,052
- Composite
- 17.22/100
- National rank
- #9099
- State rank
- #275 of 301 in IN
Livability — Muncie
- Score
- 80/100
- State rank
- #18
- US rank
- #1654
Category grades
Schools grade is shown separately in the Schools card above.
Census & demographics
- Census place
- Muncie, IN
- County
- Delaware County · 84,658 people
- City population
- 84,658
- Metro
- Muncie, IN
- Population (ZIP)
- 3,556
- Household income
- $36,389
- Rent vs Own
- Severe rent burden
- 336.0
Population outlook (Delaware County) Hauer SSP2
- Today (2025)
- 113,036 people
- By 2030
- 111,313 · -1.5%
- By 2040
- 106,432 · -5.8%
- By 2050
- 100,747 · -10.9%
- By 2075
- 91,000 · -19.5%
- By 2100
- 80,687 · -28.6%
Race, ethnicity, and origin ACS 2023
- Neighborhood character
- Diverse neighborhood (Simpson 0.60)
- Race & ethnicity
- White 62% Two or more races 24% Black 8% Hispanic / Latino 7%
- Hispanic origin (detail)
- Mexican 6%
- Common ancestry
- Italian 4% Iranian 1% Lithuanian 1%
- Foreign-born
- 1%
- Languages at home
- 96% English-only · Spanish 2% Arabic 1% Other Asian/Pacific 1%
Political lean MEDSL · Delaware
- 2024 margin
- R (+15.8) · D 41.2% · R 57.0% · Other 1.8%
- 2008→2024 swing
- -30.8pp toward R · 2008: 15.0pp · 2024: -15.8pp
- All cycles
- 2024: R+15.8 2020: R+13.2 2016: R+13.7 2012: D+3.1 2008: D+15.0
Not yet ingested
- Civics
- —
Market trends
- HPI YoY
- ▲ 5.27%
- Current HPI
- 269.888
- Rent YoY
- ▲ 3.27%
- Metro
- Muncie, IN
- State GDP YoY
- ▲ 2.90%
- F500 in state
- 18
Industry mix (Fortune 500 HQ in IN)
| Industry | F500 HQs | Revenue |
|---|---|---|
| Industrial Machinery | 2 | $37B |
|
||
| Healthcare | 1 | $177B |
|
||
| Pharmaceuticals | 1 | $45B |
|
||
| Metals / Steel | 1 | $18B |
|
||
| Agriculture | 1 | $17B |
|
||
| Packaging | 1 | $12B |
|
||
Price history
+248.6% since first listed11 events — show timeline
- 2026-05-22 Relisted — IRMLS
- 2026-04-27 Pending — IRMLS
- 2026-03-04 Relisted — IRMLS
- 2026-02-27 Contingent — IRMLS
- 2026-02-26 Price Changed $149,900 IRMLS
- 2025-09-27 Listed $159,900 IRMLS
- 2025-04-02 Sold (MLS) $29,000 MIBOR as Distributed by MLS Grid
- 2025-03-31 Pending — MIBOR as Distributed by MLS Grid
- 2025-02-10 Price Changed $35,000 MIBOR as Distributed by MLS Grid
- 2025-01-14 Price Changed $38,000 MIBOR as Distributed by MLS Grid
- 2024-12-07 Listed $43,000 MIBOR as Distributed by MLS Grid
Property tax history
-0.7%/yrLatest (2024): $1,136 · +17.2% YoY. Source: county tax records.
Cash-flow waterfall
monthlySold comps — $/sqft
last 12 mo · ≤1 miLoading sold comps…