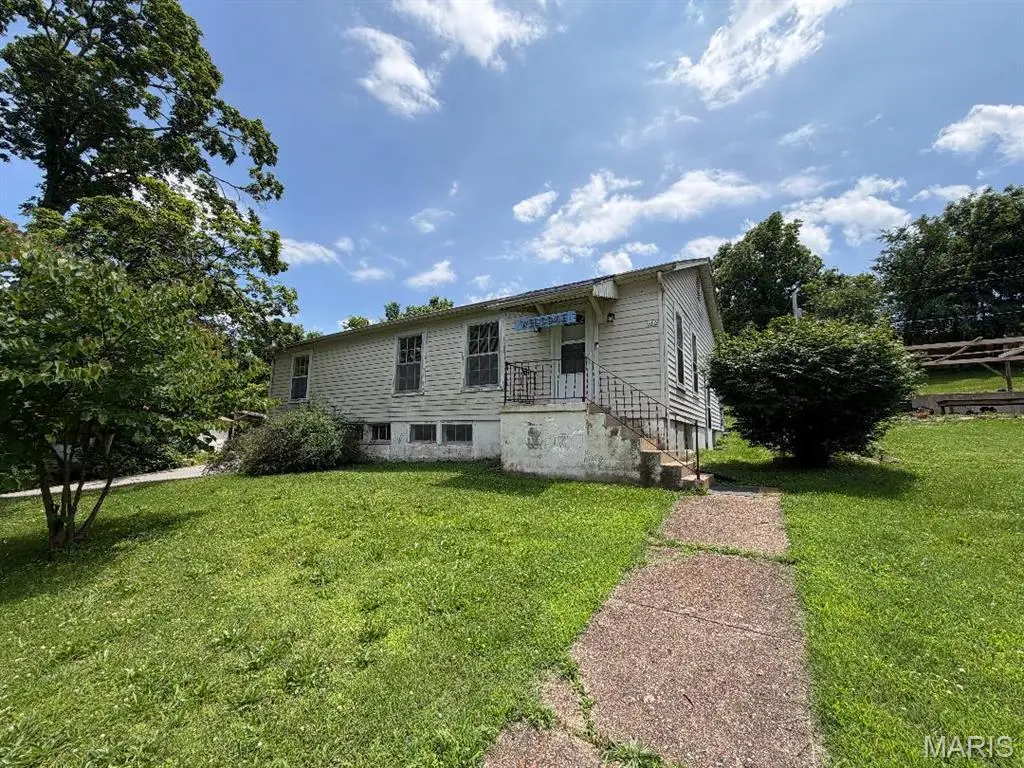
406 Fort St · Waynesville, MO
Flood risk 1/10 · Minimal
- FEMA flood zone
- X (unshaded)
- Chance of flooding over 30 yrs
- 0.0%
- Est. flood insurance / yr
- $473 – $860
Fire risk 4/10 · Minor
- Est. fire insurance / yr
- $1,054 – $1,958
Heat risk 4/10 · Minor
- Hot days now (above 107°F)
- 7 days/yr
- Hot days in 30 yrs
- 19 days/yr
Wind risk 2/10 · Minimal
- Chance of severe wind over 30 yrs
- 0.0%
Air-quality risk 1/10 · Minimal
- Unhealthy air days now
- 0 days/yr
- Unhealthy air days in 30 yrs
- 0 days/yr
Risk factors via First Street. Map © Google.
Why this score? — see what drove the B grade
The composite is a weighted blend of 9 inputs, each scored 0–100. Each bar is that input's sub-score; the figure is the points it added to the 100-point composite (weight × sub-score).
- Cash flow +30.0/30.0
- 1% rule +10.0/10.0
- DSCR +10.0/10.0
- ARV discount +7.5/15.0
- Rent growth +5.0/5.0
- Schools +4.2/10.0
- Livability +3.2/5.0
- Condition / age +2.5/5.0
- Appreciation +0.0/10.0
$70,000
🖨 Deal sheet 📄 Offer letter ✓ Due diligence
Listing remarks MLS
A comfortable cottage style home over full basement in the heart of Waynesville with access to everything. This home features a large corner lot, with two bedrooms and one full bathroom. Call today for additional information or to schedule a showing!
Key facts
- Adjoining lot
- Cottage style home
- Extra space
Tags
Property features AI
Finance
- Other: Seller may consider concessions
Exterior
- Parking: Garage (1 car)
- Utilities: Public water; Public sewer; Electric service (other)
- Home design: Single family residence; One level
- Construction: Shingle roof; Other construction materials; Full unfinished walk-out basement
- Exterior features: Corner lot; Back yard fencing (chain link)
Interior
- Kitchen: Range; Free-standing refrigerator; Gas water heater
- Bedrooms: 2 bedrooms on the main level
- Flooring: Carpet; Hardwood; Vinyl
- Bathrooms: 1 full bathroom on the main level
- Heating & cooling: Forced air heating (natural gas); Central electric air conditioning
- Interior features: Built-in features
- Laundry & utility: Laundry in the basement
Neighborhood map
What this means for you Summary
Snapshot
- This is a 2-bed/1.0-bath other listed at $70k.
Deal economics
- At list price, monthly cash flow is $466 ($6k/yr) — positive.
- The deal already cash-flows at list — no discount required.
- Meets the 1% rule at list price ($1k rent vs $70k).
- Cap rate 14.3% vs local median 4.0% in Waynesville — top-decile yield for the area; either an underpriced asset or a hidden risk that comps aren't pricing in. Stress-test before assuming the spread holds.
Location & tenants
- Location reads 64/100 on livability (#322 in MO) — a middle-class / working-renter tenant base. Strengths: cost of living A+, housing A+; Watch: crime C-, amenities F, commute F.
- Waynesville R-VI (town): math 46% / reading 53% proficiency, ranked #41 of 324 in MO (top 13%) — families likely to look elsewhere, expect single-tenant / working-renter base with shorter leases.
- Zoned schools: Waynesville East Elem. (math 51% / reading 53%, grade C-, #231 of 1,115 statewide, top 24%, 929 students, 44% FRL); Waynesville Sr. High (math 37% / reading 53%, grade D-, #176 of 521 statewide, top 34%, 1,704 students, 39% FRL).
- Market conditions: Rents rising fast (+10.3%/yr); 156 active listings in the ZIP; solid renter incomes; 62 units permitted in Pulaski County in 2024 (0 in 5+ unit buildings).
- This rent is only 18% of the median local income ($77k/yr) — well below the 30% rent-burden line; pricing power to push rent on renewal without tenant pushback.
Forward outlook
- Local home prices are declining (-3.0%/yr); year-one equity from $484 of loan paydown is wiped out by about $2k of value loss. Plan a longer hold.
- At projected returns (-3.0% appreciation + 8.0% rent growth), your $20k cash investment doubles in ~4 years — after that, you're playing with house money.
Negotiation context
- Only 1 days on market — expect competitive offers; lowballing is unlikely to land.
- 2 sale attempts since 12y ago with the ask held roughly flat each time — persistent listings suggest the price (not the market) is what's stuck; bring a comps-based counter.
Risks & watch-outs
- Watch-outs: built in 1943 — expect roof / HVAC / electrical / plumbing capex.
Questions for the listing agent
- Built in 1943 — when were the roof, HVAC, electrical panel, plumbing, and water heater last replaced?
- Is there a deadline driving the sale (1031 exchange, divorce, estate, relocation)? That informs how much negotiation room exists.
- Schools are B-rated — typically a magnet for longer-tenancy family renters. What's the average tenant stay here, and is there a school-zone premium baked into asking?
- What's the average days-on-market for RENTAL listings here right now (not sales)? A rising rental-DOM trend means longer vacancies and softer asking-rent achievability than the comps imply.
- What's the recent tenant-quality profile in this submarket — average credit score on applications, eviction rate, late-payment / NSF rate, and stable-employment percentage? A property-management company in the area should have these aggregated.
- How much new for-sale + rental construction is in the pipeline within 1–3 miles? Heavy new supply typically softens prices + rents 12–24 months out; constrained supply supports both.
Investment metrics
- 1% rule
- 1.64% ✓
- Cap rate
- 14.27%
- Cash-on-cash
- 28.51%
- DSCR
- 2.27
- GRM
- 5.1
CMA / ARV
No comps found within radius.
Projected returns pro-forma
-3.0% appreciation · 8.0% rent growth · sell at horizon
- IRR
- 28.1%
- Equity multiple
- 2.24×
- Total profit
- $24,358
- Equity at exit
- $10,437
- IRR
- 38.3%
- Equity multiple
- 5.43×
- Total profit
- $86,925
- Equity at exit
- $6,052
Cash invested: $19,600 (down + closing). Projections, not guarantees.
Landlord ↔ Tenant lean methodology
- Overall (STATE)
- 81 Strongly Landlord-Friendly
- State Missouri
- 81 Strongly Landlord-Friendly · R+10
- County
- — inherits STATE
- City
- — inherits STATE
ZIP-level market 65583
- Home prices YoY
- -27.3%
- Rents YoY
- 10.3%
- Active inventory
- 156
- Price-to-rent
- 5.1×
Monthly cashflow live
- Estimated rent
- $1,146 medium interval (Pro) →
- Mortgage (P&I)
- −$367
- Tax from tax record
- −$44 /mo · $524/yr
- Insurance
- −$29
- HOA
- −$0
- Vacancy / Maint / Mgmt
- −$241
- Net cashflow
- $466
Break-even live
UW: 25.0% down · 7.5% · 30yr · 1.5% tax · 5.0% vac · 8.0% maint · 8.0% mgmt
Financing live
Cash to close
- Down payment
- $17,500
- Closing costs
- $2,100
- Reserves months
- —
- Total cash needed
- —
Loan-product check · same deal, 3 products live
Conventional
25% down · 7.5% · 30yr
- Down + closing
- —
- Monthly P&I
- —
- Monthly cashflow
- —
- DSCR
- —
- Eligible?
- —
Personal DTI + credit; lowest rate.
DSCR
20% down · 8.5% · 30yr
- Down + closing
- —
- Monthly P&I
- —
- Monthly cashflow
- —
- DSCR
- —
- Eligible?
- —
No personal income docs; deal must DSCR.
Hard money
10% down · 12.0% · 12mo
- Down + closing
- —
- Monthly P&I
- —
- Monthly cashflow
- —
- DSCR
- —
- Eligible?
- —
Short-term bridge; refi at stabilization.
Listing history 3 events
-
2026-06-03status $70,000 Pending 1 DOM
-
2026-06-01remarks 598-char remark
-
2026-06-01$70,000 Active 1 DOM
ⓘ Source: listings_history table (triggers on properties + properties_extension) + one-shot
backfill from property_details.listing_events for pre-trigger history.
Tax reassessment forecast MO · Resets to sale price
- Current annual tax
- $524 · $44/mo
- Projected year-2 tax
- $679 · $57/mo
- Expected delta
- +$155/yr (+$13/mo · 29.6%)
ⓘ Screening estimate from a state-policy table — verify with the county assessor before closing.
Climate risk First Street
- Flood 1/10 Low FEMA zone X (unshaded) · 0% chance over 30 yrs
- Wildfire 4/10 Moderate
- Heat 4/10 Moderate 7 d/yr ≥107°F today · 19 d/yr by 30 yrs out
- Wind 2/10 Low 0% chance of damaging wind over 30 yrs
- Air quality 1/10 Low 0 unhealthy d/yr today · 0 by 30 yrs out
Nearby sold comps map
Loading sold comps map…
Walkable amenities ~0.75 mi
Loading nearby amenities…
Taxation est. · year 1
- Rental income
- $13,755
- − Mortgage interest
- −$3,921
- − Property taxes
- −$524
- − Insurance
- −$350
- − Repairs & maintenance
- −$1,100
- − Management
- −$1,100
- − Depreciation
- −$2,036
- Taxable income
- $4,722
- Est. tax owed @ 24.0%
- −$1,133
- After-tax cash flow
- $4,454/yr
For passive investors: Depreciation is non-cash, so a rental often shows a tax loss while cash-flowing — sheltering income. Rental losses are passive: they offset passive income freely, and up to $25,000/yr can offset ordinary (W-2) income if you actively participate and your MAGI is under $100k (phasing out to $0 by $150k); unused losses carry forward. On sale, claimed depreciation is recaptured at up to 25%, and gains may owe capital-gains tax (a 1031 exchange can defer both). Figures are a year-1 estimate at your 24.0% rate — not tax advice; consult a CPA.
Schools (NCES district)
- District
- Waynesville R-VI
- NCES district ID
- 2931440
- Math proficiency
- 46% ▼ -1.00%
- Reading proficiency
- 53% ▼ -1.00%
- Median HH income
- $50,147
- Composite
- 42.36/100
- National rank
- #3246
- State rank
- #41 of 324 in MO
Livability — Waynesville
- Score
- 64/100
- State rank
- #322
- US rank
- #14679
Category grades
Schools grade is shown separately in the Schools card above.
Census & demographics
- Census place
- Waynesville, MO
- County
- Pulaski County · 25,264 people
- City population
- 14,711
- Metro
- Fort Leonard Wood, MO
- Population (ZIP)
- 14,711
- Household income
- $76,626
- Rent vs Own
- Severe rent burden
- 185.0
Population outlook (Pulaski County) Hauer SSP2
- Today (2025)
- 54,214 people
- By 2030
- 54,723 · +0.9%
- By 2040
- 54,885 · +1.2%
- By 2050
- 55,467 · +2.3%
- By 2075
- 58,576 · +8.0%
- By 2100
- 61,179 · +12.8%
Race, ethnicity, and origin ACS 2023
- Neighborhood character
- Predominantly White (76%)
- Race & ethnicity
- White 76% Black 12% Two or more races 9% Hispanic / Latino 5% Asian 1%
- Common ancestry
- Iranian 4% Serbian 2% Lithuanian 2%
- Foreign-born
- 4% · Canada, South Korea, Jamaica
- Languages at home
- 96% English-only · Spanish 2% German/W. Germanic 1% Korean 1%
Political lean MEDSL · Pulaski
- 2024 margin
- Solid R (+50.3) · D 24.2% · R 74.5% · Other 1.3%
- 2008→2024 swing
- -21.6pp toward R · 2008: -28.7pp · 2024: -50.3pp
- All cycles
- 2024: R+50.3 2020: R+45.7 2016: R+51.7 2012: R+36.1 2008: R+28.7
Not yet ingested
- Civics
- —
Market trends
- HPI YoY
- ▼ -58.32%
- Current HPI
- 155.2931
- Rent YoY
- ▲ 10.27%
- Metro
- Fort Leonard Wood, MO
- State GDP YoY
- ▲ 1.84%
- F500 in state
- 20
Industry mix (Fortune 500 HQ in MO)
| Industry | F500 HQs | Revenue |
|---|---|---|
| Healthcare | 1 | $163B |
|
||
| Insurance | 1 | $21B |
|
||
| Industrial Technology | 1 | $17B |
|
||
| Retail | 1 | $16B |
|
||
| Industrial Distribution | 1 | $10B |
|
||
| Utilities | 1 | $9B |
|
||
Price history
+128.8% since first listed4 events — show timeline
- 2026-06-01 Listed $70,000 MARIS as Distributed by MLS Grid
- 2014-06-20 Sold (MLS) — MARIS as Distributed by MLS Grid
- 2014-03-20 Listed $30,600 MARIS as Distributed by MLS Grid
- 1996-06-01 Sold (Public Records) — Public Records
Property tax history
+3.4%/yrLatest (2025): $524 · +4.2% YoY. Source: county tax records.
Cash-flow waterfall
monthlySold comps — $/sqft
last 12 mo · ≤1 miLoading sold comps…