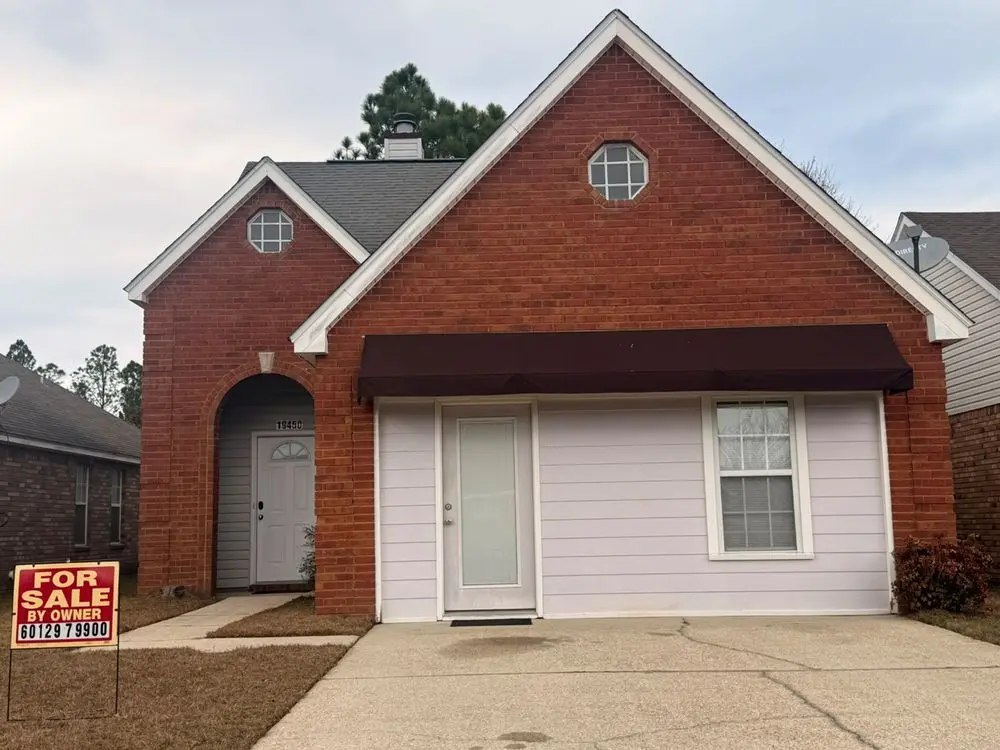
19450 Ty Ridge Rd · Lyman, MS
Flood risk No data
- FEMA flood zone
- —
- Chance of flooding over 30 yrs
- —
- Est. flood insurance / yr
- —
Fire risk No data
- Est. fire insurance / yr
- —
Heat risk No data
- Hot days now (above threshold)
- —
- Hot days in 30 yrs
- —
Wind risk No data
- Chance of severe wind over 30 yrs
- —
Air-quality risk No data
- Unhealthy air days now
- —
- Unhealthy air days in 30 yrs
- —
Risk factors via First Street. Map © Google.
Why this score? — see what drove the C+ grade
The composite is a weighted blend of 9 inputs, each scored 0–100. Each bar is that input's sub-score; the figure is the points it added to the 100-point composite (weight × sub-score).
- Cash flow +20.2/30.0
- ARV discount +15.0/15.0
- DSCR +6.4/10.0
- 1% rule +5.4/10.0
- Rent growth +4.2/5.0
- Schools +4.2/10.0
- Condition / age +3.8/5.0
- Livability +3.5/5.0
- Appreciation +0.0/10.0
$179,000
🖨 Deal sheet 📄 Offer letter ✓ Due diligence
Listing remarks MLS
You will love being right next to the award-winning Windance Country Club estates in this spacious two-story home nestled in a well established community and top rated school district! Being one of the larger homes in the neighborhood, you can enjoy the benefits of a bonus room in addition to the master bedroom and bath downstairs, and two bedrooms and a full bath upstairs. Set the mood with the fireplace in the living room, while enjoying a meal in the dinning room leading into the kitchen. This home has the perfect layout to make the most of your time together while making memories for a lifetime! The home is priced as is to keep costs down, allowing the new owner the freedom to choose their own paint colors and complete a few cosmetic interior finishes to match their personal style. At this price it will not last long, so contact us as soon as possible!
Key facts
- Kitchen
- Bonus room
- Dining room
Tags
Neighborhood map
What this means for you Summary
Snapshot
- This is a 3-bed/2.0-bath single-family listed at $179k. Condition is rated good.
Deal economics
- At list price, monthly cash flow is $227 ($3k/yr) — positive.
- The deal already cash-flows at list — no discount required.
- Meets the 1% rule at list price ($2k rent vs $179k).
- Recommended offer: $163k (9.0% below list) — sets the bar for market timing.
- Cap rate 7.8% vs local median 4.4% in Lyman — top-decile yield for the area; either an underpriced asset or a hidden risk that comps aren't pricing in. Stress-test before assuming the spread holds.
Location & tenants
- Location reads 69/100 on livability (#47 in MS) — a middle-class / working-renter tenant base. Strengths: crime A+, employment A+, cost of living A+; Watch: schools F, amenities F, commute F.
- Harrison County School District (rural): math 52% / reading 46% proficiency, ranked #14 of 130 in MS (top 11%) — families likely to look elsewhere, expect single-tenant / working-renter base with shorter leases; 62% free/reduced lunch — lower-income household profile, screen leases tightly.
- Market conditions: Rents rising fast (+7.0%/yr); 763 active listings in the ZIP; 1 comparable units currently listed for rent nearby; 2,194 units permitted in Harrison County in 2024 (0 in 5+ unit buildings).
- This rent runs 36% of the median local income ($63k/yr) — at the standard rent-burdened threshold; future hikes will face affordability resistance.
Forward outlook
- Local home prices are declining (-3.0%/yr); year-one equity from $1k of loan paydown is wiped out by about $5k of value loss. Plan a longer hold.
- Harrison County population projected at +27% by 2050 — long-run rental-demand tailwind backs the buy-and-hold thesis.
- At projected returns (-3.0% appreciation + 7.0% rent growth), your $50k cash investment doubles in ~10 years — after that, you're playing with house money.
Negotiation context
- It's been on market 107 days — a 9% lower offer ($163k) is reasonable based on typical stale-listing flexibility.
Questions for the listing agent
- It's been on market 107 days. Have you received any prior offers? Is the seller open to a 9% concession, seller financing, or rate buy-down credit?
- Why hasn't it sold? Are there any deal-killer items the seller is aware of (foundation, flood, title, zoning, code violations)?
- Is there a deadline driving the sale (1031 exchange, divorce, estate, relocation)? That informs how much negotiation room exists.
- Schools are F-rated, which usually means shorter tenancies and higher turnover. Who's the typical renter profile here, and what's been the actual vacancy rate?
- What's the average days-on-market for RENTAL listings here right now (not sales)? A rising rental-DOM trend means longer vacancies and softer asking-rent achievability than the comps imply.
- What's the recent tenant-quality profile in this submarket — average credit score on applications, eviction rate, late-payment / NSF rate, and stable-employment percentage? A property-management company in the area should have these aggregated.
- How much new for-sale + rental construction is in the pipeline within 1–3 miles? Heavy new supply typically softens prices + rents 12–24 months out; constrained supply supports both.
Investment metrics
- 1% rule
- 1.04% ✓
- Cap rate
- 7.82%
- Cash-on-cash
- 5.44%
- DSCR
- 1.24
- GRM
- 8.0
CMA / ARV
- ARV (median comp)
- $309,429
- List price
- $179,000
- Delta
- -42.15%
- Verdict
- UNDERPRICED
- Comps
- 20 within 1.0 mi
Show comp detail 12 sales within ~0.75 mi
| Address | Dist | Beds/Ba | Sqft | Sold | Price | $/sf | Match |
|---|---|---|---|---|---|---|---|
| 16418 Millsaps Ave | 0.19mi | 4/2.0 (+1) | 1,885 (-6%) | 1mo | $285,000 | $151 | 76 |
| 16345 Millsaps Ave | 0.30mi | 3/2.0 | 1,936 (-3%) | 7mo | $280,000 | $145 | 75 |
| 16255 Millsaps Ave | 0.47mi | 3/2.0 | 1,936 (-3%) | 4mo | $295,500 | $153 | 70 |
| 16423 Millsaps Ave | 0.17mi | 4/2.0 (+1) | 2,204 (+10%) | 0mo | $320,000 | $145 | 70 |
| 16904 Desmare St | 0.24mi | 4/2.5 (+1) | 1,902 (-5%) | 9mo | $272,000 | $143 | 66 |
| 16424 Millsaps Ave | 0.18mi | 4/2.0 (+1) | 2,204 (+10%) | 9mo | $299,900 | $136 | 62 |
| 16955 Alcorn Ave | 0.21mi | 3/2.0 | 1,710 (-14%) | 12mo | $265,000 | $155 | 56 |
| 16243 Tougaloo Ln | 0.54mi | 4/2.0 (+1) | 1,885 (-6%) | 8mo | $275,000 | $146 | 54 |
| 15186 Belhaven St | 0.52mi | 4/2.0 (+1) | 2,204 (+10%) | 1mo | $309,900 | $141 | 53 |
| 16951 Acron St | 0.47mi | 3/2.0 | 1,714 (-14%) | 4mo | $235,000 | $137 | 50 |
| 15085 Baylor Ave | 0.47mi | 3/2.0 | 1,719 (-14%) | 6mo | $229,000 | $133 | 49 |
| 15154 Belhaven St | 0.56mi | 4/2.0 (+1) | 2,204 (+10%) | 9mo | $310,000 | $141 | 44 |
Match score weights: distance 35% · size 25% · config 20% · recency 20%. Top-matched comps best support the ARV.
Projected returns pro-forma
-3.0% appreciation · 6.99% rent growth · sell at horizon
- IRR
- -3.5%
- Equity multiple
- 0.87×
- Total profit
- $-6,766
- Equity at exit
- $26,689
- IRR
- 10.3%
- Equity multiple
- 1.94×
- Total profit
- $47,340
- Equity at exit
- $15,477
Cash invested: $50,120 (down + closing). Projections, not guarantees.
Landlord ↔ Tenant lean methodology
- Overall (STATE)
- 90 Strongly Landlord-Friendly
- State Mississippi
- 90 Strongly Landlord-Friendly · R+11
- County
- — inherits STATE
- City
- — inherits STATE
ZIP-level market 39503
- Home prices YoY
- -21.5%
- Rents YoY
- 7.0%
- Active inventory
- 763
- Price-to-rent
- 8.0×
Monthly cashflow live
- Estimated rent
- $1,853 medium interval (Pro) →
- Mortgage (P&I)
- −$939
- Tax est. 1.5%
- −$224 /mo · $2,685/yr
- Insurance
- −$75
- HOA
- −$0
- Vacancy / Maint / Mgmt
- −$389
- Net cashflow
- $227
Break-even live
UW: 25.0% down · 7.5% · 30yr · 1.5% tax · 5.0% vac · 8.0% maint · 8.0% mgmt
Financing live
Cash to close
- Down payment
- $44,750
- Closing costs
- $5,370
- Reserves months
- —
- Total cash needed
- —
Loan-product check · same deal, 3 products live
Conventional
25% down · 7.5% · 30yr
- Down + closing
- —
- Monthly P&I
- —
- Monthly cashflow
- —
- DSCR
- —
- Eligible?
- —
Personal DTI + credit; lowest rate.
DSCR
20% down · 8.5% · 30yr
- Down + closing
- —
- Monthly P&I
- —
- Monthly cashflow
- —
- DSCR
- —
- Eligible?
- —
No personal income docs; deal must DSCR.
Hard money
10% down · 12.0% · 12mo
- Down + closing
- —
- Monthly P&I
- —
- Monthly cashflow
- —
- DSCR
- —
- Eligible?
- —
Short-term bridge; refi at stabilization.
Rent comps 1 comps
| Address | Beds | Baths | Sqft | Rent | $/sqft | DOM | Units | Dist |
|---|---|---|---|---|---|---|---|---|
| 15395 Percy St Gulfport, MS | 3.0 | 2.0 | 1710 | $1,975 | $1.15 | 43d | 1 | 1.31mi |
Listing history 5 events
-
2026-06-02days on market $179,000 Active 107 DOM
-
2026-06-01days on market $179,000 Active 106 DOM
-
2026-05-31days on market $179,000 Active 105 DOM
-
2026-05-30days on market $179,000 Active 104 DOM
-
2026-02-15$179,000 Active 869-char remark
Show marketing remark (869 chars)
You will love being right next to the award-winning Windance Country Club estates in this spacious two-story home nestled in a well established community and top rated school district! Being one of the larger homes in the neighborhood, you can enjoy the benefits of a bonus room in addition to the master bedroom and bath downstairs, and two bedrooms and a full bath upstairs. Set the mood with the fireplace in the living room, while enjoying a meal in the dinning room leading into the kitchen. This home has the perfect layout to make the most of your time together while making memories for a lifetime! The home is priced as is to keep costs down, allowing the new owner the freedom to choose their own paint colors and complete a few cosmetic interior finishes to match their personal style. At this price it will not last long, so contact us as soon as possible!
ⓘ Source: listings_history table (triggers on properties + properties_extension) + one-shot
backfill from property_details.listing_events for pre-trigger history.
Nearby sold comps map
Loading sold comps map…
Walkable amenities ~0.75 mi
Loading nearby amenities…
Taxation est. · year 1
- Rental income
- $22,242
- − Mortgage interest
- −$10,027
- − Property taxes
- −$2,685
- − Insurance
- −$895
- − Repairs & maintenance
- −$1,779
- − Management
- −$1,779
- − Depreciation
- −$5,207
- Taxable loss
- −$131
- Est. tax savings @ 24.0%
- +$31
- After-tax cash flow
- $2,758/yr
For passive investors: Depreciation is non-cash, so a rental often shows a tax loss while cash-flowing — sheltering income. Rental losses are passive: they offset passive income freely, and up to $25,000/yr can offset ordinary (W-2) income if you actively participate and your MAGI is under $100k (phasing out to $0 by $150k); unused losses carry forward. On sale, claimed depreciation is recaptured at up to 25%, and gains may owe capital-gains tax (a 1031 exchange can defer both). Figures are a year-1 estimate at your 24.0% rate — not tax advice; consult a CPA.
Condition & rehab AI · 7 photos
This spacious two-story home in a well-established community is in good condition with minimal repairs needed. It offers a good ROI with updates that can significantly increase its value.
Value-add opportunities
- Both Painting exterior and interior walls — Fresh paint enhances curb appeal and interior aesthetics
- Both Landscaping and curb appeal improvements — Enhances curb appeal and can attract more buyers
- Both New flooring in bathrooms — Fresh flooring improves aesthetics and can increase value
- Both New kitchen appliances — Modern appliances can attract more buyers and renters
- Both New lighting fixtures — Updated lighting can improve ambiance and increase value
Renovation cost estimate screening
Value-add ROI direction
- Both Painting exterior and interior walls — Fresh paint enhances curb appeal and interior aesthetics ↑
- Both Landscaping and curb appeal improvements — Enhances curb appeal and can attract more buyers ↑
- Both New flooring in bathrooms — Fresh flooring improves aesthetics and can increase value ↑
- Both New kitchen appliances — Modern appliances can attract more buyers and renters ↑
- Both New lighting fixtures — Updated lighting can improve ambiance and increase value ↑
ⓘ Cost ranges are severity-bucket heuristics (US national rule-of-thumb). Get contractor quotes + a written scope before underwriting a rehab budget.
Schools (NCES district)
- District
- Harrison County School District
- NCES district ID
- 2801770
- Math proficiency
- 52% ▼ -4.00%
- Reading proficiency
- 46% ▼ -4.00%
- Median HH income
- $46,504
- Composite
- 41.66/100
- National rank
- #3419
- State rank
- #14 of 130 in MS
Livability — Lyman
- Score
- 69/100
- State rank
- #47
- US rank
- #8189
Category grades
Schools grade is shown separately in the Schools card above.
Census & demographics
- Census place
- Lyman, MS
- County
- Harrison County · 178,171 people
- City population
- 96,188
- Metro
- Gulfport-Biloxi, MS
- Population (ZIP)
- 55,059
- Household income
- $62,641
- Rent vs Own
- Severe rent burden
- 1686.0
Population outlook (Harrison County) Hauer SSP2
- Today (2025)
- 228,444 people
- By 2030
- 241,942 · +5.9%
- By 2040
- 267,531 · +17.1%
- By 2050
- 291,062 · +27.4%
- By 2075
- 346,711 · +51.8%
- By 2100
- 378,165 · +65.5%
Race, ethnicity, and origin ACS 2023
- Neighborhood character
- Diverse neighborhood (Simpson 0.58)
- Race & ethnicity
- White 58% Black 27% Two or more races 9% Hispanic / Latino 6% Asian 2%
- Hispanic origin (detail)
- Mexican 2% Puerto Rican 1%
- Common ancestry
- Lithuanian 5% Slovak 1% Portuguese 1%
- Foreign-born
- 3% · Canada
- Languages at home
- 95% English-only · Spanish 3%
Political lean MEDSL · Harrison
- 2024 margin
- Strong R (+28.9) · D 35.0% · R 63.9% · Other 1.1%
- 2008→2024 swing
- -2.9pp toward R · 2008: -26.0pp · 2024: -28.9pp
- All cycles
- 2024: R+28.9 2020: R+25.2 2016: R+30.7 2012: R+26.6 2008: R+26.0
Not yet ingested
- Civics
- —
Market trends
- HPI YoY
- ▼ -51.39%
- Current HPI
- 187.285
- Rent YoY
- ▲ 6.99%
- Metro
- Gulfport-Biloxi, MS
- State GDP YoY
- —
- F500 in state
- 0
Price history
1 event — show timeline
- 2026-02-15 Listed $179,000 ForSaleByOwner.com
Cash-flow waterfall
monthlySold comps — $/sqft
last 12 mo · ≤1 miLoading sold comps…