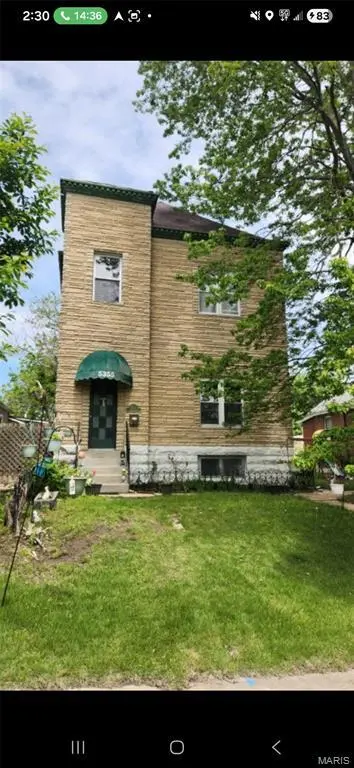
5355 Magnolia Ave · St. Louis, MO
Flood risk 1/10 · Minimal
- FEMA flood zone
- X (unshaded)
- Chance of flooding over 30 yrs
- 0.0%
- Est. flood insurance / yr
- $473 – $860
Fire risk 1/10 · Minimal
- Est. fire insurance / yr
- $1,054 – $1,958
Heat risk 5/10 · Moderate
- Hot days now (above 107°F)
- 7 days/yr
- Hot days in 30 yrs
- 21 days/yr
Wind risk 2/10 · Minimal
- Chance of severe wind over 30 yrs
- 1.0%
Air-quality risk 3/10 · Minor
- Unhealthy air days now
- 3 days/yr
- Unhealthy air days in 30 yrs
- 4 days/yr
Risk factors via First Street. Map © Google.
Why this score? — see what drove the C grade
The composite is a weighted blend of 9 inputs, each scored 0–100. Each bar is that input's sub-score; the figure is the points it added to the 100-point composite (weight × sub-score).
- Cash flow +26.3/30.0
- DSCR +8.9/10.0
- ARV discount +7.5/15.0
- 1% rule +6.8/10.0
- Rent growth +3.8/5.0
- Livability +2.5/5.0
- Condition / age +2.5/5.0
- Schools +1.2/10.0
- Appreciation +0.0/10.0
$220,000
🖨 Deal sheet 📄 Offer letter ✓ Due diligence
Listing remarks MLS
Nice 2 story home in south city area. Show Today! Seller will make no repairs or provide any inspections or warranties. For faster response include lead paint disclosure, seller addendums (if required). Response time may be Special sale contract, proof of funds or preapproval, copy of earnest money, Seller will a week or more but usually less, please allow for this in the contract. Earnest money must be 3% if price or $1,000.00 whatever is higher made to seller escrow agent of choice-varies by seller, call listing agent for details (cashiers check, money order only). Must be delivered to listing agent within 24 hours of accepted offer. If multiply offer situation seller can accept or counter any offer they choose regardless the order presented, received or countered.
Key facts
- 6,899 sq ft lot
- Built 1897
- Listed 6 days
Property features AI
Exterior
- Utilities: Public water; Public sewer; 220 volt electric service; Cable available; Electricity connected; Natural gas connected; Water available
- Home design: Single-family residence; Two levels
- Construction: Block construction
- Exterior features: Open lot
Interior
- Bedrooms: 3 bedrooms (all on upper level)
- Bathrooms: 3 full bathrooms (including 1 full on the main level and 2 full on the upper level)
- Interior features: Forced air heating; Ceiling fans; Central air conditioning; Unfinished basement
Neighborhood map
What this means for you Summary
Snapshot
- This is a 3-bed/3.0-bath single-family listed at $220k.
Deal economics
- At list price, monthly cash flow is $565 ($7k/yr) — positive.
- The deal already cash-flows at list — no discount required.
- Meets the 1% rule at list price ($3k rent vs $220k).
- Cap rate 9.4% vs local median 5.0% in St. Louis — top-decile yield for the area; either an underpriced asset or a hidden risk that comps aren't pricing in. Stress-test before assuming the spread holds.
Location & tenants
- Location reads: area grade C — affects rentability + tenant quality, not the cash-flow math above.
- St. Louis City (urban): math 10% / reading 18% proficiency, ranked #312 of 324 in MO (top 96%) — low school quality limits family demand, transient renter base, plan for 1-2y turnover; 80% free/reduced lunch — lower-income household profile, screen leases tightly.
- Zoned schools: Mason Elem. (math 22% / reading 37%, grade F, #813 of 1,115 statewide, top 75%, 389 students, 99% FRL); Roosevelt High (math 2% / reading 8%, grade F, #517 of 521 statewide, top 100%, 460 students, 99% FRL) — zoned schools average 99% FRL vs 80% district-wide (19 pts higher); higher-poverty schools than district average — tighter screening recommended.
- Market conditions: Rents rising fast (+5.4%/yr); 137 active listings in the ZIP; 14 comparable units currently listed for rent nearby; rentals at typical pace (median 21d on market — plan ~3-4 weeks tenant-placement turnaround); solid renter incomes; 294 units permitted in St. Louis city in 2024 (227 in 5+ unit buildings).
- This rent runs 41% of the median local income ($76k/yr) — at the standard rent-burdened threshold; future hikes will face affordability resistance.
Forward outlook
- Local home prices are declining (-3.0%/yr); year-one equity from $2k of loan paydown is wiped out by about $7k of value loss. Plan a longer hold.
- St. Louis County population projected to shrink 6% by 2050 — rents likely to lag national; underwrite the cash flow, not the appreciation.
- At projected returns (-3.0% appreciation + 5.4% rent growth), your $62k cash investment doubles in ~9 years — after that, you're playing with house money.
Negotiation context
- Only 6 days on market — expect competitive offers; lowballing is unlikely to land.
- Current owner paid $180k; 22% above their basis — modest negotiation headroom, anchor on the comps not their cost.
Risks & watch-outs
- Watch-outs: built in 1897 — expect roof / HVAC / electrical / plumbing capex.
- Climate carrying-cost: extreme-heat days projected 7→21/yr by 2055 (HVAC capex compounding) — expect insurance premiums to compound above CPI over the hold.
Questions for the listing agent
- Built in 1897 — when were the roof, HVAC, electrical panel, plumbing, and water heater last replaced?
- Is there a deadline driving the sale (1031 exchange, divorce, estate, relocation)? That informs how much negotiation room exists.
- What's the average days-on-market for RENTAL listings here right now (not sales)? A rising rental-DOM trend means longer vacancies and softer asking-rent achievability than the comps imply.
- What's the recent tenant-quality profile in this submarket — average credit score on applications, eviction rate, late-payment / NSF rate, and stable-employment percentage? A property-management company in the area should have these aggregated.
- How much new for-sale + rental construction is in the pipeline within 1–3 miles? Heavy new supply typically softens prices + rents 12–24 months out; constrained supply supports both.
Investment metrics
- 1% rule
- 1.18% ✓
- Cap rate
- 9.38%
- Cash-on-cash
- 11.01%
- DSCR
- 1.49
- GRM
- 7.0
CMA / ARV
- ARV (on-the-fly)
- $459,680
- Comps found
- 12
Show comp detail 12 sales within ~0.75 mi
| Address | Dist | Beds/Ba | Sqft | Sold | Price | $/sf | Match |
|---|---|---|---|---|---|---|---|
| 2637 Pearl Ave | 0.28mi | 3/3.0 | 2,128 (+2%) | 1mo | $450,000 | $211 | 83 |
| 5632 S Magnolia Ave | 0.32mi | 3/2.5 | 2,041 (-2%) | 2mo | $565,000 | $277 | 78 |
| 4978 Odell St | 0.38mi | 4/3.0 (+1) | 2,214 (+6%) | 1mo | $489,000 | $221 | 66 |
| 2104 Robert Ruggeri Pl | 0.56mi | 3/3.5 | 2,019 (-3%) | 3mo | $539,500 | $267 | 65 |
| 3129 Maury Ave | 0.67mi | 3/3.0 | 2,112 (+2%) | 3mo | $249,000 | $118 | 63 |
| 2636 Hereford St | 0.27mi | 4/2.5 (+1) | 1,873 (-10%) | 1mo | $205,000 | $109 | 63 |
| 5368 Odell St | 0.22mi | 4/3.5 (+1) | 2,300 (+11%) | 2mo | $549,900 | $239 | 63 |
| 2721 January Ave | 0.36mi | 3/3.0 | 2,357 (+13%) | 2mo | $600,000 | $255 | 59 |
| 5621 Botanical Ave | 0.35mi | 2/2.5 (-1) | 1,857 (-11%) | 0mo | $400,000 | $215 | 58 |
| 3215 Jasper Park | 0.63mi | 3/2.5 | 1,952 (-6%) | 0mo | $450,000 | $231 | 58 |
| 3285 Jasper Park | 0.74mi | 3/3.5 | 2,161 (+4%) | 2mo | $356,000 | $165 | 56 |
| 1719 Edwards St | 0.69mi | 4/2.0 (+1) | 1,900 (-9%) | 0mo | $175,000 | $92 | 44 |
Match score weights: distance 35% · size 25% · config 20% · recency 20%. Top-matched comps best support the ARV.
Projected returns pro-forma
-3.0% appreciation · 5.39% rent growth · sell at horizon
- IRR
- 2.8%
- Equity multiple
- 1.11×
- Total profit
- $6,784
- Equity at exit
- $32,803
- IRR
- 14.5%
- Equity multiple
- 2.30×
- Total profit
- $80,004
- Equity at exit
- $19,022
Cash invested: $61,600 (down + closing). Projections, not guarantees.
Landlord ↔ Tenant lean methodology
- Overall (STATE)
- 81 Strongly Landlord-Friendly
- State Missouri
- 81 Strongly Landlord-Friendly · R+10
- County
- — inherits STATE
- City
- — inherits STATE
ZIP-level market 63139
- Rents YoY
- 5.4%
- Active inventory
- 137
- Price-to-rent
- 7.0×
Monthly cashflow live
- Estimated rent
- $2,606 high interval (Pro) →
- Mortgage (P&I)
- −$1,154
- Tax from tax record
- −$249 /mo · $2,983/yr
- Insurance
- −$92
- HOA
- −$0
- Vacancy / Maint / Mgmt
- −$547
- Net cashflow
- $565
Break-even live
UW: 25.0% down · 7.5% · 30yr · 1.5% tax · 5.0% vac · 8.0% maint · 8.0% mgmt
Financing live
Cash to close
- Down payment
- $55,000
- Closing costs
- $6,600
- Reserves months
- —
- Total cash needed
- —
Loan-product check · same deal, 3 products live
Conventional
25% down · 7.5% · 30yr
- Down + closing
- —
- Monthly P&I
- —
- Monthly cashflow
- —
- DSCR
- —
- Eligible?
- —
Personal DTI + credit; lowest rate.
DSCR
20% down · 8.5% · 30yr
- Down + closing
- —
- Monthly P&I
- —
- Monthly cashflow
- —
- DSCR
- —
- Eligible?
- —
No personal income docs; deal must DSCR.
Hard money
10% down · 12.0% · 12mo
- Down + closing
- —
- Monthly P&I
- —
- Monthly cashflow
- —
- DSCR
- —
- Eligible?
- —
Short-term bridge; refi at stabilization.
Rent comps 14 comps
| Address | Beds | Baths | Sqft | Rent | $/sqft | DOM | Units | Dist |
|---|---|---|---|---|---|---|---|---|
| 5713 Parc Ridge Way Saint Louis, MO | 3.0 | 2.5 | 2430 | $2,625 | $1.08 | 44d | 1 | 0.49mi |
| 2734 59th St Saint Louis, MO | 3.0 | 2.5 | 2060 | $3,999 | $1.94 | 20d | 1 | 0.50mi |
| 2732 59th St Saint Louis, MO | 3.0 | 2.5 | 2060 | $3,999 | $1.94 | 20d | 1 | 0.52mi |
| 4609 Cleveland Ave St. Louis, MO | 3.0 | 2.5 | 1400 | $2,200 | $1.57 | 22d | 1 | 0.66mi |
| 6114 Columbia Ave Saint Louis, MO | 3.0 | 1.0 | 1600 | $1,850 | $1.16 | 23d | 1 | 0.79mi |
| 6020 Juniata St Saint Louis, MO | 4.0 | 2.0 | 1661 | $2,750 | $1.66 | 3d | 1 | 0.84mi |
| 2053 Alfred Ave St. Louis, MO | 4.0 | 3.0 | 1768 | $1,975 | $1.12 | 44d | 1 | 0.86mi |
| 3161 Alfred Ave St. Louis, MO | 2.0 | 1.0 | 1400 | $1,435 | $1.02 | 14d | 1 | 0.87mi |
| 6042 Hancock Ave Saint Louis, MO | 3.0 | 1.0 | 1400 | $3,500 | $2.50 | 23d | 1 | 1.13mi |
| 4228 Cleveland Ave Unit 1031486P St. Louis, MO | 4.0 | 1.0 | 1496 | $1,868 | $1.25 | 2d | 1 | 1.17mi |
| 4145-4147 Hartford St St. Louis, MO | 4.0 | 3.5 | 2400 | $3,800 | $1.58 | 12d | 1 | 1.18mi |
| 5700 Highlands Plaza Dr Saint Louis, MO | 3.0 | 1.0–2.0 | 1029 | $4,100 | $3.98 | 2d | 24 | 1.31mi |
| 5300 Bancroft Ave Unit A St. Louis, MO | 2.0 | 1.0 | 1404 | $1,295 | $0.92 | 23d | 1 | 1.40mi |
| 1401 Tower Grove Ave Saint Louis, MO | 1.0–2.0 | 1.0–3.0 | 1292 | $2,766 | $2.14 | 2d | 2 | 1.48mi |
Listing history 9 events
-
2026-06-02status $220,000 Pending 6 DOM
-
2026-06-01days on market $220,000 Active 6 DOM
-
2026-05-31days on market $220,000 Active 5 DOM
-
2026-05-22historical $220,000
-
2012-01-27soldstatus 777-char remark
Show marketing remark (777 chars)
Nice 2 story home in south city area. Show Today! Seller will make no repairs or provide any inspections or warranties. For faster response include lead paint disclosure, seller addendums (if required). Response time may be Special sale contract, proof of funds or preapproval, copy of earnest money, Seller will a week or more but usually less, please allow for this in the contract. Earnest money must be 3% if price or $1,000.00 whatever is higher made to seller escrow agent of choice-varies by seller, call listing agent for details (cashiers check, money order only). Must be delivered to listing agent within 24 hours of accepted offer. If multiply offer situation seller can accept or counter any offer they choose regardless the order presented, received or countered.
-
2011-10-18$54,900 777-char remark
Show marketing remark (777 chars)
Nice 2 story home in south city area. Show Today! Seller will make no repairs or provide any inspections or warranties. For faster response include lead paint disclosure, seller addendums (if required). Response time may be Special sale contract, proof of funds or preapproval, copy of earnest money, Seller will a week or more but usually less, please allow for this in the contract. Earnest money must be 3% if price or $1,000.00 whatever is higher made to seller escrow agent of choice-varies by seller, call listing agent for details (cashiers check, money order only). Must be delivered to listing agent within 24 hours of accepted offer. If multiply offer situation seller can accept or counter any offer they choose regardless the order presented, received or countered.
-
2005-07-18soldstatus $179,900
-
2000-04-12soldstatus $105,000
-
2000-04-10soldstatus $72,000
ⓘ Source: listings_history table (triggers on properties + properties_extension) + one-shot
backfill from property_details.listing_events for pre-trigger history.
Tax reassessment forecast MO · Resets to sale price
- Current annual tax
- $2,983 · $249/mo
- Projected year-2 tax
- $2,983 · $249/mo
- Expected delta
- $0/yr ($0/mo · 0.0%)
ⓘ Screening estimate from a state-policy table — verify with the county assessor before closing.
Climate risk First Street
- Flood 1/10 Low FEMA zone X (unshaded) · 0% chance over 30 yrs
- Wildfire 1/10 Low
- Heat 5/10 Major 7 d/yr ≥107°F today · 21 d/yr by 30 yrs out
- Wind 2/10 Low 100% chance of damaging wind over 30 yrs
- Air quality 3/10 Moderate 3 unhealthy d/yr today · 4 by 30 yrs out
Nearby sold comps map
Loading sold comps map…
Walkable amenities ~0.75 mi
Loading nearby amenities…
Taxation est. · year 1
- Rental income
- $31,278
- − Mortgage interest
- −$12,323
- − Property taxes
- −$2,983
- − Insurance
- −$1,100
- − Repairs & maintenance
- −$2,502
- − Management
- −$2,502
- − Depreciation
- −$6,400
- Taxable income
- $3,466
- Est. tax owed @ 24.0%
- −$832
- After-tax cash flow
- $5,950/yr
For passive investors: Depreciation is non-cash, so a rental often shows a tax loss while cash-flowing — sheltering income. Rental losses are passive: they offset passive income freely, and up to $25,000/yr can offset ordinary (W-2) income if you actively participate and your MAGI is under $100k (phasing out to $0 by $150k); unused losses carry forward. On sale, claimed depreciation is recaptured at up to 25%, and gains may owe capital-gains tax (a 1031 exchange can defer both). Figures are a year-1 estimate at your 24.0% rate — not tax advice; consult a CPA.
Schools (NCES district)
- District
- St. Louis City
- NCES district ID
- 2929280
- Math proficiency
- 10% ▼ -6.00%
- Reading proficiency
- 18% ▼ -3.00%
- Median HH income
- $35,685
- Composite
- 11.54/100
- National rank
- #9699
- State rank
- #312 of 324 in MO
Livability — St. Louis
No livability data for this city. (Only ~50 U.S. cities are tracked.)
Census & demographics
- Census place
- St. Louis, MO
- County
- Saint Louis City · 254,015 people
- City population
- 283,259
- Metro
- St. Louis, MO-IL
- Population (ZIP)
- 21,631
- Household income
- $75,757
- Rent vs Own
- Severe rent burden
- 653.0
Population outlook (St. Louis County) Hauer SSP2
- Today (2025)
- 315,737 people
- By 2030
- 313,865 · -0.6%
- By 2040
- 305,439 · -3.3%
- By 2050
- 296,529 · -6.1%
- By 2075
- 271,028 · -14.2%
- By 2100
- 255,359 · -19.1%
Race, ethnicity, and origin ACS 2023
- Neighborhood character
- Predominantly White (70%)
- Race & ethnicity
- White 70% Black 16% Two or more races 7% Hispanic / Latino 5% Asian 3%
- Hispanic origin (detail)
- Mexican 3%
- Common ancestry
- Lithuanian 4% Slovak 2% Romanian 2%
- Foreign-born
- 5% · Canada, China
- Languages at home
- 93% English-only · Spanish 2% Other Indo-European 1% German/W. Germanic 1%
Political lean MEDSL · St. Louis
- 2024 margin
- Solid D (+64.7) · D 81.4% · R 16.7% · Other 2.0%
- 2008→2024 swing
- -3.5pp toward R · 2008: 68.2pp · 2024: 64.7pp
- All cycles
- 2024: D+64.7 2020: D+66.2 2016: D+63.7 2012: D+66.6 2008: D+68.2
Not yet ingested
- Civics
- —
Market trends
- HPI YoY
- ▼ -277.54%
- Current HPI
- 256.7513
- Rent YoY
- ▲ 5.39%
- Metro
- St. Louis, MO-IL
- State GDP YoY
- ▲ 1.84%
- F500 in state
- 20
Industry mix (Fortune 500 HQ in MO)
| Industry | F500 HQs | Revenue |
|---|---|---|
| Healthcare | 1 | $163B |
|
||
| Insurance | 1 | $21B |
|
||
| Industrial Technology | 1 | $17B |
|
||
| Retail | 1 | $16B |
|
||
| Industrial Distribution | 1 | $10B |
|
||
| Utilities | 1 | $9B |
|
||
Price history
+205.6% since first listed6 events — show timeline
- 2026-05-22 Coming Soon $220,000 MARIS as Distributed by MLS Grid
- 2012-01-27 Sold (MLS) — MARIS as Distributed by MLS Grid
- 2011-10-18 Listed $54,900 MARIS as Distributed by MLS Grid
- 2005-07-18 Sold (Public Records) $179,900 Public Records
- 2000-04-12 Sold (Public Records) $105,000 Public Records
- 2000-04-10 Sold (Public Records) $72,000 Public Records
Property tax history
+8.3%/yrLatest (2023): $2,983 · +7.4% YoY. Source: county tax records.
Cash-flow waterfall
monthlySold comps — $/sqft
last 12 mo · ≤1 miLoading sold comps…