11390 Oak Leaf Cir · Lost Bridge Village, AR
Flood risk 1/10 · Minimal
- FEMA flood zone
- X (unshaded)
- Chance of flooding over 30 yrs
- 0.0%
- Est. flood insurance / yr
- $473 – $860
Fire risk 2/10 · Minimal
- Est. fire insurance / yr
- $1,499 – $2,785
Heat risk 4/10 · Minor
- Hot days now (above 105°F)
- 7 days/yr
- Hot days in 30 yrs
- 21 days/yr
Wind risk 2/10 · Minimal
- Chance of severe wind over 30 yrs
- 2.0%
Air-quality risk 1/10 · Minimal
- Unhealthy air days now
- 0 days/yr
- Unhealthy air days in 30 yrs
- 0 days/yr
Risk factors via First Street. Map © Google.
Why this score? — see what drove the C- grade
The composite is a weighted blend of 9 inputs, each scored 0–100. Each bar is that input's sub-score; the figure is the points it added to the 100-point composite (weight × sub-score).
- Cash flow +14.8/30.0
- Appreciation +8.8/10.0
- ARV discount +8.3/15.0
- DSCR +4.5/10.0
- Schools +3.9/10.0
- 1% rule +3.0/10.0
- Livability +2.9/5.0
- Rent growth +2.5/5.0
- Condition / age +2.5/5.0
$650,000
🖨 Deal sheet (PDF) 📄 Offer letter ✓ Due diligence
Listing remarks
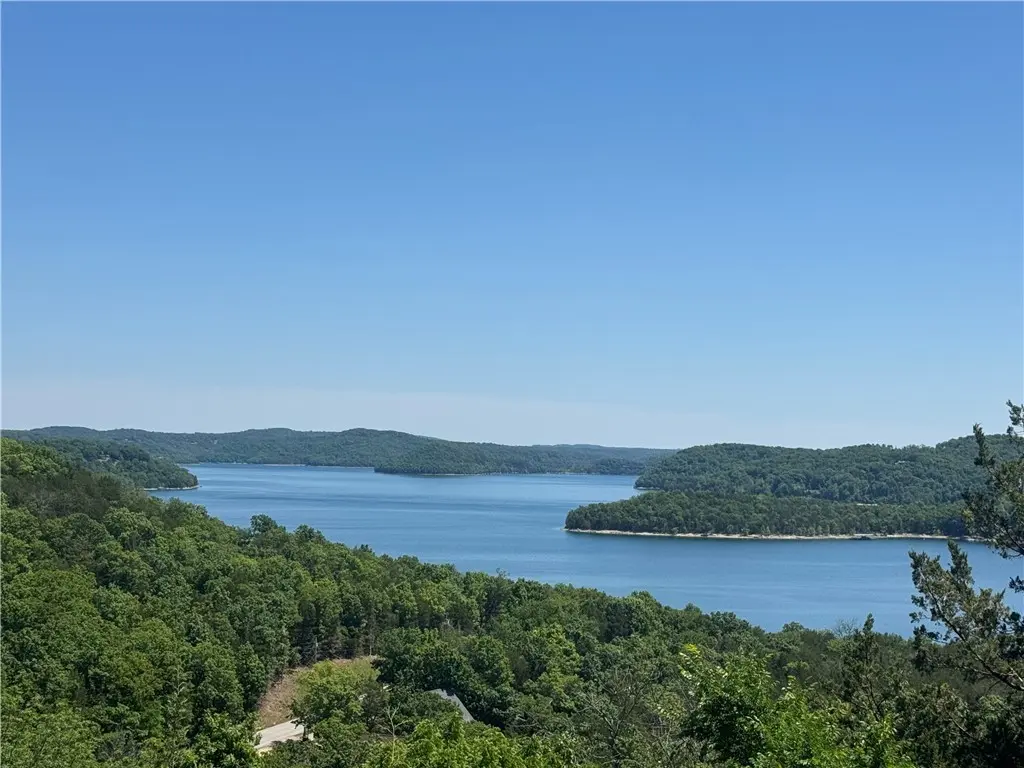
Enjoy breathtaking views of Beaver Lake from this spacious 4-bedroom, 2.5-bath home in Lost Bridge Village. Designed for relaxing and entertaining, the home features a huge upper deck plus a lower-level deck, offering plenty of space to take in the lake scenery year-round. Inside, the living area showcases beautiful wood ceilings and a stunning double-sided stone fireplace shared with the primary bedroom, creating warmth and character throughout. The lower-level game room provides the perfect spot for gatherings, pool games or leisure. A 2-car garage adds convenience, while most furnishings are negotiable with an acceptable offer, making this an excellent opportunity for a turnkey lake-area
Key facts
- Breathtaking views
- Pickleball courts
- Community pool
Tags
Property features AI
Finance
- HOA & community: Part of Lost Bridge Village community; Annual association fee of $240; Community amenities include recreation area, tennis courts, lake access, and pool
Exterior
- Parking: Attached garage; One covered garage space
- Utilities: Electricity available; Phone available; Public water; Public sewer
- Home design: Two-story home; Residential property; Slab foundation; Architectural shingle roof; Cedar construction
- Construction: Built with cedar siding; Architectural shingle roof; Slab foundation
- Exterior features: Deck; Porch; Gravel driveway; Views; Wooded lot; Outside city limits; Subdivision setting; Community pool; Access to Beaver Lake
Interior
- Kitchen: Dishwasher; Electric cooktop; Disposal; Refrigerator; Electric water heater
- Bedrooms: Multiple bedrooms including rooms located in the basement and on the main level
- Flooring: Carpet; Vinyl
- Bathrooms: Two full bathrooms; One half bathroom
- Heating & cooling: Central heating (electric, heat pump); Central electric air conditioning
- Interior features: Ceiling fans; Cathedral ceilings; Walk-in closets; Metal windows
- Laundry & utility: Washer hookup; Dryer hookup; Finished basement utility area
Neighborhood map
What this means for you Summary
Snapshot
- This is a 4-bed/2.5-bath single-family listed at $650k.
Deal economics
- At list price, monthly cash flow is $176 ($2k/yr) — positive.
- The deal already cash-flows at list — no discount required.
- To meet the 1% rule (rent ≥ 1% of price), the offer needs to be $518k (20.2% below list).
- Recommended offer: $518k (20.2% below list) — sets the bar for 1% rule.
- Cap rate 6.6% vs local median 2.8% in Lost Bridge Village — top-decile yield for the area; either an underpriced asset or a hidden risk that comps aren't pricing in. Stress-test before assuming the spread holds.
Location & tenants
- Location reads 57/100 on livability (#348 in AR) — a working-class tenant base; expect higher turnover. Strengths: housing A+, crime B+, employment B; Watch: cost of living C-, amenities F, commute F.
- Rogers School District (urban): math 45% / reading 45% proficiency, ranked #31 of 238 in AR (top 13%) — families likely to look elsewhere, expect single-tenant / working-renter base with shorter leases.
- Zoned schools: Garfield Elementary School (math 44% / reading 44%, grade F, #143 of 454 statewide, top 36%, 106 students, 68% FRL); Lingle Middle School (math 45% / reading 48%, grade D+, #49 of 201 statewide, top 26%, 766 students, 56% FRL); Rogers Heritage High School (math 25% / reading 35%, grade F, #138 of 292 statewide, top 48%, 2,080 students, 48% FRL).
- Market conditions: 130 active listings in the ZIP; 1 comparable units currently listed for rent nearby; 4,359 units permitted in Benton County in 2024 (402 in 5+ unit buildings).
Forward outlook
- In year one you build about $54k of equity ($4k loan paydown + $49k appreciation (7.6% local appreciation)).
- Benton County population projected at +56% by 2050 — long-run rental-demand tailwind backs the buy-and-hold thesis.
- At projected returns (7.6% appreciation + 3.0% rent growth), your $182k cash investment doubles in ~3 years — after that, you're playing with house money.
- By year 2, paydown + projected appreciation supports a ~$86k cash-out refi (75% LTV) — recoverable capital for the next deal without selling this one.
Negotiation context
- It's been on market 45 days — a 3% lower offer ($630k) is reasonable based on typical stale-listing flexibility.
Questions for the listing agent
- It's been on market 45 days. Have you received any prior offers? Is the seller open to a 20% concession, seller financing, or rate buy-down credit?
- What does the HOA fee cover, when was the last increase, and are there any pending special assessments or reserve-fund shortfalls?
- Is there a deadline driving the sale (1031 exchange, divorce, estate, relocation)? That informs how much negotiation room exists.
- Schools are F-rated, which usually means shorter tenancies and higher turnover. Who's the typical renter profile here, and what's been the actual vacancy rate?
- What's the average days-on-market for RENTAL listings here right now (not sales)? A rising rental-DOM trend means longer vacancies and softer asking-rent achievability than the comps imply.
- What's the recent tenant-quality profile in this submarket — average credit score on applications, eviction rate, late-payment / NSF rate, and stable-employment percentage? A property-management company in the area should have these aggregated.
- How much new for-sale + rental construction is in the pipeline within 1–3 miles? Heavy new supply typically softens prices + rents 12–24 months out; constrained supply supports both.
Investment metrics
- 1% rule
- 0.80% ✗
- Cap rate
- 6.62%
- Cash-on-cash
- 1.16%
- DSCR
- 1.05
- GRM
- 10.4
CMA / ARV
- ARV (on-the-fly)
- $661,248
- Comps found
- 4
Show comp detail 4 sales within ~0.75 mi
| Address | Dist | Beds/Ba | Sqft | Sold | Price | $/sf | Match |
|---|---|---|---|---|---|---|---|
| 21299 Black Oak Dr | 0.16mi | 3/3.0 (-1) | 2,372 (+3%) | 3mo | $675,000 | $285 | 78 |
| 21393 Black Oak Dr | 0.30mi | 4/2.5 | 2,240 (-3%) | 13mo | $880,000 | $393 | 70 |
| 11435 Oak Leaf Cir | 0.15mi | 3/2.5 (-1) | 2,140 (-7%) | 22mo | $615,000 | $287 | 58 |
| 11418 Country Club Dr | 0.21mi | 3/2.0 (-1) | 2,004 (-13%) | 6mo | $495,000 | $247 | 57 |
Match score weights: distance 35% · size 25% · config 20% · recency 20%. Top-matched comps best support the ARV.
Projected returns pro-forma
7.61% appreciation · 3.0% rent growth · sell at horizon
- IRR
- 20.0%
- Equity multiple
- 2.44×
- Total profit
- $262,492
- Equity at exit
- $476,565
- IRR
- 18.7%
- Equity multiple
- 5.13×
- Total profit
- $752,508
- Equity at exit
- $929,977
Cash invested: $182,000 (down + closing). Projections, not guarantees.
Landlord ↔ Tenant lean methodology
- Overall (STATE)
- 92 Strongly Landlord-Friendly
- State Arkansas
- 92 Strongly Landlord-Friendly · R+14
- County
- — inherits STATE
- City
- — inherits STATE
ZIP-level market 72732
- Home prices YoY
- 2.1%
- Active inventory
- 130
- Price-to-rent
- 10.4×
Monthly cashflow live
- Estimated rent
- $5,184 medium interval (Pro) →
- Mortgage (P&I)
- −$3,409
- Tax from tax record
- −$220 /mo · $2,636/yr
- Insurance
- −$271
- HOA
- −$20
- Lot rent
- −$0
- Vacancy / Maint / Mgmt
- −$1,089
- Net cashflow
- $176
Break-even live
Sensitivity live
| Price | -10% $544 | -5% $360 | +0% $176 | +5% $-8 | +10% $-192 |
|---|---|---|---|---|---|
| Rent | -10% $-233 | -5% $-29 | +0% $176 | +5% $381 | +10% $586 |
| Rate | -1.0pp $504 | -0.5pp $342 | base $176 | +0.5pp $8 | +1.0pp $-164 |
UW: 25.0% down · 7.5% · 30yr · 1.5% tax · 5.0% vac · 8.0% maint · 8.0% mgmt
Financing live
Cash to close
- Down payment
- $162,500
- Closing costs
- $19,500
- Reserves months
- —
- Total cash needed
- —
Loan-product check · same deal, 3 products live
Conventional
25% down · 7.5% · 30yr
- Down + closing
- —
- Monthly P&I
- —
- Monthly cashflow
- —
- DSCR
- —
- Eligible?
- —
Personal DTI + credit; lowest rate.
DSCR
20% down · 8.5% · 30yr
- Down + closing
- —
- Monthly P&I
- —
- Monthly cashflow
- —
- DSCR
- —
- Eligible?
- —
No personal income docs; deal must DSCR.
Hard money
10% down · 12.0% · 12mo
- Down + closing
- —
- Monthly P&I
- —
- Monthly cashflow
- —
- DSCR
- —
- Eligible?
- —
Short-term bridge; refi at stabilization.
Rent comps 1 comps
| Address | Beds | Baths | Sqft | Rent | $/sqft | DOM | Units | Dist |
|---|---|---|---|---|---|---|---|---|
| 12310 Slate Gap Rd Unit 1221931P Garfield, AR | 4.0 | 2.5 | 2798 | $5,184 | $1.85 | 16d | 1 | 1.19mi |
HOA detail
- Monthly dues
- $20 · $240/yr
- Likely covers
- pool
Listing history 19 events
-
2026-06-23days on market $650,000 Active 45 DOM
-
2026-06-21days on market $650,000 Active 44 DOM
-
2026-06-18days on market $650,000 Active 41 DOM
-
2026-06-17days on market $650,000 Active 40 DOM
-
2026-06-16days on market $650,000 Active 39 DOM
-
2026-06-15days on market $650,000 Active 38 DOM
-
2026-06-14days on market $650,000 Active 36 DOM
-
2026-06-13days on market $650,000 Active 35 DOM
-
2026-06-10days on market $650,000 Active 33 DOM
-
2026-06-09days on market $650,000 Active 32 DOM
-
2026-06-08days on market $650,000 Active 31 DOM
-
2026-06-07days on market $650,000 Active 30 DOM
-
2026-06-05days on market $650,000 Active 27 DOM
-
2026-06-03days on market $650,000 Active 26 DOM
-
2026-06-02days on market $650,000 Active 25 DOM
-
2026-06-01days on market $650,000 Active 24 DOM
-
2026-05-31days on market $650,000 Active 23 DOM
-
2026-05-31days on market $650,000 Active 22 DOM
-
2026-05-08$650,000 Active
ⓘ Source: listings_history table (triggers on properties + properties_extension) + one-shot
backfill from property_details.listing_events for pre-trigger history.
Tax reassessment forecast AR · Resets to sale price
- Current annual tax
- $2,636 · $220/mo
- Projected year-2 tax
- $4,160 · $347/mo
- Expected delta
- +$1,524/yr (+$127/mo · 57.8%)
ⓘ Screening estimate from a state-policy table — verify with the county assessor before closing.
Climate risk First Street
- Flood 1/10 Low FEMA zone X (unshaded) · 0% chance over 30 yrs
- Wildfire 2/10 Low
- Heat 4/10 Moderate 7 d/yr ≥105°F today · 21 d/yr by 30 yrs out
- Wind 2/10 Low 2% chance of damaging wind over 30 yrs
- Air quality 1/10 Low 0 unhealthy d/yr today · 0 by 30 yrs out
Nearby sold comps map
Loading sold comps map…
Walkable amenities ~0.75 mi
Loading nearby amenities…
Taxation est. · year 1
- Rental income
- $62,208
- − Mortgage interest
- −$36,410
- − Property taxes
- −$2,636
- − Insurance
- −$3,250
- − Repairs & maintenance
- −$4,977
- − Management
- −$4,977
- − HOA
- −$240
- − Depreciation
- −$18,909
- Taxable loss
- −$9,190
- Est. tax savings @ 24.0%
- +$2,206
- After-tax cash flow
- $4,320/yr
For passive investors: Depreciation is non-cash, so a rental often shows a tax loss while cash-flowing — sheltering income. Rental losses are passive: they offset passive income freely, and up to $25,000/yr can offset ordinary (W-2) income if you actively participate and your MAGI is under $100k (phasing out to $0 by $150k); unused losses carry forward. On sale, claimed depreciation is recaptured at up to 25%, and gains may owe capital-gains tax (a 1031 exchange can defer both). Figures are a year-1 estimate at your 24.0% rate — not tax advice; consult a CPA.
Schools (NCES district)
- District
- Rogers School District
- NCES district ID
- 0511970
- Math proficiency
- 45% ▼ -9.00%
- Reading proficiency
- 45% ▼ -9.00%
- Median HH income
- $51,712
- Composite
- 38.81/100
- National rank
- #4113
- State rank
- #31 of 238 in AR
Livability — Lost Bridge Village
- Score
- 57/100
- State rank
- #348
- US rank
- #21912
Category grades
Schools grade is shown separately in the Schools card above.
Census & demographics
- Census place
- Lost Bridge Village, AR
- Population (ZIP)
- 5,493
Population outlook (Benton County) Hauer SSP2
- Today (2025)
- 318,683 people
- By 2030
- 353,481 · +10.9%
- By 2040
- 425,280 · +33.4%
- By 2050
- 497,239 · +56.0%
- By 2075
- 662,114 · +107.8%
- By 2100
- 776,431 · +143.6%
Race, ethnicity, and origin ACS 2023
- Neighborhood character
- Diverse neighborhood (Simpson 0.56)
- Race & ethnicity
- White 65% Two or more races 27% Hispanic / Latino 11% Native American 1%
- Hispanic origin (detail)
- Mexican 7%
- Common ancestry
- Italian 3% Danish 2% Lithuanian 1%
- Foreign-born
- 3% · Canada
- Languages at home
- 97% English-only · Spanish 3%
Political lean MEDSL · Benton
- 2024 margin
- Strong R (+27.0) · D 35.2% · R 62.1% · Other 2.7%
- 2008→2024 swing
- +9.6pp toward D · 2008: -36.5pp · 2024: -27.0pp
- All cycles
- 2024: R+27.0 2020: R+26.4 2016: R+34.9 2012: R+40.4 2008: R+36.5
Not yet ingested
- Civics
- —
Market trends
- HPI YoY
- ▲ 7.61%
- Current HPI
- 368.3932
- Rent YoY
- —
- Metro
- —
- State GDP YoY
- ▲ 3.80%
- F500 in state
- 10
Industry mix (Fortune 500 HQ in AR)
| Industry | F500 HQs | Revenue |
|---|---|---|
| Retail | 1 | $681B |
|
||
| Food / Agriculture | 1 | $53B |
|
||
| Retail / Energy | 1 | $22B |
|
||
| Transportation / Logistics | 1 | $12B |
|
||
| Energy | 1 | $4B |
|
||
Price history
1 event — show timeline
- 2026-05-08 Listed $650,000 NWARMLS
Property tax history
+1.6%/yrLatest (2025): $2,636 · +7.5% YoY. Source: county tax records.
Cash-flow waterfall
monthlySold comps — $/sqft
last 12 mo · ≤1 miLoading sold comps…