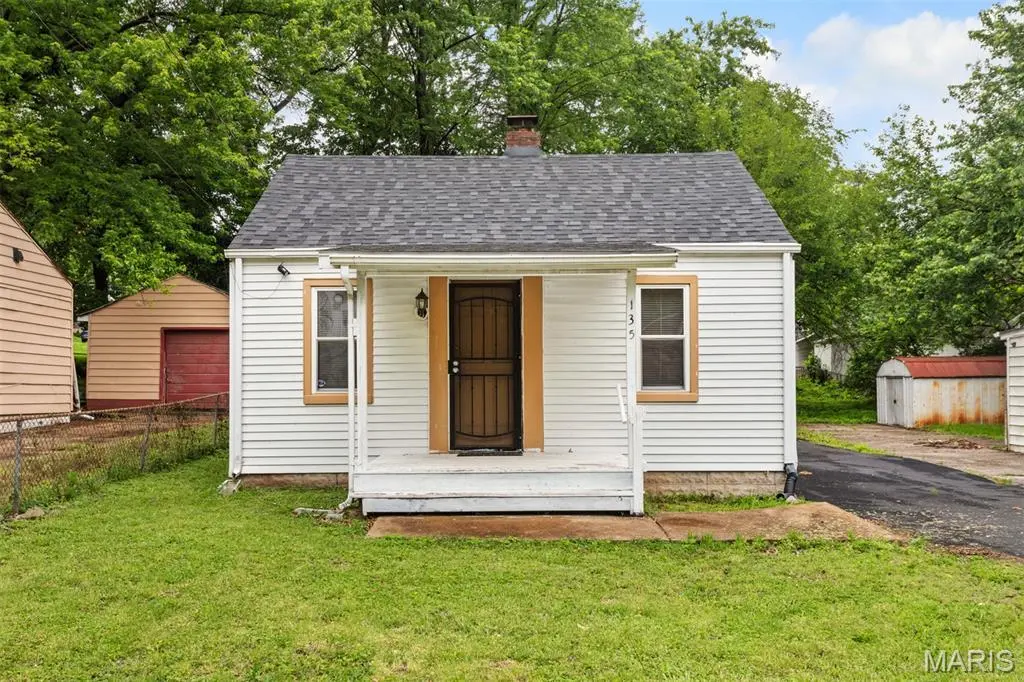
135 Grether Ave · Hazelwood, MO
Flood risk 1/10 · Minimal
- FEMA flood zone
- X (unshaded)
- Chance of flooding over 30 yrs
- 0.0%
- Est. flood insurance / yr
- $507 – $1,088
Fire risk 1/10 · Minimal
- Est. fire insurance / yr
- $1,054 – $1,958
Heat risk 4/10 · Minor
- Hot days now (above 106°F)
- 7 days/yr
- Hot days in 30 yrs
- 20 days/yr
Wind risk 2/10 · Minimal
- Chance of severe wind over 30 yrs
- 1.0%
Air-quality risk 3/10 · Minor
- Unhealthy air days now
- 3 days/yr
- Unhealthy air days in 30 yrs
- 5 days/yr
Risk factors via First Street. Map © Google.
Why this score? — see what drove the C+ grade
The composite is a weighted blend of 9 inputs, each scored 0–100. Each bar is that input's sub-score; the figure is the points it added to the 100-point composite (weight × sub-score).
- Cash flow +30.0/30.0
- DSCR +10.0/10.0
- 1% rule +9.8/10.0
- Rent growth +4.8/5.0
- Livability +3.1/5.0
- ARV discount +2.6/15.0
- Condition / age +2.5/5.0
- Schools +1.2/10.0
- Appreciation +0.0/10.0
$87,000
🖨 Deal sheet 📄 Offer letter ✓ Due diligence
Listing remarks
Adorable 2 bedroom, 1 bathroom move-in ready home! This home welcomes you into the living room space boasting tons of cozy vibes with the neutral tones throughout. The eat-in kitchen is complete with plenty of cabinets and counter space for all your storage needs. A convenient full bathroom is located just right past the kitchen with a pedestal sink, full tub/shower combo and built in shelving. One bedroom is located to the right of the living room, which could also be used as a home office, library or den. The second bedroom has been nicely renovated with a vaulted ceiling, track lighting and tons of windows bringing in natural light. There is a large walk-in closet offering tons of space.
Key facts
- Large patio area
- Eat-in kitchen
- Large walk-in closet
Tags
Property features AI
Exterior
- Parking: Driveway
- Utilities: Public water; Public sewer; Electric service by Ameren; Cable available
- Home design: Single family residence; One level (one story)
- Construction: Vinyl siding
- Exterior features: Covered front porch; Patio; Front and back yard; Level lot
Interior
- Kitchen: Gas oven; Gas range; Refrigerator
- Bedrooms: 2 bedrooms (both on the main level)
- Flooring: Carpet
- Bathrooms: 1 full bathroom (main level)
- Heating & cooling: Forced air heating (natural gas); Central air conditioning
- Interior features: Eat-in kitchen; Vaulted ceilings; Walk-in closet(s)
- Laundry & utility: Laundry on the main level; Water heater
Neighborhood map
What this means for you Summary
Snapshot
- This is a 2-bed/1.0-bath single-family listed at $87k.
Deal economics
- At list price, monthly cash flow is $481 ($6k/yr) — positive.
- The deal already cash-flows at list — no discount required.
- Meets the 1% rule at list price ($1k rent vs $87k).
- Recommended offer: $84k (3.0% below list) — sets the bar for market timing.
- Cap rate 12.9% vs local median 7.2% in Hazelwood — top-decile yield for the area; either an underpriced asset or a hidden risk that comps aren't pricing in. Stress-test before assuming the spread holds.
Location & tenants
- Location reads 62/100 on livability (#395 in MO) — a middle-class / working-renter tenant base. Strengths: cost of living A+, housing A+; Watch: crime F, amenities F, commute F.
- Ferguson-Florissant R-II (suburban): math 7% / reading 20% proficiency, ranked #311 of 324 in MO (top 96%) — low school quality limits family demand, transient renter base, plan for 1-2y turnover; 70% free/reduced lunch — lower-income household profile, screen leases tightly.
- Zoned schools: Walnut Grove Elem. (342 students, 99% FRL); Mccluer High (math 0% / reading 17%, grade F, #511 of 521 statewide, top 98%, 1,181 students, 100% FRL) — zoned schools average 99% FRL vs 70% district-wide (30 pts higher); higher-poverty schools than district average — tighter screening recommended.
- Market conditions: Rents rising fast (+9.0%/yr); 162 active listings in the ZIP; 40 comparable units currently listed for rent nearby; rentals at typical pace (median 24d on market — plan ~3-4 weeks tenant-placement turnaround); 920 units permitted in St. Louis County in 2024 (250 in 5+ unit buildings).
Forward outlook
- Local home prices are declining (-3.0%/yr); year-one equity from $601 of loan paydown is wiped out by about $3k of value loss. Plan a longer hold.
- At projected returns (-3.0% appreciation + 8.0% rent growth), your $24k cash investment doubles in ~5 years — after that, you're playing with house money.
Negotiation context
- It's been on market 42 days — a 3% lower offer ($84k) is reasonable based on typical stale-listing flexibility.
- 3 sale attempts with the ask held roughly flat each time — persistent listings suggest the price (not the market) is what's stuck; bring a comps-based counter.
Risks & watch-outs
- Watch-outs: built in 1930 — expect roof / HVAC / electrical / plumbing capex.
Questions for the listing agent
- It's been on market 42 days. Have you received any prior offers? Is the seller open to a 3% concession, seller financing, or rate buy-down credit?
- Built in 1930 — when were the roof, HVAC, electrical panel, plumbing, and water heater last replaced?
- Is there a deadline driving the sale (1031 exchange, divorce, estate, relocation)? That informs how much negotiation room exists.
- Schools are D-rated, which usually means shorter tenancies and higher turnover. Who's the typical renter profile here, and what's been the actual vacancy rate?
- Crime grade is F in this area — have there been break-ins, vandalism, or insurance claims at this property in the last 3 years? What carrier currently insures it and at what premium?
- What's the average days-on-market for RENTAL listings here right now (not sales)? A rising rental-DOM trend means longer vacancies and softer asking-rent achievability than the comps imply.
- What's the recent tenant-quality profile in this submarket — average credit score on applications, eviction rate, late-payment / NSF rate, and stable-employment percentage? A property-management company in the area should have these aggregated.
- How much new for-sale + rental construction is in the pipeline within 1–3 miles? Heavy new supply typically softens prices + rents 12–24 months out; constrained supply supports both.
Investment metrics
- 1% rule
- 1.48% ✓
- Cap rate
- 12.93%
- Cash-on-cash
- 23.69%
- DSCR
- 2.05
- GRM
- 5.6
CMA / ARV
- ARV (median comp)
- $78,393
- List price
- $87,000
- Delta
- 10.98%
- Verdict
- OVERPRICED
- Comps
- 20 within 1.0 mi
Show comp detail 12 sales within ~0.75 mi
| Address | Dist | Beds/Ba | Sqft | Sold | Price | $/sf | Match |
|---|---|---|---|---|---|---|---|
| 116 Grether Ave | 0.07mi | 3/1.0 (+1) | 936 (-5%) | 1mo | $109,900 | $117 | 83 |
| 6637 Torlina Dr | 0.36mi | 3/1.0 (+1) | 960 (-3%) | 2mo | $109,900 | $114 | 73 |
| 201 Becker Dr | 0.49mi | 3/1.0 (+1) | 962 (-2%) | 2mo | $130,000 | $135 | 67 |
| 258 Williams Blvd | 0.31mi | 3/1.0 (+1) | 1,075 (+9%) | 0mo | $129,900 | $121 | 65 |
| 1825 S New Florissant Rd | 0.59mi | 2/1.0 | 1,029 (+4%) | 2mo | $125,000 | $121 | 64 |
| 211 Frost Ave | 0.38mi | 3/1.0 (+1) | 1,066 (+8%) | 2mo | $84,900 | $80 | 62 |
| 6717 Thurston Ave | 0.28mi | 2/1.0 | 840 (-15%) | 2mo | $60,000 | $71 | 61 |
| 233 Buddie Ave | 0.41mi | 2/1.0 | 862 (-13%) | 0mo | $74,900 | $87 | 60 |
| 8379 Midwood Ave | 0.59mi | 2/1.0 | 1,052 (+7%) | 2mo | $89,900 | $85 | 60 |
| 8302 Woodhurst Dr | 0.43mi | 3/1.0 (+1) | 1,120 (+14%) | 1mo | $99,900 | $89 | 52 |
| 2100 Argo Dr | 0.50mi | 3/2.0 (+1) | 1,088 (+10%) | 1mo | $189,500 | $174 | 50 |
| 8301 Pepperidge Dr | 0.62mi | 3/1.0 (+1) | 1,120 (+14%) | 1mo | $139,900 | $125 | 43 |
Match score weights: distance 35% · size 25% · config 20% · recency 20%. Top-matched comps best support the ARV.
Projected returns pro-forma
-3.0% appreciation · 8.0% rent growth · sell at horizon
- IRR
- 22.0%
- Equity multiple
- 1.96×
- Total profit
- $23,305
- Equity at exit
- $12,972
- IRR
- 33.0%
- Equity multiple
- 4.72×
- Total profit
- $90,578
- Equity at exit
- $7,522
Cash invested: $24,360 (down + closing). Projections, not guarantees.
Landlord ↔ Tenant lean methodology
- Overall (STATE)
- 81 Strongly Landlord-Friendly
- State Missouri
- 81 Strongly Landlord-Friendly · R+10
- County
- — inherits STATE
- City
- — inherits STATE
ZIP-level market 63135
- Rents YoY
- 9.0%
- Active inventory
- 162
- Price-to-rent
- 5.6×
Monthly cashflow live
- Estimated rent
- $1,286 high interval (Pro) →
- Mortgage (P&I)
- −$456
- Tax from tax record
- −$43 /mo · $511/yr
- Insurance
- −$36
- HOA
- −$0
- Vacancy / Maint / Mgmt
- −$270
- Net cashflow
- $481
Break-even live
UW: 25.0% down · 7.5% · 30yr · 1.5% tax · 5.0% vac · 8.0% maint · 8.0% mgmt
Financing live
Cash to close
- Down payment
- $21,750
- Closing costs
- $2,610
- Reserves months
- —
- Total cash needed
- —
Loan-product check · same deal, 3 products live
Conventional
25% down · 7.5% · 30yr
- Down + closing
- —
- Monthly P&I
- —
- Monthly cashflow
- —
- DSCR
- —
- Eligible?
- —
Personal DTI + credit; lowest rate.
DSCR
20% down · 8.5% · 30yr
- Down + closing
- —
- Monthly P&I
- —
- Monthly cashflow
- —
- DSCR
- —
- Eligible?
- —
No personal income docs; deal must DSCR.
Hard money
10% down · 12.0% · 12mo
- Down + closing
- —
- Monthly P&I
- —
- Monthly cashflow
- —
- DSCR
- —
- Eligible?
- —
Short-term bridge; refi at stabilization.
Rent comps 40 comps
| Address | Beds | Baths | Sqft | Rent | $/sqft | DOM | Units | Dist |
|---|---|---|---|---|---|---|---|---|
| 153 Bascom Dr Saint Louis, MO | 3.0 | 1.0 | 1076 | $1,195 | $1.11 | 19d | 1 | 0.14mi |
| 24 Vierling Dr Saint Louis, MO | 2.0 | 1.0 | 850 | $1,290 | $1.52 | 7d | 1 | 0.18mi |
| 171 Elbring Dr Saint Louis, MO | 3.0 | 1.5 | 1008 | $1,395 | $1.38 | 12d | 1 | 0.19mi |
| 46 Bascom Dr Saint Louis, MO | 2.0 | 1.0 | 932 | $1,175 | $1.26 | 43d | 1 | 0.21mi |
| 1275 N Florissant Rd Saint Louis, MO | 2.0 | 1.0 | 1008 | $1,275 | $1.26 | 23d | 1 | 0.29mi |
| 107 Anistasia Dr Saint Louis, MO | 2.0 | 2.0 | 1030 | $1,400 | $1.36 | 23d | 1 | 0.31mi |
| 6625 Thurston Ave Saint Louis, MO | 2.0 | 1.0 | 939 | $1,300 | $1.38 | 43d | 1 | 0.38mi |
| 6625 Thurston Ave Saint Louis, MO | 2.0 | 1.0 | 939 | $1,400 | $1.49 | 23d | 1 | 0.38mi |
| 11 Anistasia Dr Saint Louis, MO | 3.0 | 1.5 | 1120 | $1,345 | $1.20 | 23d | 1 | 0.39mi |
| 260 Sadonia Ave Saint Louis, MO | 3.0 | 2.0 | 1088 | $1,623 | $1.49 | 20d | 1 | 0.42mi |
| 204 Flora Dr Saint Louis, MO | 1.0 | 1.0 | 760 | $850 | $1.12 | 7d | 1 | 0.44mi |
| 263 Sadonia Ave Saint Louis, MO | 3.0 | 2.0 | 888 | $1,350 | $1.52 | 43d | 1 | 0.44mi |
| 36 Connolly Dr Saint Louis, MO | 3.0 | 1.0 | 1024 | $1,149 | $1.12 | 23d | 1 | 0.48mi |
| 8330 Woodhurst Dr Saint Louis, MO | 3.0 | 1.0 | 1120 | $1,000 | $0.89 | 7d | 1 | 0.51mi |
| 241 Flora Dr Saint Louis, MO | 2.0 | 1.0 | 703 | $1,075 | $1.53 | 23d | 1 | 0.52mi |
| 24 Barto Dr Saint Louis, MO | 3.0 | 1.0 | 864 | $1,400 | $1.62 | 43d | 1 | 0.53mi |
| 7025 Richwood Ln Hazelwood, MO | 3.0 | 1.0 | 936 | $1,375 | $1.47 | 17d | 1 | 0.58mi |
| 221 Barto Dr Saint Louis, MO | 3.0 | 2.0 | 958 | $1,295 | $1.35 | 20d | 1 | 0.62mi |
| 220 Du Bourg Ln Florissant, MO | 2.0 | 1.0 | 816 | $1,150 | $1.41 | 43d | 1 | 0.67mi |
| 6333 Peurifoy Ave Saint Louis, MO | 3.0 | 2.0 | 840 | $1,295 | $1.54 | 23d | 1 | 0.78mi |
| 1465 W Duchesne Dr Florissant, MO | 3.0 | 1.0 | 896 | $1,500 | $1.67 | 43d | 1 | 0.88mi |
| 6336 Washington Ave Berkeley, MO | 2.0 | 1.0 | 720 | $1,175 | $1.63 | 43d | 1 | 0.90mi |
| 6334 Washington Ave Berkeley, MO | 3.0 | 1.0 | 864 | $1,100 | $1.27 | 4d | 1 | 0.90mi |
| 222 Henquin Dr Saint Louis, MO | 2.0 | 1.0 | 816 | $1,050 | $1.29 | 17d | 1 | 0.95mi |
| 6315 Washington Ave Berkeley, MO | 2.0 | 1.0 | 739 | $1,175 | $1.59 | 16d | 1 | 0.95mi |
| 6132 Eaton Dr Saint Louis, MO | 2.0 | 1.0 | 792 | $1,125 | $1.42 | 23d | 1 | 0.99mi |
| 6156 Wulff Dr Saint Louis, MO | 3.0 | 2.0 | 960 | $1,425 | $1.48 | 10d | 1 | 1.00mi |
| 6214 Jefferson Ave Saint Louis, MO | 2.0 | 1.0 | 816 | $1,195 | $1.46 | 23d | 1 | 1.03mi |
| 1180 S New Florissant Rd Florissant, MO | 3.0 | 1.0 | 925 | $1,225 | $1.32 | 23d | 1 | 1.04mi |
| 8507 Tally Ho Dr Hazelwood, MO | 2.0 | 1.5 | 1478 | $1,300 | $0.88 | 43d | 5 | 1.06mi |
| 50 Lynn Meadows Ln Florissant, MO | 3.0 | 1.0 | 864 | $1,450 | $1.68 | 23d | 1 | 1.06mi |
| 8306 Whitewater Dr Saint Louis, MO | 3.0 | 1.0 | 792 | $1,195 | $1.51 | 7d | 1 | 1.06mi |
| 6044 Cascade Dr Saint Louis, MO | 2.0 | 1.0 | 984 | $1,150 | $1.17 | 7d | 1 | 1.08mi |
| 6234 Hancock Ave Berkeley, MO | 2.0 | 1.0 | 846 | $1,050 | $1.24 | 43d | 1 | 1.12mi |
| 60 Mayme Dr Saint Louis, MO | 3.0 | 1.0 | 960 | $1,285 | $1.34 | 43d | 1 | 1.15mi |
| 910 Disco Dr Saint Louis, MO | 3.0 | 1.0 | 924 | $1,260 | $1.36 | 16d | 1 | 1.21mi |
| 135 Saint Maurice Ln Florissant, MO | 3.0 | 1.0 | 816 | $1,395 | $1.71 | 43d | 1 | 1.21mi |
| 601 Carson Rd Saint Louis, MO | 2.0 | 1.0 | 743 | $950 | $1.28 | 23d | 1 | 1.32mi |
| 1050 Ozment Dr Florissant, MO | 3.0 | 2.0 | 984 | $1,525 | $1.55 | 43d | 1 | 1.34mi |
| 401 Millman Dr Saint Louis, MO | 3.0 | 1.0 | 1008 | $1,450 | $1.44 | 16d | 1 | 1.34mi |
Listing history 20 events
-
2026-06-18days on market $87,000 Active 42 DOM
-
2026-06-17days on market $87,000 Active 41 DOM
-
2026-06-16days on market $87,000 Active 40 DOM
-
2026-06-15days on market $87,000 Active 39 DOM
-
2026-06-13days on market $87,000 Active 37 DOM
-
2026-06-13days on market $87,000 Active 36 DOM
-
2026-06-09days on market $87,000 Active 33 DOM
-
2026-06-08days on market $87,000 Active 32 DOM
-
2026-06-07days on market $87,000 Active 31 DOM
-
2026-06-05days on market $87,000 Active 28 DOM
-
2026-06-03days on market $87,000 Active 27 DOM
-
2026-06-02days on market $87,000 Active 26 DOM
-
2026-06-01days on market $87,000 Active 25 DOM
-
2026-05-31days on market $87,000 Active 24 DOM
-
2026-05-07$89,900 Active 1064-char remark
-
2025-12-04price $99,000
-
2025-11-05price $113,000
-
2025-10-18$120,000 Active
-
2025-07-27historical $1,000
-
2025-05-22$1,000
ⓘ Source: listings_history table (triggers on properties + properties_extension) + one-shot
backfill from property_details.listing_events for pre-trigger history.
Tax reassessment forecast MO · Resets to sale price
- Current annual tax
- $511 · $43/mo
- Projected year-2 tax
- $844 · $70/mo
- Expected delta
- +$333/yr (+$28/mo · 65.2%)
ⓘ Screening estimate from a state-policy table — verify with the county assessor before closing.
Climate risk First Street
- Flood 1/10 Low FEMA zone X (unshaded) · 0% chance over 30 yrs
- Wildfire 1/10 Low
- Heat 4/10 Moderate 7 d/yr ≥106°F today · 20 d/yr by 30 yrs out
- Wind 2/10 Low 100% chance of damaging wind over 30 yrs
- Air quality 3/10 Moderate 3 unhealthy d/yr today · 5 by 30 yrs out
Nearby sold comps map
Loading sold comps map…
Walkable amenities ~0.75 mi
Loading nearby amenities…
Taxation est. · year 1
- Rental income
- $15,432
- − Mortgage interest
- −$4,873
- − Property taxes
- −$511
- − Insurance
- −$435
- − Repairs & maintenance
- −$1,235
- − Management
- −$1,235
- − Depreciation
- −$2,531
- Taxable income
- $4,613
- Est. tax owed @ 24.0%
- −$1,107
- After-tax cash flow
- $4,664/yr
For passive investors: Depreciation is non-cash, so a rental often shows a tax loss while cash-flowing — sheltering income. Rental losses are passive: they offset passive income freely, and up to $25,000/yr can offset ordinary (W-2) income if you actively participate and your MAGI is under $100k (phasing out to $0 by $150k); unused losses carry forward. On sale, claimed depreciation is recaptured at up to 25%, and gains may owe capital-gains tax (a 1031 exchange can defer both). Figures are a year-1 estimate at your 24.0% rate — not tax advice; consult a CPA.
Schools (NCES district)
- District
- Ferguson-Florissant R-II
- NCES district ID
- 2912010
- Math proficiency
- 7% ▼ -9.00%
- Reading proficiency
- 20% ▼ -6.00%
- Median HH income
- $44,610
- Composite
- 11.96/100
- National rank
- #9666
- State rank
- #311 of 324 in MO
Livability — Hazelwood
- Score
- 62/100
- State rank
- #395
- US rank
- #16956
Category grades
Schools grade is shown separately in the Schools card above.
Census & demographics
- Census place
- Hazelwood, MO
- County
- Saint Louis County · 888,823 people
- City population
- 17,813
- Metro
- St. Louis, MO-IL
- Population (ZIP)
- 18,381
- Household income
- $52,328
- Rent vs Own
- Severe rent burden
- 957.0
Population outlook (St. Louis County) Hauer SSP2
- Today (2025)
- 1,025,227 people
- By 2030
- 1,028,023 · +0.3%
- By 2040
- 1,020,940 · -0.4%
- By 2050
- 1,007,280 · -1.8%
- By 2075
- 987,277 · -3.7%
- By 2100
- 921,984 · -10.1%
Race, ethnicity, and origin ACS 2023
- Neighborhood character
- Predominantly Black (66%)
- Race & ethnicity
- Black 66% White 28% Two or more races 3% Hispanic / Latino 2%
- Common ancestry
- Lithuanian 1% Iranian 1% Romanian 1%
- Foreign-born
- 1% · Canada
- Languages at home
- 95% English-only · Spanish 4%
Political lean MEDSL · St. Louis
- 2024 margin
- Strong D (+23.4) · D 60.8% · R 37.4% · Other 1.7%
- 2008→2024 swing
- +3.5pp toward D · 2008: 19.9pp · 2024: 23.4pp
- All cycles
- 2024: D+23.4 2020: D+24.0 2016: D+16.2 2012: D+13.7 2008: D+19.9
Not yet ingested
- Civics
- —
Market trends
- HPI YoY
- ▼ -152.56%
- Current HPI
- 138.6781
- Rent YoY
- ▲ 9.03%
- Metro
- St. Louis, MO-IL
- State GDP YoY
- ▲ 1.84%
- F500 in state
- 20
Industry mix (Fortune 500 HQ in MO)
| Industry | F500 HQs | Revenue |
|---|---|---|
| Healthcare | 1 | $163B |
|
||
| Insurance | 1 | $21B |
|
||
| Industrial Technology | 1 | $17B |
|
||
| Retail | 1 | $16B |
|
||
| Industrial Distribution | 1 | $10B |
|
||
| Utilities | 1 | $9B |
|
||
Price history
+8600.0% since first listed7 events — show timeline
- 2026-05-29 Price Changed $87,000 MARIS as Distributed by MLS Grid
- 2026-05-07 Listed $89,900 MARIS as Distributed by MLS Grid
- 2025-12-04 Price Changed $99,000 MARIS as Distributed by MLS Grid
- 2025-11-05 Price Changed $113,000 MARIS as Distributed by MLS Grid
- 2025-10-18 Listed $120,000 MARIS as Distributed by MLS Grid
- 2025-07-27 Rental Removed $1,000 RENTLY
- 2025-05-22 Listed for Rent $1,000 RENTLY
Property tax history
-3.3%/yrLatest (2022): $511 · +0.5% YoY. Source: county tax records.
Cash-flow waterfall
monthlySold comps — $/sqft
last 12 mo · ≤1 miLoading sold comps…