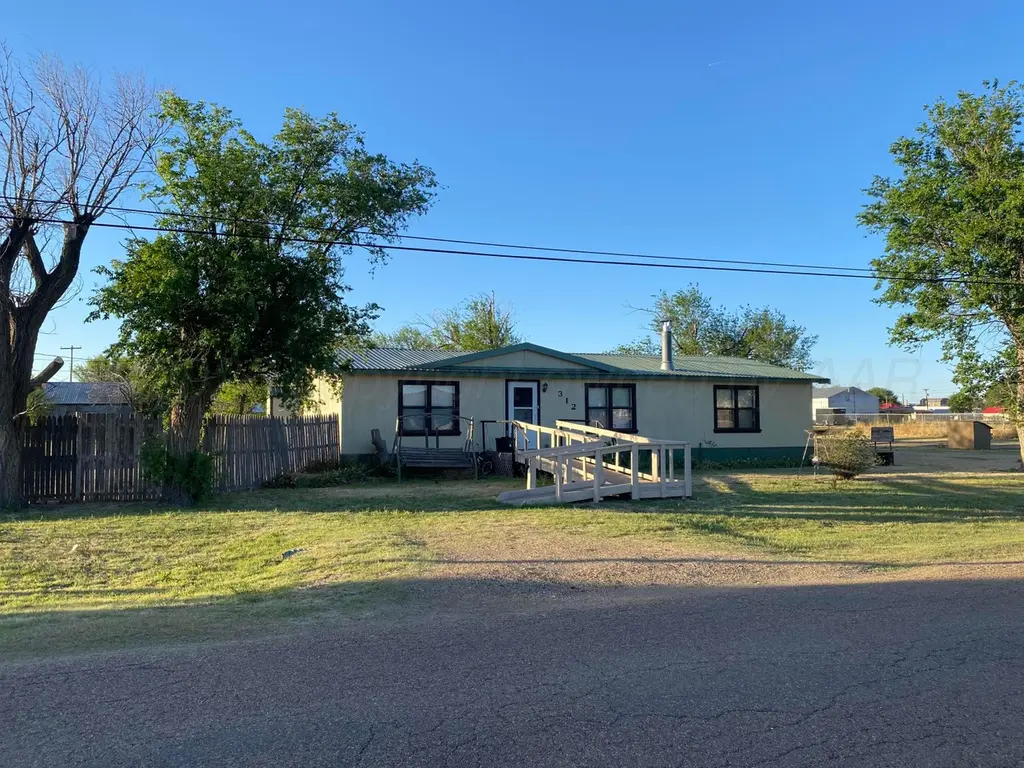
312 Goddard Ave · Panhandle, TX
Flood risk 1/10 · Minimal
- FEMA flood zone
- X
- Chance of flooding over 30 yrs
- 0.0%
- Est. flood insurance / yr
- $507 – $1,088
Fire risk 6/10 · Moderate
- Est. fire insurance / yr
- $1,222 – $2,270
Heat risk 5/10 · Moderate
- Hot days now (above 99°F)
- 7 days/yr
- Hot days in 30 yrs
- 20 days/yr
Wind risk 2/10 · Minimal
- Chance of severe wind over 30 yrs
- —
Air-quality risk 2/10 · Minimal
- Unhealthy air days now
- 1 days/yr
- Unhealthy air days in 30 yrs
- 1 days/yr
Risk factors via First Street. Map © Google.
Why this score? — see what drove the C grade
The composite is a weighted blend of 9 inputs, each scored 0–100. Each bar is that input's sub-score; the figure is the points it added to the 100-point composite (weight × sub-score).
- Cash flow +23.3/30.0
- DSCR +7.5/10.0
- ARV discount +7.5/15.0
- Schools +5.8/10.0
- 1% rule +5.2/10.0
- Livability +4.0/5.0
- Rent growth +2.5/5.0
- Condition / age +2.5/5.0
- Appreciation +0.0/10.0
$132,500
🖨 Deal sheet 📄 Offer letter ✓ Due diligence
Listing remarks
MOTIVATED SELLER! This 3-bed, 2-bath home offers strong potential for buyers seeking a property with solid fundamentals and room for value-add improvements. Sitting on a spacious corner lot, the property presents opportunities for exterior upgrades or future expansion, while the existing double carport and storm cellar add practical appeal for long-term renters or future buyers alike. Inside, a cozy wood-burning fireplace adds warmth to the living space. Additional amenities include a metal roof, two storage buildings for added functionality, and a newer HVAC system still under warranty, providing peace of mind and long-term value for these crazy Texas summers. With its functional layout, e
Key facts
- Built 1986
- Listed 38 days
Property features AI
Exterior
- Parking: Carport
- Utilities: Public water; Public sewer
- Home design: Single-family residential property; North-facing
- Construction: Metal roof
- Exterior features: Corner lot; Storage structure on the property
Interior
- Bathrooms: Two full bathrooms
- Heating & cooling: Central air
- Interior features: Central air conditioning
Neighborhood map
What this means for you Summary
Snapshot
- This is a 3-bed/1.0-bath manufactured listed at $132k.
Deal economics
- At list price, monthly cash flow is $241 ($3k/yr) — positive.
- The deal already cash-flows at list — no discount required.
- Meets the 1% rule at list price ($1k rent vs $132k).
- Recommended offer: $129k (3.0% below list) — sets the bar for market timing.
Location & tenants
- Location reads 81/100 on livability (#21 in TX, #1,354 nationally) — a professional / high-income tenant draw. Strengths: crime A+, employment A+, cost of living A+; Watch: amenities F, commute F.
- Panhandle ISD (rural): math 73% / reading 61% proficiency, ranked #27 of 826 in TX (top 3%) — acceptable for families but not a draw, mixed tenant base, ~2y average lease.
- Zoned schools: Panhandle El (math 67% / reading 67%, grade B+, #199 of 4,322 statewide, top 5%, 317 students, 32% FRL); Panhandle J H (math 77% / reading 57%, grade A-, #84 of 1,662 statewide, top 5%, 151 students, 32% FRL); Panhandle H S (math 74% / reading 74%, grade B+, #82 of 1,632 statewide, top 6%, 189 students, 26% FRL) — zoned schools at 30% FRL track the district average.
- Market conditions: 23 active listings in the ZIP; 39 units permitted in Carson County in 2024 (0 in 5+ unit buildings).
Forward outlook
- Local home prices are declining (-3.0%/yr); year-one equity from $916 of loan paydown is wiped out by about $4k of value loss. Plan a longer hold.
- Carson County population projected at -11% by 2050 — secular population decline; favor cash flow + early exit over multi-decade hold.
Negotiation context
- It's been on market 38 days — a 3% lower offer ($129k) is reasonable based on typical stale-listing flexibility.
Risks & watch-outs
- Climate carrying-cost: major wildfire risk; extreme-heat days projected 7→20/yr by 2055 (HVAC capex compounding) — expect insurance premiums to compound above CPI over the hold.
Questions for the listing agent
- It's been on market 38 days. Have you received any prior offers? Is the seller open to a 3% concession, seller financing, or rate buy-down credit?
- Is there a deadline driving the sale (1031 exchange, divorce, estate, relocation)? That informs how much negotiation room exists.
- Schools are A-rated — typically a magnet for longer-tenancy family renters. What's the average tenant stay here, and is there a school-zone premium baked into asking?
- What's the average days-on-market for RENTAL listings here right now (not sales)? A rising rental-DOM trend means longer vacancies and softer asking-rent achievability than the comps imply.
- What's the recent tenant-quality profile in this submarket — average credit score on applications, eviction rate, late-payment / NSF rate, and stable-employment percentage? A property-management company in the area should have these aggregated.
- How much new for-sale + rental construction is in the pipeline within 1–3 miles? Heavy new supply typically softens prices + rents 12–24 months out; constrained supply supports both.
Investment metrics
- 1% rule
- 1.02% ✓
- Cap rate
- 8.48%
- Cash-on-cash
- 7.81%
- DSCR
- 1.35
- GRM
- 8.2
CMA / ARV
No comps found within radius.
Projected returns pro-forma
-3.0% appreciation · 3.0% rent growth · sell at horizon
- IRR
- -4.4%
- Equity multiple
- 0.83×
- Total profit
- $-6,132
- Equity at exit
- $19,756
- IRR
- 5.2%
- Equity multiple
- 1.39×
- Total profit
- $14,318
- Equity at exit
- $11,456
Cash invested: $37,100 (down + closing). Projections, not guarantees.
Landlord ↔ Tenant lean methodology
- Overall (STATE)
- 87 Strongly Landlord-Friendly
- State Texas
- 87 Strongly Landlord-Friendly · R+5
- County
- — inherits STATE
- City
- — inherits STATE
ZIP-level market 79068
- Home prices YoY
- -17.0%
- Active inventory
- 23
- Price-to-rent
- 8.2×
Monthly cashflow live
- Estimated rent
- $1,353 medium interval (Pro) →
- Mortgage (P&I)
- −$695
- Tax from tax record
- −$78 /mo · $930/yr
- Insurance
- −$55
- HOA
- −$0
- Vacancy / Maint / Mgmt
- −$284
- Net cashflow
- $241
Break-even live
UW: 25.0% down · 7.5% · 30yr · 1.5% tax · 5.0% vac · 8.0% maint · 8.0% mgmt
Financing live
Cash to close
- Down payment
- $33,125
- Closing costs
- $3,975
- Reserves months
- —
- Total cash needed
- —
Loan-product check · same deal, 3 products live
Conventional
25% down · 7.5% · 30yr
- Down + closing
- —
- Monthly P&I
- —
- Monthly cashflow
- —
- DSCR
- —
- Eligible?
- —
Personal DTI + credit; lowest rate.
DSCR
20% down · 8.5% · 30yr
- Down + closing
- —
- Monthly P&I
- —
- Monthly cashflow
- —
- DSCR
- —
- Eligible?
- —
No personal income docs; deal must DSCR.
Hard money
10% down · 12.0% · 12mo
- Down + closing
- —
- Monthly P&I
- —
- Monthly cashflow
- —
- DSCR
- —
- Eligible?
- —
Short-term bridge; refi at stabilization.
Listing history 9 events
-
2026-06-07statusdays on market $132,500 Pending 38 DOM
-
2026-06-03days on market $132,500 Active 37 DOM
-
2026-06-02days on market $132,500 Active 36 DOM
-
2026-06-01days on market $132,500 Active 35 DOM
-
2026-05-31days on market $132,500 Active 34 DOM
-
2026-05-30days on market $132,500 Active 33 DOM
-
2026-05-15price $132,500 789-char remark
-
2026-04-27$140,000 Active 789-char remark
-
2003-09-30soldstatus
ⓘ Source: listings_history table (triggers on properties + properties_extension) + one-shot
backfill from property_details.listing_events for pre-trigger history.
Tax reassessment forecast TX · Resets to sale price
- Current annual tax
- $930 · $78/mo
- Projected year-2 tax
- $2,425 · $202/mo
- Expected delta
- +$1,495/yr (+$125/mo · 160.7%)
ⓘ Screening estimate from a state-policy table — verify with the county assessor before closing.
Climate risk First Street
- Flood 1/10 Low FEMA zone X · 0% chance over 30 yrs
- Wildfire 6/10 Major
- Heat 5/10 Major 7 d/yr ≥99°F today · 20 d/yr by 30 yrs out
- Wind 2/10 Low
- Air quality 2/10 Low 1 unhealthy d/yr today · 1 by 30 yrs out
Nearby sold comps map
Loading sold comps map…
Walkable amenities ~0.75 mi
Loading nearby amenities…
Taxation est. · year 1
- Rental income
- $16,237
- − Mortgage interest
- −$7,422
- − Property taxes
- −$930
- − Insurance
- −$662
- − Repairs & maintenance
- −$1,299
- − Management
- −$1,299
- − Depreciation
- −$3,855
- Taxable income
- $770
- Est. tax owed @ 24.0%
- −$185
- After-tax cash flow
- $2,712/yr
For passive investors: Depreciation is non-cash, so a rental often shows a tax loss while cash-flowing — sheltering income. Rental losses are passive: they offset passive income freely, and up to $25,000/yr can offset ordinary (W-2) income if you actively participate and your MAGI is under $100k (phasing out to $0 by $150k); unused losses carry forward. On sale, claimed depreciation is recaptured at up to 25%, and gains may owe capital-gains tax (a 1031 exchange can defer both). Figures are a year-1 estimate at your 24.0% rate — not tax advice; consult a CPA.
Schools (NCES district)
- District
- Panhandle ISD
- NCES district ID
- 4834230
- Math proficiency
- 73% ▲ 4.00%
- Reading proficiency
- 61% ▼ -1.00%
- Median HH income
- $63,893
- Composite
- 58.27/100
- National rank
- #1021
- State rank
- #27 of 826 in TX
Livability — Panhandle
- Score
- 81/100
- State rank
- #21
- US rank
- #1354
Category grades
Schools grade is shown separately in the Schools card above.
Census & demographics
- Census place
- Panhandle, TX
- Population (ZIP)
- 3,124
Population outlook (Carson County) Hauer SSP2
- Today (2025)
- 5,631 people
- By 2030
- 5,516 · -2.0%
- By 2040
- 5,190 · -7.8%
- By 2050
- 5,007 · -11.1%
- By 2075
- 4,509 · -19.9%
- By 2100
- 3,458 · -38.6%
Race, ethnicity, and origin ACS 2023
- Neighborhood character
- Predominantly White (77%)
- Race & ethnicity
- White 77% Hispanic / Latino 13% Two or more races 5% Native American 3% Pacific Islander 2%
- Hispanic origin (detail)
- Mexican 8%
- Common ancestry
- Slovak 2% Italian 2% Romanian 1%
- Foreign-born
- 3% · Canada
- Languages at home
- 98% English-only · Spanish 2%
Political lean MEDSL · Carson
- 2024 margin
- Solid R (+81.2) · D 9.1% · R 90.3%
- 2008→2024 swing
- -9.3pp toward R · 2008: -71.9pp · 2024: -81.2pp
- All cycles
- 2024: R+81.2 2020: R+79.5 2016: R+80.4 2012: R+77.8 2008: R+71.9
Not yet ingested
- Civics
- —
Market trends
- HPI YoY
- ▼ -34.95%
- Current HPI
- 171.0533
- Rent YoY
- —
- Metro
- —
- State GDP YoY
- ▲ 3.95%
- F500 in state
- 110
Industry mix (Fortune 500 HQ in TX)
| Industry | F500 HQs | Revenue |
|---|---|---|
| Energy | 16 | $1,198B |
|
||
| Technology | 5 | $198B |
|
||
| Engineering / Construction | 4 | $72B |
|
||
| Energy Services | 3 | $60B |
|
||
| Utilities | 3 | $41B |
|
||
| Healthcare | 2 | $330B |
|
||
Price history
-5.4% since first listed4 events — show timeline
- 2026-06-05 Pending — AARMLS
- 2026-05-15 Price Changed $132,500 AARMLS
- 2026-04-27 Listed $140,000 AARMLS
- 2003-09-30 Sold (Public Records) — Public Records
Property tax history
+4.1%/yrLatest (2025): $930 · +20.8% YoY. Source: county tax records.
Cash-flow waterfall
monthlySold comps — $/sqft
last 12 mo · ≤1 miLoading sold comps…