1404 11th St · Columbus, NE
Flood risk 1/10 · Minimal
- FEMA flood zone
- X
- Chance of flooding over 30 yrs
- 0.0%
- Est. flood insurance / yr
- $473 – $860
Fire risk 1/10 · Minimal
- Est. fire insurance / yr
- $1,161 – $2,155
Heat risk 3/10 · Minor
- Hot days now (above 104°F)
- 7 days/yr
- Hot days in 30 yrs
- 16 days/yr
Wind risk 2/10 · Minimal
- Chance of severe wind over 30 yrs
- —
Air-quality risk 1/10 · Minimal
- Unhealthy air days now
- 0 days/yr
- Unhealthy air days in 30 yrs
- 0 days/yr
Risk factors via First Street. Map © Google.
Why this score? — see what drove the C grade
The composite is a weighted blend of 9 inputs, each scored 0–100. Each bar is that input's sub-score; the figure is the points it added to the 100-point composite (weight × sub-score).
- Cash flow +19.6/30.0
- ARV discount +15.0/15.0
- DSCR +6.2/10.0
- 1% rule +5.2/10.0
- Livability +4.0/5.0
- Schools +3.5/10.0
- Rent growth +2.5/5.0
- Condition / age +2.5/5.0
- Appreciation +0.0/10.0
$159,000
🖨 Deal sheet 📄 Offer letter ✓ Due diligence
Listing remarks
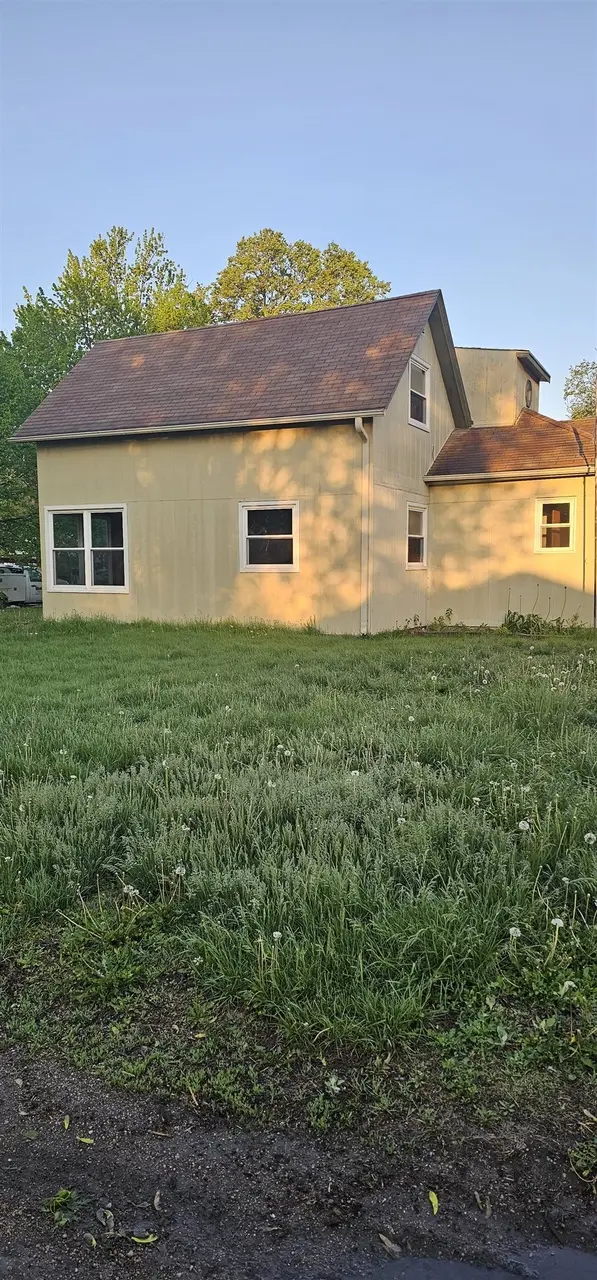
Attention investors! Looking to expand your portfolio or begin your investment journey, this property is for you. This 1764 sq ft 1 1/2 story 4 bedroom 2 bath home sits on a corner lot with a detached garage. The initial work has already been started for you.
Key facts
- 2 garage spots
- Listed 36 days
Property features AI
Exterior
- Parking: Detached 2-car garage
- Home design: Single-family residence; One story
- Exterior features: Located in the Original subdivision
Interior
- Interior features: Basement
Neighborhood map
What this means for you Summary
Snapshot
- This is a 4-bed/2.0-bath single-family listed at $159k.
Deal economics
- At list price, monthly cash flow is $184 ($2k/yr) — positive.
- The deal already cash-flows at list — no discount required.
- Meets the 1% rule at list price ($2k rent vs $159k).
- Recommended offer: $154k (3.0% below list) — sets the bar for market timing.
- Cap rate 7.7% vs local median 3.3% in Columbus — top-decile yield for the area; either an underpriced asset or a hidden risk that comps aren't pricing in. Stress-test before assuming the spread holds.
Location & tenants
- Location reads 80/100 on livability (#20 in NE, #1,633 nationally) — a professional / high-income tenant draw. Strengths: crime A+, cost of living A+, housing A+; Watch: amenities D-, commute F.
- Columbus Public Schools (town): math 39% / reading 43% proficiency, ranked #93 of 111 in NE (top 84%) — families likely to look elsewhere, expect single-tenant / working-renter base with shorter leases.
- Market conditions: 301 active listings in the ZIP; 98 units permitted in Platte County in 2024 (17 in 5+ unit buildings).
Forward outlook
- Local home prices are declining (-3.0%/yr); year-one equity from $1k of loan paydown is wiped out by about $5k of value loss. Plan a longer hold.
- Platte County population projected at +13% by 2050 — modest demand growth; plan on rents tracking national, not racing it.
Negotiation context
- It's been on market 36 days — a 3% lower offer ($154k) is reasonable based on typical stale-listing flexibility.
- Current owner paid $115k; 38% above their basis — modest negotiation headroom, anchor on the comps not their cost.
Risks & watch-outs
- Watch-outs: built in 1910 — expect roof / HVAC / electrical / plumbing capex.
Questions for the listing agent
- It's been on market 36 days. Have you received any prior offers? Is the seller open to a 3% concession, seller financing, or rate buy-down credit?
- Built in 1910 — when were the roof, HVAC, electrical panel, plumbing, and water heater last replaced?
- Is there a deadline driving the sale (1031 exchange, divorce, estate, relocation)? That informs how much negotiation room exists.
- What's the average days-on-market for RENTAL listings here right now (not sales)? A rising rental-DOM trend means longer vacancies and softer asking-rent achievability than the comps imply.
- What's the recent tenant-quality profile in this submarket — average credit score on applications, eviction rate, late-payment / NSF rate, and stable-employment percentage? A property-management company in the area should have these aggregated.
- How much new for-sale + rental construction is in the pipeline within 1–3 miles? Heavy new supply typically softens prices + rents 12–24 months out; constrained supply supports both.
Investment metrics
- 1% rule
- 1.02% ✓
- Cap rate
- 7.68%
- Cash-on-cash
- 4.96%
- DSCR
- 1.22
- GRM
- 8.2
CMA / ARV
- ARV (median comp)
- $223,108
- List price
- $159,000
- Delta
- -28.73%
- Verdict
- UNDERPRICED
- Comps
- 20 within 1.0 mi
Show comp detail 12 sales within ~0.75 mi
| Address | Dist | Beds/Ba | Sqft | Sold | Price | $/sf | Match |
|---|---|---|---|---|---|---|---|
| 1709 12th St | 0.21mi | 3/2.0 (-1) | 1,672 (-5%) | 1mo | $195,000 | $117 | 76 |
| 1464 22nd Ave | 0.58mi | 4/2.0 | 1,824 (+3%) | 2mo | $165,000 | $90 | 66 |
| 1715 15th St | 0.33mi | 3/2.0 (-1) | 1,856 (+5%) | 10mo | $225,000 | $121 | 63 |
| 1708 17th St | 0.46mi | 3/1.0 (-1) | 1,834 (+4%) | 2mo | $219,000 | $119 | 62 |
| 1022 2nd St | 0.69mi | 4/2.0 | 1,686 (-4%) | 1mo | $299,900 | $178 | 60 |
| 2109 7th St | 0.57mi | 3/2.0 (-1) | 1,858 (+5%) | 10mo | $210,000 | $113 | 52 |
| 125 E Parkway Pkwy | 0.73mi | 4/2.0 | 1,879 (+6%) | 6mo | $285,000 | $152 | 50 |
| 2303 7th St | 0.67mi | 3/1.0 (-1) | 1,796 (+2%) | 9mo | $190,000 | $106 | 49 |
| 117 S Rose Ln | 0.70mi | 3/2.0 (-1) | 1,920 (+9%) | 1mo | $245,000 | $128 | 47 |
| 103 E Parkway | 0.59mi | 3/2.0 (-1) | 1,953 (+11%) | 5mo | $240,000 | $123 | 45 |
| 353 14th Ave | 0.56mi | 3/1.0 (-1) | 1,616 (-8%) | 7mo | $175,000 | $108 | 45 |
| 418 7th St | 0.73mi | 4/2.0 | 2,000 (+13%) | 6mo | $275,000 | $138 | 39 |
Match score weights: distance 35% · size 25% · config 20% · recency 20%. Top-matched comps best support the ARV.
Projected returns pro-forma
-3.0% appreciation · 3.0% rent growth · sell at horizon
- IRR
- -8.6%
- Equity multiple
- 0.68×
- Total profit
- $-14,029
- Equity at exit
- $23,707
- IRR
- 0.9%
- Equity multiple
- 1.07×
- Total profit
- $2,962
- Equity at exit
- $13,747
Cash invested: $44,520 (down + closing). Projections, not guarantees.
Landlord ↔ Tenant lean methodology
- Overall (STATE)
- 83 Strongly Landlord-Friendly
- State Nebraska
- 83 Strongly Landlord-Friendly · R+13
- County
- — inherits STATE
- City
- — inherits STATE
ZIP-level market 68601
- Home prices YoY
- -22.4%
- Active inventory
- 301
- Price-to-rent
- 8.2×
Monthly cashflow live
- Estimated rent
- $1,623 medium interval (Pro) →
- Mortgage (P&I)
- −$834
- Tax from tax record
- −$198 /mo · $2,375/yr
- Insurance
- −$66
- HOA
- −$0
- Vacancy / Maint / Mgmt
- −$341
- Net cashflow
- $184
Break-even live
UW: 25.0% down · 7.5% · 30yr · 1.5% tax · 5.0% vac · 8.0% maint · 8.0% mgmt
Financing live
Cash to close
- Down payment
- $39,750
- Closing costs
- $4,770
- Reserves months
- —
- Total cash needed
- —
Loan-product check · same deal, 3 products live
Conventional
25% down · 7.5% · 30yr
- Down + closing
- —
- Monthly P&I
- —
- Monthly cashflow
- —
- DSCR
- —
- Eligible?
- —
Personal DTI + credit; lowest rate.
DSCR
20% down · 8.5% · 30yr
- Down + closing
- —
- Monthly P&I
- —
- Monthly cashflow
- —
- DSCR
- —
- Eligible?
- —
No personal income docs; deal must DSCR.
Hard money
10% down · 12.0% · 12mo
- Down + closing
- —
- Monthly P&I
- —
- Monthly cashflow
- —
- DSCR
- —
- Eligible?
- —
Short-term bridge; refi at stabilization.
Listing history 9 events
-
2026-06-04statusdays on market $159,000 Pending 36 DOM
-
2026-06-02days on market $159,000 Active 35 DOM
-
2026-06-01days on market $159,000 Active 34 DOM
-
2026-05-31days on market $159,000 Active 33 DOM
-
2026-05-18price $159,000 259-char remark
-
2026-04-24$169,000 Active 259-char remark
-
2017-07-03soldstatus $115,000
-
2009-04-22soldstatus $60,800
-
2005-09-30soldstatus $80,000
ⓘ Source: listings_history table (triggers on properties + properties_extension) + one-shot
backfill from property_details.listing_events for pre-trigger history.
Tax reassessment forecast NE · Resets to sale price
- Current annual tax
- $2,375 · $198/mo
- Projected year-2 tax
- $2,751 · $229/mo
- Expected delta
- +$376/yr (+$31/mo · 15.8%)
ⓘ Screening estimate from a state-policy table — verify with the county assessor before closing.
Climate risk First Street
- Flood 1/10 Low FEMA zone X · 0% chance over 30 yrs
- Wildfire 1/10 Low
- Heat 3/10 Moderate 7 d/yr ≥104°F today · 16 d/yr by 30 yrs out
- Wind 2/10 Low
- Air quality 1/10 Low 0 unhealthy d/yr today · 0 by 30 yrs out
Nearby sold comps map
Loading sold comps map…
Walkable amenities ~0.75 mi
Loading nearby amenities…
Taxation est. · year 1
- Rental income
- $19,471
- − Mortgage interest
- −$8,906
- − Property taxes
- −$2,375
- − Insurance
- −$795
- − Repairs & maintenance
- −$1,558
- − Management
- −$1,558
- − Depreciation
- −$4,625
- Taxable loss
- −$346
- Est. tax savings @ 24.0%
- +$83
- After-tax cash flow
- $2,290/yr
For passive investors: Depreciation is non-cash, so a rental often shows a tax loss while cash-flowing — sheltering income. Rental losses are passive: they offset passive income freely, and up to $25,000/yr can offset ordinary (W-2) income if you actively participate and your MAGI is under $100k (phasing out to $0 by $150k); unused losses carry forward. On sale, claimed depreciation is recaptured at up to 25%, and gains may owe capital-gains tax (a 1031 exchange can defer both). Figures are a year-1 estimate at your 24.0% rate — not tax advice; consult a CPA.
Schools (NCES district)
- District
- Columbus Public Schools
- NCES district ID
- 3105340
- Math proficiency
- 39% ▼ -10.00%
- Reading proficiency
- 43% ▼ -3.00%
- Median HH income
- $51,074
- Composite
- 35.41/100
- National rank
- #4942
- State rank
- #93 of 111 in NE
Livability — Columbus
- Score
- 80/100
- State rank
- #20
- US rank
- #1633
Category grades
Schools grade is shown separately in the Schools card above.
Census & demographics
- Census place
- Columbus, NE
- City population
- 30,619
- Population (ZIP)
- 30,619
Population outlook (Platte County) Hauer SSP2
- Today (2025)
- 34,130 people
- By 2030
- 34,778 · +1.9%
- By 2040
- 36,436 · +6.8%
- By 2050
- 38,648 · +13.2%
- By 2075
- 47,293 · +38.6%
- By 2100
- 57,020 · +67.1%
Race, ethnicity, and origin ACS 2023
- Neighborhood character
- Predominantly White (71%)
- Race & ethnicity
- White 71% Hispanic / Latino 25% Two or more races 14%
- Hispanic origin (detail)
- Mexican 14% Cuban 2%
- Common ancestry
- Romanian 7% Portuguese 2% Lithuanian 1%
- Foreign-born
- 14% · Canada
- Languages at home
- 79% English-only · Spanish 20%
Political lean MEDSL · Platte
- 2024 margin
- Solid R (+58.3) · D 20.4% · R 78.7%
- 2008→2024 swing
- -16.8pp toward R · 2008: -41.5pp · 2024: -58.3pp
- All cycles
- 2024: R+58.3 2020: R+56.8 2016: R+58.8 2012: R+51.8 2008: R+41.5
Not yet ingested
- Civics
- —
Market trends
- HPI YoY
- ▼ -100.37%
- Current HPI
- 347.5063
- Rent YoY
- —
- Metro
- —
- State GDP YoY
- ▲ 0.68%
- F500 in state
- 2
Industry mix (Fortune 500 HQ in NE)
| Industry | F500 HQs | Revenue |
|---|---|---|
| Conglomerate | 1 | $371B |
|
||
Price history
+98.8% since first listed6 events — show timeline
- 2026-06-04 Pending — CBOR
- 2026-05-18 Price Changed $159,000 CBOR
- 2026-04-24 Listed $169,000 CBOR
- 2017-07-03 Sold (Public Records) $115,000 Public Records
- 2009-04-22 Sold (Public Records) $60,800 Public Records
- 2005-09-30 Sold (Public Records) $80,000 Public Records
Property tax history
+3.8%/yrLatest (2025): $2,375 · +7.0% YoY. Source: county tax records.
Cash-flow waterfall
monthlySold comps — $/sqft
last 12 mo · ≤1 miLoading sold comps…