228 Stoney Rdg · Hudson, TX
Flood risk No data
- FEMA flood zone
- —
- Chance of flooding over 30 yrs
- —
- Est. flood insurance / yr
- —
Fire risk No data
- Est. fire insurance / yr
- —
Heat risk No data
- Hot days now (above threshold)
- —
- Hot days in 30 yrs
- —
Wind risk No data
- Chance of severe wind over 30 yrs
- —
Air-quality risk No data
- Unhealthy air days now
- —
- Unhealthy air days in 30 yrs
- —
Risk factors via First Street. Map © Google.
Why this score? — see what drove the D- grade
The composite is a weighted blend of 9 inputs, each scored 0–100. Each bar is that input's sub-score; the figure is the points it added to the 100-point composite (weight × sub-score).
- ARV discount +13.1/15.0
- Cash flow +7.8/30.0
- Schools +4.9/10.0
- Livability +3.2/5.0
- Rent growth +2.5/5.0
- Condition / age +2.5/5.0
- 1% rule +2.3/10.0
- DSCR +1.9/10.0
- Appreciation +0.0/10.0
$199,990
🖨 Deal sheet 📄 Offer letter ✓ Due diligence
Listing remarks MLS
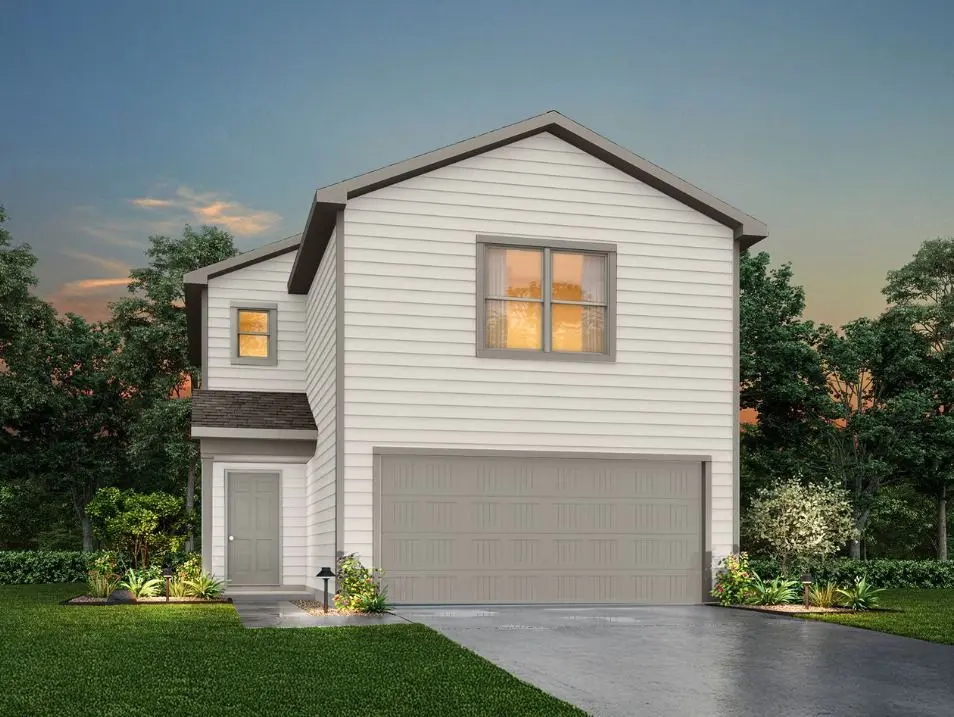
Model 1600-2 A1 - Glacier
Key facts
- Built 2026
- Listed 158 days
Neighborhood map
What this means for you Summary
Snapshot
- This is a 3-bed/2.5-bath single-family listed at $200k.
Deal economics
- At list price, monthly cash flow is $-225 ($-3k/yr) — negative.
- To cash-flow at today's rent, offer at most $167k (16.3% below list).
- To meet the 1% rule (rent ≥ 1% of price), the offer needs to be $146k (26.8% below list).
- Recommended offer: $146k (26.8% below list) — sets the bar for 1% rule.
- Cap rate 4.9% vs local median 3.0% in Hudson — top-decile yield for the area; either an underpriced asset or a hidden risk that comps aren't pricing in. Stress-test before assuming the spread holds.
Location & tenants
- Location reads 64/100 on livability (#791 in TX) — a middle-class / working-renter tenant base. Strengths: crime A+, cost of living A+, housing A+; Watch: schools F, amenities F, commute F.
- Hudson ISD (rural): math 63% / reading 54% proficiency, ranked #85 of 826 in TX (top 10%) — acceptable for families but not a draw, mixed tenant base, ~2y average lease.
- Market conditions: 292 active listings in the ZIP; 2 comparable units currently listed for rent nearby; 120 units permitted in Angelina County in 2024 (0 in 5+ unit buildings).
Forward outlook
- Local home prices are declining (-3.0%/yr); year-one equity from $1k of loan paydown is wiped out by about $6k of value loss. Plan a longer hold.
Negotiation context
- It's been on market 159 days — a 12% lower offer ($176k) is reasonable based on typical stale-listing flexibility.
- 4 sale attempts; this cycle's ask has dropped $13k (6%) from the opening price — seller is motivated, your offer sets the floor, not the list.
Questions for the listing agent
- What do current leases actually rent for vs. the listed asking? Can we see a recent rent roll and the last 12 months of T-12 income?
- It's been on market 159 days. Have you received any prior offers? Is the seller open to a 27% concession, seller financing, or rate buy-down credit?
- Why hasn't it sold? Are there any deal-killer items the seller is aware of (foundation, flood, title, zoning, code violations)?
- Is there a deadline driving the sale (1031 exchange, divorce, estate, relocation)? That informs how much negotiation room exists.
- Schools are F-rated, which usually means shorter tenancies and higher turnover. Who's the typical renter profile here, and what's been the actual vacancy rate?
- The area grade is low — what's the realistic commute time and amenity access for the typical tenant pool here? Any planned neighborhood developments (good or bad) we should know about?
- What's the average days-on-market for RENTAL listings here right now (not sales)? A rising rental-DOM trend means longer vacancies and softer asking-rent achievability than the comps imply.
- What's the recent tenant-quality profile in this submarket — average credit score on applications, eviction rate, late-payment / NSF rate, and stable-employment percentage? A property-management company in the area should have these aggregated.
- How much new for-sale + rental construction is in the pipeline within 1–3 miles? Heavy new supply typically softens prices + rents 12–24 months out; constrained supply supports both.
Investment metrics
- 1% rule
- 0.73% ✗
- Cap rate
- 4.94%
- Cash-on-cash
- -4.83%
- DSCR
- 0.79
- GRM
- 11.4
CMA / ARV
- ARV (median comp)
- $228,231
- List price
- $199,990
- Delta
- -12.37%
- Verdict
- UNDERPRICED
- Comps
- 2 within 1.0 mi
Projected returns pro-forma
-3.0% appreciation · 3.0% rent growth · sell at horizon
- IRR
- -24.5%
- Equity multiple
- 0.17×
- Total profit
- $-46,743
- Equity at exit
- $29,819
- IRR
- -20.0%
- Equity multiple
- -0.06×
- Total profit
- $-59,102
- Equity at exit
- $17,291
Cash invested: $55,997 (down + closing). Projections, not guarantees.
Landlord ↔ Tenant lean methodology
- Overall (STATE)
- 87 Strongly Landlord-Friendly
- State Texas
- 87 Strongly Landlord-Friendly · R+5
- County
- — inherits STATE
- City
- — inherits STATE
ZIP-level market 75904
- Home prices YoY
- -25.1%
- Active inventory
- 292
- Price-to-rent
- 11.4×
Monthly cashflow live
- Estimated rent
- $1,464 medium interval (Pro) →
- Mortgage (P&I)
- −$1,049
- Tax est. 1.5%
- −$250 /mo · $3,000/yr
- Insurance
- −$83
- HOA
- −$0
- Vacancy / Maint / Mgmt
- −$307
- Net cashflow
- $-225
Break-even live
UW: 25.0% down · 7.5% · 30yr · 1.5% tax · 5.0% vac · 8.0% maint · 8.0% mgmt
Financing live
Cash to close
- Down payment
- $49,998
- Closing costs
- $6,000
- Reserves months
- —
- Total cash needed
- —
Loan-product check · same deal, 3 products live
Conventional
25% down · 7.5% · 30yr
- Down + closing
- —
- Monthly P&I
- —
- Monthly cashflow
- —
- DSCR
- —
- Eligible?
- —
Personal DTI + credit; lowest rate.
DSCR
20% down · 8.5% · 30yr
- Down + closing
- —
- Monthly P&I
- —
- Monthly cashflow
- —
- DSCR
- —
- Eligible?
- —
No personal income docs; deal must DSCR.
Hard money
10% down · 12.0% · 12mo
- Down + closing
- —
- Monthly P&I
- —
- Monthly cashflow
- —
- DSCR
- —
- Eligible?
- —
Short-term bridge; refi at stabilization.
Rent comps 2 comps
| Address | Beds | Baths | Sqft | Rent | $/sqft | DOM | Units | Dist |
|---|---|---|---|---|---|---|---|---|
| 3011 Ted Trout Dr Lot 11 Lufkin, TX | 3.0 | 2.0 | 1216 | $1,095 | $0.90 | 44d | 1 | 0.68mi |
| 861 Mount Carmel Rd Lufkin, TX | 3.0 | 2.0 | 1216 | $1,045 | $0.86 | 44d | 4 | 1.06mi |
Listing history 34 events
-
2026-06-10days on market $199,990 Active 159 DOM
-
2026-06-09days on market $199,990 Active 158 DOM
-
2026-06-08days on market $199,990 Active 157 DOM
-
2026-06-07days on market $199,990 Active 156 DOM
-
2026-06-05days on market $199,990 Active 153 DOM
-
2026-06-02days on market $199,990 Active 151 DOM
-
2026-06-01days on market $199,990 Active 150 DOM
-
2026-05-31days on market $199,990 Active 149 DOM
-
2026-05-30days on market $199,990 Active 148 DOM
-
2026-05-14price $207,990 25-char remark
Show marketing remark (25 chars)
Model 1600-2 A1 - Glacier
-
2026-05-12historical
-
2026-04-22price $208,990 25-char remark
Show marketing remark (25 chars)
Model 1600-2 A1 - Glacier
-
2026-04-21price $208,990
-
2026-04-21price $208,990
-
2026-04-18price $209,990 25-char remark
Show marketing remark (25 chars)
Model 1600-2 A1 - Glacier
-
2026-04-17price $209,990
-
2026-04-17price $209,990
-
2026-04-15$212,990 Active
-
2026-04-14historical
-
2026-04-13price $212,990
-
2026-04-13price $212,990
-
2026-04-11price $212,990 25-char remark
Show marketing remark (25 chars)
Model 1600-2 A1 - Glacier
-
2026-03-30price $217,990
-
2026-03-27$217,990 Active
-
2026-03-25price $217,990 25-char remark
Show marketing remark (25 chars)
Model 1600-2 A1 - Glacier
-
2026-03-11price $222,990 25-char remark
Show marketing remark (25 chars)
Model 1600-2 A1 - Glacier
-
2026-03-04price $234,990 25-char remark
Show marketing remark (25 chars)
Model 1600-2 A1 - Glacier
-
2026-02-27price $229,990 25-char remark
Show marketing remark (25 chars)
Model 1600-2 A1 - Glacier
-
2026-02-12price $234,990 25-char remark
Show marketing remark (25 chars)
Model 1600-2 A1 - Glacier
-
2026-02-06price $236,990 25-char remark
Show marketing remark (25 chars)
Model 1600-2 A1 - Glacier
-
2026-01-15price $238,377
Show marketing remark (25 chars)
Model 1600-2 A1 - Glacier
-
2026-01-15price $238,377 25-char remark
Show marketing remark (25 chars)
Model 1600-2 A1 - Glacier
-
2026-01-02$239,877 Active 25-char remark
Show marketing remark (25 chars)
Model 1600-2 A1 - Glacier
-
2025-11-19$239,877 Active
ⓘ Source: listings_history table (triggers on properties + properties_extension) + one-shot
backfill from property_details.listing_events for pre-trigger history.
Nearby sold comps map
Loading sold comps map…
Walkable amenities ~0.75 mi
Loading nearby amenities…
Taxation est. · year 1
- Rental income
- $17,569
- − Mortgage interest
- −$11,203
- − Property taxes
- −$3,000
- − Insurance
- −$1,000
- − Repairs & maintenance
- −$1,406
- − Management
- −$1,406
- − Depreciation
- −$5,818
- Taxable loss
- −$6,262
- Est. tax savings @ 24.0%
- +$1,503
- After-tax cash flow
- $-1,202/yr
For passive investors: Depreciation is non-cash, so a rental often shows a tax loss while cash-flowing — sheltering income. Rental losses are passive: they offset passive income freely, and up to $25,000/yr can offset ordinary (W-2) income if you actively participate and your MAGI is under $100k (phasing out to $0 by $150k); unused losses carry forward. On sale, claimed depreciation is recaptured at up to 25%, and gains may owe capital-gains tax (a 1031 exchange can defer both). Figures are a year-1 estimate at your 24.0% rate — not tax advice; consult a CPA.
Schools (NCES district)
- District
- Hudson ISD
- NCES district ID
- 4823790
- Math proficiency
- 63% ▼ -3.00%
- Reading proficiency
- 54% ▲ 1.00%
- Median HH income
- $45,047
- Composite
- 49.4/100
- National rank
- #2012
- State rank
- #85 of 826 in TX
Livability — Hudson
- Score
- 64/100
- State rank
- #791
- US rank
- #14441
Category grades
Schools grade is shown separately in the Schools card above.
Census & demographics
- Census place
- Hudson, TX
- County
- Angelina County · 62,696 people
- Metro
- Lufkin, TX
- Population (ZIP)
- 34,462
- Household income
- $60,205
- Rent vs Own
- Severe rent burden
- 1159.0
Population outlook (Angelina County) Hauer SSP2
- Today (2025)
- 90,174 people
- By 2030
- 90,697 · +0.6%
- By 2040
- 91,291 · +1.2%
- By 2050
- 91,168 · +1.1%
- By 2075
- 88,961 · -1.3%
- By 2100
- 80,590 · -10.6%
Race, ethnicity, and origin ACS 2023
- Neighborhood character
- Diverse neighborhood (Simpson 0.58)
- Race & ethnicity
- White 60% Hispanic / Latino 19% Black 16% Two or more races 12% Native American 2%
- Hispanic origin (detail)
- Mexican 17%
- Common ancestry
- Romanian 2% Slovak 1% Lithuanian 1%
- Foreign-born
- 6% · Canada
- Languages at home
- 86% English-only · Spanish 14%
Political lean MEDSL · Angelina
- 2024 margin
- Solid R (+52.0) · D 23.7% · R 75.7%
- 2008→2024 swing
- -17.0pp toward R · 2008: -35.0pp · 2024: -52.0pp
- All cycles
- 2024: R+52.0 2020: R+46.1 2016: R+47.3 2012: R+43.9 2008: R+35.0
Not yet ingested
- Civics
- —
Market trends
- HPI YoY
- ▼ -71.71%
- Current HPI
- 213.4236
- Rent YoY
- —
- Metro
- Lufkin, TX
- State GDP YoY
- ▲ 3.95%
- F500 in state
- 110
Industry mix (Fortune 500 HQ in TX)
| Industry | F500 HQs | Revenue |
|---|---|---|
| Energy | 16 | $1,198B |
|
||
| Technology | 5 | $198B |
|
||
| Engineering / Construction | 4 | $72B |
|
||
| Energy Services | 3 | $60B |
|
||
| Utilities | 3 | $41B |
|
||
| Healthcare | 2 | $330B |
|
||
Price history
-13.3% since first listed25 events — show timeline
- 2026-05-14 Price Changed $207,990 Zillow
- 2026-05-12 Listing Removed — HARMLS
- 2026-04-22 Price Changed $208,990 Zillow
- 2026-04-21 Price Changed $208,990 HARMLS
- 2026-04-21 Price Changed $208,990 Deep East Texas MLS
- 2026-04-18 Price Changed $209,990 Zillow
- 2026-04-17 Price Changed $209,990 HARMLS
- 2026-04-17 Price Changed $209,990 Deep East Texas MLS
- 2026-04-15 Listed $212,990 HARMLS
- 2026-04-14 Listing Removed — HARMLS
- 2026-04-13 Price Changed $212,990 Deep East Texas MLS
- 2026-04-13 Price Changed $212,990 HARMLS
- 2026-04-11 Price Changed $212,990 Zillow
- 2026-03-30 Price Changed $217,990 HARMLS
- 2026-03-27 Listed $217,990 Deep East Texas MLS
- 2026-03-25 Price Changed $217,990 Zillow
- 2026-03-11 Price Changed $222,990 Zillow
- 2026-03-04 Price Changed $234,990 Zillow
- 2026-02-27 Price Changed $229,990 Zillow
- 2026-02-12 Price Changed $234,990 Zillow
- 2026-02-06 Price Changed $236,990 Zillow
- 2026-01-15 Price Changed $238,377 HARMLS
- 2026-01-15 Price Changed $238,377 Zillow
- 2026-01-02 Listed $239,877 Zillow
- 2025-11-19 Listed $239,877 HARMLS
Cash-flow waterfall
monthlySold comps — $/sqft
last 12 mo · ≤1 miLoading sold comps…