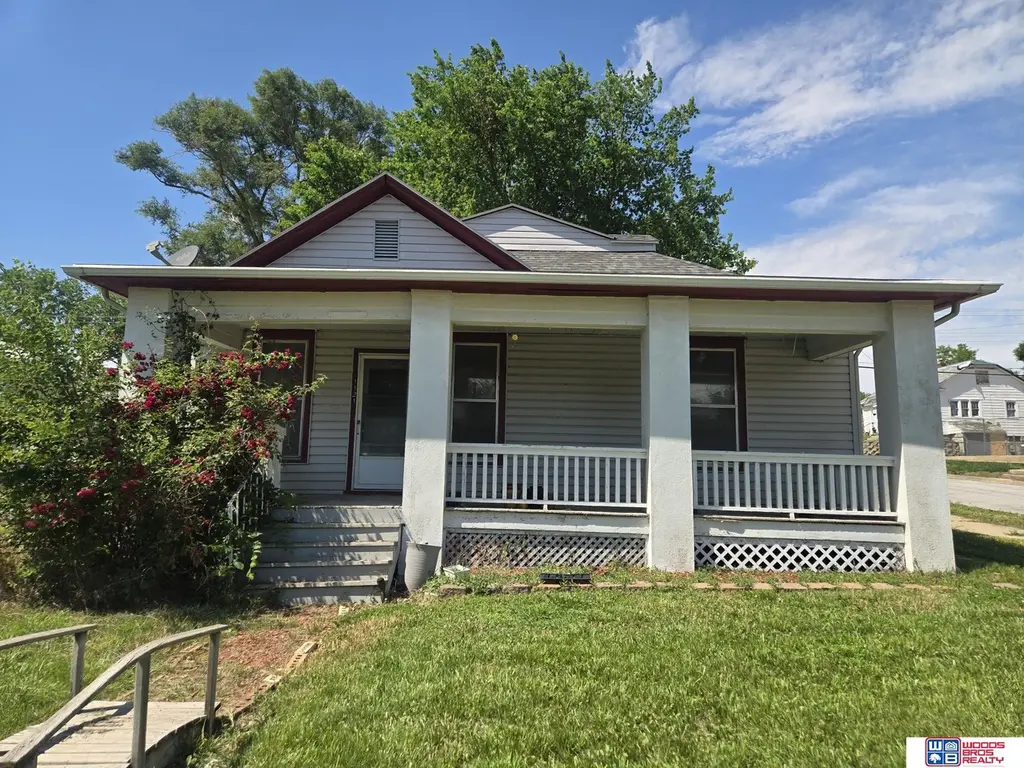
1121 4th St · Fairbury, NE
Flood risk 1/10 · Minimal
- FEMA flood zone
- X (unshaded)
- Chance of flooding over 30 yrs
- 0.0%
- Est. flood insurance / yr
- $473 – $860
Fire risk 6/10 · Moderate
- Est. fire insurance / yr
- $1,161 – $2,155
Heat risk 4/10 · Minor
- Hot days now (above 106°F)
- 7 days/yr
- Hot days in 30 yrs
- 16 days/yr
Wind risk 2/10 · Minimal
- Chance of severe wind over 30 yrs
- —
Air-quality risk 1/10 · Minimal
- Unhealthy air days now
- 0 days/yr
- Unhealthy air days in 30 yrs
- 0 days/yr
Risk factors via First Street. Map © Google.
Why this score? — see what drove the C- grade
The composite is a weighted blend of 9 inputs, each scored 0–100. Each bar is that input's sub-score; the figure is the points it added to the 100-point composite (weight × sub-score).
- Cash flow +16.3/30.0
- ARV discount +15.0/15.0
- DSCR +5.1/10.0
- 1% rule +4.0/10.0
- Livability +3.7/5.0
- Schools +3.2/10.0
- Rent growth +2.5/5.0
- Condition / age +2.5/5.0
- Appreciation +0.0/10.0
$94,000
🖨 Deal sheet (PDF) 📄 Offer letter ✓ Due diligence
Listing remarks MLS
Three bedroom, one bath bungalow on a corner lot. Open living/dining/kitchen, large bath with laundry, lots of storage space! One stall carport, vinyl siding, and many updates at a budget friendly price! Call for a showing!
Key facts
- Large corner lot
- Main-floor laundry
- Near local amenities
Tags
Property features AI
Exterior
- Parking: Detached covered garage (1 car); One parking space total
- Utilities: Public water; Public sewer; Electricity available on property; Natural gas available; Fiber optic available
- Home design: Single-family residence; Residential property; Built in 1900; One or more stories (living area above grade)
- Construction: Composition roof; Stone and concrete perimeter foundation
- Exterior features: Front porch; Covered patio; Corner lot; Lot approximately 0.16 acre (50 x 142)
Interior
- Kitchen: Refrigerator
- Bedrooms: Master bedroom on the main floor; Additional bedrooms on the main floor
- Bathrooms: One full bathroom on the main level
- Heating & cooling: Natural gas forced-air heating; Central air conditioning
- Interior features: Basement present; No fireplaces; Refrigerator included
Neighborhood map
What this means for you Summary
Snapshot
- This is a 3-bed/1.0-bath single-family listed at $94k.
Deal economics
- At list price, monthly cash flow is $52 ($625/yr) — positive.
- The deal already cash-flows at list — no discount required.
- To meet the 1% rule (rent ≥ 1% of price), the offer needs to be $85k (9.6% below list).
- Recommended offer: $85k (9.6% below list) — sets the bar for 1% rule.
- Cap rate 7.0% vs local median 4.6% in Fairbury — top-decile yield for the area; either an underpriced asset or a hidden risk that comps aren't pricing in. Stress-test before assuming the spread holds.
Location & tenants
- Location reads 74/100 on livability (#125 in NE, #4,843 nationally) — a middle-class / working-renter tenant base. Strengths: cost of living A+, housing A+, health & safety A+; Watch: employment D+, amenities F, commute F.
- Fairbury Public Schools (town): math 39% / reading 37% proficiency, ranked #101 of 111 in NE (top 91%) — families likely to look elsewhere, expect single-tenant / working-renter base with shorter leases.
- Zoned schools: Central Elementary School (262 students, 56% FRL); Fairbury Jr-Sr High School (math 42% / reading 42%, grade F, #176 of 261 statewide, top 68%, 377 students, 55% FRL) — zoned schools average 55% FRL vs 39% district-wide (16 pts higher); higher-poverty schools than district average — tighter screening recommended.
- Market conditions: 36 active listings in the ZIP; 1 comparable units currently listed for rent nearby; 9 units permitted in Jefferson County in 2024 (0 in 5+ unit buildings).
Forward outlook
- Local home prices are declining (-3.0%/yr); year-one equity from $650 of loan paydown is wiped out by about $3k of value loss. Plan a longer hold.
- Jefferson County population projected to shrink 6% by 2050 — rents likely to lag national; underwrite the cash flow, not the appreciation.
Negotiation context
- It's been on market 19 days — a 2% lower offer ($93k) is reasonable based on typical stale-listing flexibility.
- 6 sale attempts since 14y ago with the ask held roughly flat each time — persistent listings suggest the price (not the market) is what's stuck; bring a comps-based counter.
- Current owner paid $46k; list at $94k implies a 102% gain — meaningful room to come down on a strong offer.
Risks & watch-outs
- Watch-outs: built in 1900 — expect roof / HVAC / electrical / plumbing capex.
- Climate carrying-cost: major wildfire risk — expect insurance premiums to compound above CPI over the hold.
Questions for the listing agent
- Built in 1900 — when were the roof, HVAC, electrical panel, plumbing, and water heater last replaced?
- Is there a deadline driving the sale (1031 exchange, divorce, estate, relocation)? That informs how much negotiation room exists.
- Schools are D-rated, which usually means shorter tenancies and higher turnover. Who's the typical renter profile here, and what's been the actual vacancy rate?
- What's the average days-on-market for RENTAL listings here right now (not sales)? A rising rental-DOM trend means longer vacancies and softer asking-rent achievability than the comps imply.
- What's the recent tenant-quality profile in this submarket — average credit score on applications, eviction rate, late-payment / NSF rate, and stable-employment percentage? A property-management company in the area should have these aggregated.
- How much new for-sale + rental construction is in the pipeline within 1–3 miles? Heavy new supply typically softens prices + rents 12–24 months out; constrained supply supports both.
Investment metrics
- 1% rule
- 0.90% ✗
- Cap rate
- 6.96%
- Cash-on-cash
- 2.37%
- DSCR
- 1.11
- GRM
- 9.2
CMA / ARV
- ARV (on-the-fly)
- $144,300
- Comps found
- 9
Show comp detail 9 sales within ~0.75 mi
| Address | Dist | Beds/Ba | Sqft | Sold | Price | $/sf | Match |
|---|---|---|---|---|---|---|---|
| 823 8th St | 0.38mi | 3/1.0 | 1,300 (0%) | 1mo | $104,900 | $81 | 81 |
| 920 4th St | 0.18mi | 2/2.0 (-1) | 1,120 (-14%) | 2mo | $180,000 | $161 | 58 |
| 819 L St | 0.33mi | 3/1.5 | 1,440 (+11%) | 9mo | $140,000 | $97 | 58 |
| 925 9th St | 0.40mi | 3/1.0 | 1,204 (-7%) | 14mo | $99,000 | $82 | 58 |
| 728 Mcdowell St | 0.26mi | 2/1.5 (-1) | 1,156 (-11%) | 7mo | $152,000 | $131 | 57 |
| 711 Mcdowell St | 0.23mi | 3/2.0 | 1,174 (-10%) | 17mo | $135,000 | $115 | 55 |
| 621 7th St | 0.45mi | 3/2.0 | 1,452 (+12%) | 8mo | $70,000 | $48 | 49 |
| 1116 Hubble St | 0.56mi | 3/2.0 | 1,276 (-2%) | 23mo | $190,000 | $149 | 48 |
| 1027 F St | 0.69mi | 2/1.0 (-1) | 1,176 (-10%) | 14mo | $130,000 | $111 | 35 |
Match score weights: distance 35% · size 25% · config 20% · recency 20%. Top-matched comps best support the ARV.
Projected returns pro-forma
-3.0% appreciation · 3.0% rent growth · sell at horizon
- IRR
- -12.5%
- Equity multiple
- 0.55×
- Total profit
- $-11,922
- Equity at exit
- $14,016
- IRR
- -3.5%
- Equity multiple
- 0.77×
- Total profit
- $-6,135
- Equity at exit
- $8,127
Cash invested: $26,320 (down + closing). Projections, not guarantees.
Landlord ↔ Tenant lean methodology
- Overall (STATE)
- 83 Strongly Landlord-Friendly
- State Nebraska
- 83 Strongly Landlord-Friendly · R+13
- County
- — inherits STATE
- City
- — inherits STATE
ZIP-level market 68352
- Home prices YoY
- -9.9%
- Active inventory
- 36
- Price-to-rent
- 9.2×
Monthly cashflow live
- Estimated rent
- $850 medium interval (Pro) →
- Mortgage (P&I)
- −$493
- Tax from tax record
- −$87 /mo · $1,048/yr
- Insurance
- −$39
- HOA
- −$0
- Vacancy / Maint / Mgmt
- −$178
- Net cashflow
- $52
Break-even live
Sensitivity live
| Price | -10% $105 | -5% $79 | +0% $52 | +5% $25 | +10% $-1 |
|---|---|---|---|---|---|
| Rent | -10% $-15 | -5% $18 | +0% $52 | +5% $86 | +10% $119 |
| Rate | -1.0pp $99 | -0.5pp $76 | base $52 | +0.5pp $28 | +1.0pp $3 |
UW: 25.0% down · 7.5% · 30yr · 1.5% tax · 5.0% vac · 8.0% maint · 8.0% mgmt
Financing live
Cash to close
- Down payment
- $23,500
- Closing costs
- $2,820
- Reserves months
- —
- Total cash needed
- —
Loan-product check · same deal, 3 products live
Conventional
25% down · 7.5% · 30yr
- Down + closing
- —
- Monthly P&I
- —
- Monthly cashflow
- —
- DSCR
- —
- Eligible?
- —
Personal DTI + credit; lowest rate.
DSCR
20% down · 8.5% · 30yr
- Down + closing
- —
- Monthly P&I
- —
- Monthly cashflow
- —
- DSCR
- —
- Eligible?
- —
No personal income docs; deal must DSCR.
Hard money
10% down · 12.0% · 12mo
- Down + closing
- —
- Monthly P&I
- —
- Monthly cashflow
- —
- DSCR
- —
- Eligible?
- —
Short-term bridge; refi at stabilization.
Rent comps 1 comps
| Address | Beds | Baths | Sqft | Rent | $/sqft | DOM | Units | Dist |
|---|---|---|---|---|---|---|---|---|
| 1011 K St Unit STREET-301 Fairbury, NE | 2.0 | 1.5 | 1088 | $850 | $0.78 | 46d | 1 | 0.50mi |
Listing history 14 events
-
2026-06-21days on market $94,000 Active 19 DOM
-
2026-06-21days on market $94,000 Active 18 DOM
-
2026-06-18days on market $94,000 Active 16 DOM
-
2026-06-17days on market $94,000 Active 15 DOM
-
2026-06-16days on market $94,000 Active 14 DOM
-
2026-06-15days on market $94,000 Active 13 DOM
-
2026-06-13days on market $94,000 Active 11 DOM
-
2026-06-12days on market $94,000 Active 10 DOM
-
2026-06-09days on market $94,000 Active 7 DOM
-
2026-06-08days on market $94,000 Active 6 DOM
-
2026-06-07statusdays on market $94,000 Active 5 DOM
-
2026-06-05days on market $94,000 New 3 DOM
-
2026-06-03remarks 441-char remark
-
2026-06-03$94,000 New 1 DOM
ⓘ Source: listings_history table (triggers on properties + properties_extension) + one-shot
backfill from property_details.listing_events for pre-trigger history.
Tax reassessment forecast NE · Resets to sale price
- Current annual tax
- $1,048 · $87/mo
- Projected year-2 tax
- $1,626 · $136/mo
- Expected delta
- +$578/yr (+$48/mo · 55.2%)
ⓘ Screening estimate from a state-policy table — verify with the county assessor before closing.
Climate risk First Street
- Flood 1/10 Low FEMA zone X (unshaded) · 0% chance over 30 yrs
- Wildfire 6/10 Major
- Heat 4/10 Moderate 7 d/yr ≥106°F today · 16 d/yr by 30 yrs out
- Wind 2/10 Low
- Air quality 1/10 Low 0 unhealthy d/yr today · 0 by 30 yrs out
Nearby sold comps map
Loading sold comps map…
Walkable amenities ~0.75 mi
Loading nearby amenities…
Taxation est. · year 1
- Rental income
- $10,200
- − Mortgage interest
- −$5,265
- − Property taxes
- −$1,048
- − Insurance
- −$470
- − Repairs & maintenance
- −$816
- − Management
- −$816
- − Depreciation
- −$2,735
- Taxable loss
- −$950
- Est. tax savings @ 24.0%
- +$228
- After-tax cash flow
- $853/yr
For passive investors: Depreciation is non-cash, so a rental often shows a tax loss while cash-flowing — sheltering income. Rental losses are passive: they offset passive income freely, and up to $25,000/yr can offset ordinary (W-2) income if you actively participate and your MAGI is under $100k (phasing out to $0 by $150k); unused losses carry forward. On sale, claimed depreciation is recaptured at up to 25%, and gains may owe capital-gains tax (a 1031 exchange can defer both). Figures are a year-1 estimate at your 24.0% rate — not tax advice; consult a CPA.
Schools (NCES district)
- District
- Fairbury Public Schools
- NCES district ID
- 3170440
- Math proficiency
- 39% ▼ -13.00%
- Reading proficiency
- 37% ▲ 4.00%
- Median HH income
- $40,800
- Composite
- 31.97/100
- National rank
- #5842
- State rank
- #101 of 111 in NE
Livability — Fairbury
- Score
- 74/100
- State rank
- #125
- US rank
- #4843
Category grades
Schools grade is shown separately in the Schools card above.
Census & demographics
- Census place
- Fairbury, NE
- Population (ZIP)
- 4,897
Population outlook (Jefferson County) Hauer SSP2
- Today (2025)
- 6,961 people
- By 2030
- 6,831 · -1.9%
- By 2040
- 6,590 · -5.3%
- By 2050
- 6,510 · -6.5%
- By 2075
- 6,831 · -1.9%
- By 2100
- 7,072 · +1.6%
Race, ethnicity, and origin ACS 2023
- Neighborhood character
- Predominantly White (88%)
- Race & ethnicity
- White 88% Hispanic / Latino 7% Two or more races 6%
- Hispanic origin (detail)
- Mexican 5%
- Common ancestry
- Lithuanian 3% Iranian 1% Italian 1%
- Foreign-born
- 2% · Canada
- Languages at home
- 95% English-only · Spanish 4% German/W. Germanic 1%
Political lean MEDSL · Jefferson
- 2024 margin
- Solid R (+45.3) · D 26.7% · R 72.0% · Other 1.4%
- 2008→2024 swing
- -29.6pp toward R · 2008: -15.8pp · 2024: -45.3pp
- All cycles
- 2024: R+45.3 2020: R+42.9 2016: R+45.4 2012: R+28.4 2008: R+15.8
Not yet ingested
- Civics
- —
Market trends
- HPI YoY
- ▼ -25.22%
- Current HPI
- 229.7519
- Rent YoY
- —
- Metro
- —
- State GDP YoY
- ▲ 0.68%
- F500 in state
- 2
Industry mix (Fortune 500 HQ in NE)
| Industry | F500 HQs | Revenue |
|---|---|---|
| Conglomerate | 1 | $371B |
|
||
Price history
+1346.2% since first listed16 events — show timeline
- 2026-06-01 Listed $94,000 GPRMLS
- 2021-08-27 Sold (Public Records) $46,500 Public Records
- 2021-08-27 Sold (MLS) $46,500 GPRMLS
- 2021-07-08 Pending — GPRMLS
- 2021-05-11 Listed $49,500 GPRMLS
- 2018-12-28 Sold (Public Records) $17,500 Public Records
- 2018-12-28 Sold (MLS) $17,500 GPRMLS
- 2018-12-07 Listed $20,499 GPRMLS
- 2016-10-11 Sold (Public Records) $22,500 Public Records
- 2016-10-11 Sold (MLS) $22,500 GPRMLS
- 2016-08-08 Listed $25,000 GPRMLS
- 2015-04-06 Sold (MLS) $21,500 GPRMLS
- 2015-04-03 Sold (Public Records) $21,500 Public Records
- 2015-02-17 Listed $28,900 GPRMLS
- 2013-02-20 Sold (MLS) $6,500 GPRMLS
- 2012-11-10 Listed $1 GPRMLS
Property tax history
+4.7%/yrLatest (2025): $1,048 · -7.5% YoY. Source: county tax records.
Cash-flow waterfall
monthlySold comps — $/sqft
last 12 mo · ≤1 miLoading sold comps…