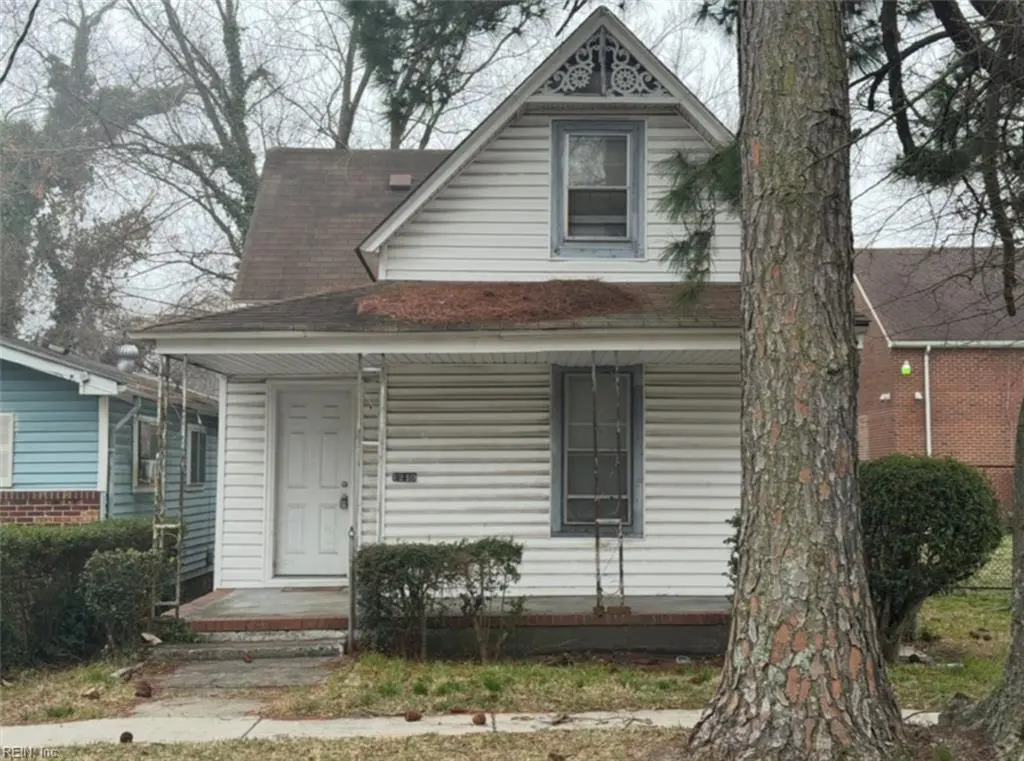
1210 33rd St · Newport News, VA
Flood risk 5/10 · Moderate
- FEMA flood zone
- X (unshaded)
- Chance of flooding over 30 yrs
- 0.66%
- Est. flood insurance / yr
- $507 – $1,088
Fire risk 1/10 · Minimal
- Est. fire insurance / yr
- $666 – $1,236
Heat risk 9/10 · Severe
- Hot days now (above 106°F)
- 7 days/yr
- Hot days in 30 yrs
- 16 days/yr
Wind risk 8/10 · Major
- Chance of severe wind over 30 yrs
- 80.0%
Air-quality risk 2/10 · Minimal
- Unhealthy air days now
- 1 days/yr
- Unhealthy air days in 30 yrs
- 1 days/yr
Risk factors via First Street. Map © Google.
Why this score? — see what drove the A- grade
The composite is a weighted blend of 9 inputs, each scored 0–100. Each bar is that input's sub-score; the figure is the points it added to the 100-point composite (weight × sub-score).
- Cash flow +30.0/30.0
- ARV discount +15.0/15.0
- 1% rule +10.0/10.0
- DSCR +10.0/10.0
- Appreciation +4.6/10.0
- Schools +3.8/10.0
- Livability +3.8/5.0
- Rent growth +3.2/5.0
- Condition / age +2.5/5.0
$84,900
🖨 Deal sheet 📄 Offer letter ✓ Due diligence
Listing remarks MLS
INVESTMENT OPPORTUNITY – – GREAT RENTAL
Key facts
- 3,049 sq ft lot
- Built 1920
- Listed 58 days
Neighborhood map
What this means for you Summary
Snapshot
- This is a 3-bed/1.0-bath single-family listed at $85k.
Deal economics
- At list price, monthly cash flow is $485 ($6k/yr) — positive.
- The deal already cash-flows at list — no discount required.
- Meets the 1% rule at list price ($1k rent vs $85k).
- Recommended offer: $82k (3.0% below list) — sets the bar for market timing.
- Cap rate 13.1% vs local median 4.2% in Newport News — top-decile yield for the area; either an underpriced asset or a hidden risk that comps aren't pricing in. Stress-test before assuming the spread holds.
Location & tenants
- Location reads 75/100 on livability (#123 in VA, #4,018 nationally) — a middle-class / working-renter tenant base. Strengths: health & safety A+, cost of living A, housing A; Watch: crime F, commute F.
- Newport News City Public School District (urban): math 34% / reading 54% proficiency, ranked #112 of 131 in VA (top 86%) — families likely to look elsewhere, expect single-tenant / working-renter base with shorter leases.
- Market conditions: Rents rising (+2.9%/yr); 128 active listings in the ZIP; 40 comparable units currently listed for rent nearby; rentals at typical pace (median 24d on market — plan ~3-4 weeks tenant-placement turnaround); lower-income renter base — watch delinquency; 522 units permitted in Newport News city in 2024 (458 in 5+ unit buildings).
- This rent runs 37% of the median local income ($42k/yr) — at the standard rent-burdened threshold; future hikes will face affordability resistance.
Forward outlook
- Local home prices are declining (-0.8%/yr); year-one equity from $587 of loan paydown is wiped out by about $713 of value loss. Plan a longer hold.
- Newport News County population projected to shrink 8% by 2050 — rents likely to lag national; underwrite the cash flow, not the appreciation.
- At projected returns (-0.8% appreciation + 2.9% rent growth), your $24k cash investment doubles in ~4 years — after that, you're playing with house money.
Negotiation context
- It's been on market 58 days — a 3% lower offer ($82k) is reasonable based on typical stale-listing flexibility.
- Current owner paid $56k; list at $85k implies a 52% gain — meaningful room to come down on a strong offer.
Risks & watch-outs
- Watch-outs: built in 1920 — expect roof / HVAC / electrical / plumbing capex.
- Climate carrying-cost: moderate flood risk; severe wind risk, 80% chance of damaging wind over 30y; extreme-heat days projected 7→16/yr by 2055 (HVAC capex compounding) — expect insurance premiums to compound above CPI over the hold.
Questions for the listing agent
- It's been on market 58 days. Have you received any prior offers? Is the seller open to a 3% concession, seller financing, or rate buy-down credit?
- Built in 1920 — when were the roof, HVAC, electrical panel, plumbing, and water heater last replaced?
- Is there a deadline driving the sale (1031 exchange, divorce, estate, relocation)? That informs how much negotiation room exists.
- Schools are B-rated — typically a magnet for longer-tenancy family renters. What's the average tenant stay here, and is there a school-zone premium baked into asking?
- Crime grade is F in this area — have there been break-ins, vandalism, or insurance claims at this property in the last 3 years? What carrier currently insures it and at what premium?
- What's the average days-on-market for RENTAL listings here right now (not sales)? A rising rental-DOM trend means longer vacancies and softer asking-rent achievability than the comps imply.
- What's the recent tenant-quality profile in this submarket — average credit score on applications, eviction rate, late-payment / NSF rate, and stable-employment percentage? A property-management company in the area should have these aggregated.
- How much new for-sale + rental construction is in the pipeline within 1–3 miles? Heavy new supply typically softens prices + rents 12–24 months out; constrained supply supports both.
Investment metrics
- 1% rule
- 1.55% ✓
- Cap rate
- 13.14%
- Cash-on-cash
- 24.47%
- DSCR
- 2.09
- GRM
- 5.4
CMA / ARV
- ARV (median comp)
- $117,071
- List price
- $84,900
- Delta
- -27.48%
- Verdict
- UNDERPRICED
- Comps
- 20 within 1.0 mi
Show comp detail 12 sales within ~0.75 mi
| Address | Dist | Beds/Ba | Sqft | Sold | Price | $/sf | Match |
|---|---|---|---|---|---|---|---|
| 1210 33rd St | 0.00mi | 3/1.0 | 861 (0%) | 0mo | $83,000 | $96 | 100 |
| 1116 28th St | 0.29mi | 3/1.0 | 836 (-3%) | 4mo | $111,000 | $133 | 78 |
| 3115 Roanoke Ave | 0.22mi | 2/1.0 (-1) | 818 (-5%) | 2mo | $75,000 | $92 | 75 |
| 1432 36th St | 0.36mi | 2/1.0 (-1) | 876 (+2%) | 4mo | $180,000 | $205 | 72 |
| 1042 25th St | 0.46mi | 3/1.0 | 892 (+4%) | 1mo | $95,000 | $107 | 72 |
| 2805 Parish Ave | 0.33mi | 2/1.0 (-1) | 794 (-8%) | 3mo | $107,500 | $135 | 64 |
| 911 36th St | 0.43mi | 3/2.0 | 925 (+7%) | 1mo | $175,000 | $189 | 63 |
| 1003 41st St | 0.53mi | 3/1.0 | 800 (-7%) | 2mo | $199,900 | $250 | 62 |
| 132 Ash Ave | 0.74mi | 2/1.0 (-1) | 850 (-1%) | 2mo | $191,500 | $225 | 57 |
| 1010 27th St | 0.44mi | 3/2.0 | 950 (+10%) | 4mo | $220,000 | $232 | 55 |
| 722 32nd St | 0.72mi | 2/1.0 (-1) | 796 (-8%) | 2mo | $195,000 | $245 | 48 |
| 731 31st St | 0.70mi | 3/1.0 | 969 (+12%) | 3mo | $200,000 | $206 | 44 |
Match score weights: distance 35% · size 25% · config 20% · recency 20%. Top-matched comps best support the ARV.
Projected returns pro-forma
-0.84% appreciation · 2.91% rent growth · sell at horizon
- IRR
- 22.7%
- Equity multiple
- 2.05×
- Total profit
- $24,978
- Equity at exit
- $21,146
- IRR
- 27.8%
- Equity multiple
- 3.88×
- Total profit
- $68,578
- Equity at exit
- $22,765
Cash invested: $23,772 (down + closing). Projections, not guarantees.
Landlord ↔ Tenant lean methodology
- Overall (STATE)
- 55 Moderately Landlord-Leaning
- State Virginia
- 55 Moderately Landlord-Leaning · D+2
- County
- — inherits STATE
- City
- — inherits STATE
ZIP-level market 23607
- Home prices YoY
- -0.3%
- Rents YoY
- 2.9%
- Active inventory
- 128
- Price-to-rent
- 5.4×
Monthly cashflow live
- Estimated rent
- $1,319 high interval (Pro) →
- Mortgage (P&I)
- −$445
- Tax from tax record
- −$77 /mo · $923/yr
- Insurance
- −$35
- HOA
- −$0
- Vacancy / Maint / Mgmt
- −$277
- Net cashflow
- $485
Break-even live
UW: 25.0% down · 7.5% · 30yr · 1.5% tax · 5.0% vac · 8.0% maint · 8.0% mgmt
Financing live
Cash to close
- Down payment
- $21,225
- Closing costs
- $2,547
- Reserves months
- —
- Total cash needed
- —
Loan-product check · same deal, 3 products live
Conventional
25% down · 7.5% · 30yr
- Down + closing
- —
- Monthly P&I
- —
- Monthly cashflow
- —
- DSCR
- —
- Eligible?
- —
Personal DTI + credit; lowest rate.
DSCR
20% down · 8.5% · 30yr
- Down + closing
- —
- Monthly P&I
- —
- Monthly cashflow
- —
- DSCR
- —
- Eligible?
- —
No personal income docs; deal must DSCR.
Hard money
10% down · 12.0% · 12mo
- Down + closing
- —
- Monthly P&I
- —
- Monthly cashflow
- —
- DSCR
- —
- Eligible?
- —
Short-term bridge; refi at stabilization.
Rent comps 40 comps
| Address | Beds | Baths | Sqft | Rent | $/sqft | DOM | Units | Dist |
|---|---|---|---|---|---|---|---|---|
| 1010 36th St Newport News, VA | 2.0 | 1.0 | 775 | $1,095 | $1.41 | 23d | 1 | 0.34mi |
| 1348 28th St Newport News, VA | 2.0 | 1.0 | 997 | $1,350 | $1.35 | 4d | 1 | 0.35mi |
| 1348 28th St Unit NA Newport News, VA | 2.0 | 1.0 | 997 | $1,350 | $1.35 | 23d | 1 | 0.35mi |
| 1239 24th St Newport News, VA | 3.0 | 1.0 | 880 | $1,495 | $1.70 | 43d | 1 | 0.40mi |
| 2314 Chestnut Ave Newport News, VA | 2.0 | 1.0 | 900 | $12,900 | $14.33 | 1d | 1 | 0.41mi |
| 1240 24th St Newport News, VA | 2.0 | 1.0 | 752 | $995 | $1.32 | 23d | 1 | 0.43mi |
| 935 37th St Unit 16 Newport News, VA | 2.0 | 1.0 | 700 | $995 | $1.42 | 43d | 1 | 0.50mi |
| 935 37th St Unit 4 Newport News, VA | 2.0 | 1.0 | 700 | $900 | $1.29 | 23d | 1 | 0.50mi |
| 935 37th St Unit 15 Newport News, VA | 2.0 | 1.0 | 700 | $995 | $1.42 | 7d | 1 | 0.50mi |
| 4111 Orcutt Ave Newport News, VA | 2.0 | 1.0 | 740 | $795 | $1.07 | 3d | 1 | 0.58mi |
| 913 41st St Newport News, VA | 2.0 | 1.5 | 740 | $1,045 | $1.41 | 23d | 1 | 0.59mi |
| 915 41st St Newport News, VA | 2.0 | 1.0 | 740 | $1,045 | $1.41 | 23d | 1 | 0.59mi |
| 4104 Newsome Dr Newport News, VA | 2.0 | 1.0 | 740 | $1,045 | $1.41 | 23d | 1 | 0.61mi |
| 4104 Newsome Dr Newport News, VA | 2.0 | 1.0 | 740 | $1,045 | $1.41 | 43d | 1 | 0.61mi |
| 4218 Newsome Dr Newport News, VA | 2.0 | 1.0 | 740 | $795 | $1.07 | 3d | 1 | 0.62mi |
| 4101 Newsome Dr Newport News, VA | 2.0 | 1.0 | 740 | $1,045 | $1.41 | 23d | 1 | 0.63mi |
| 4224 Newsome Dr Newport News, VA | 2.0 | 1.0 | 740 | $1,045 | $1.41 | 23d | 1 | 0.63mi |
| 4200 Newsome Dr Newport News, VA | 2.0 | 1.0 | 895 | $795 | $0.89 | 23d | 1 | 0.64mi |
| 4107 Newsome Dr Newport News, VA | 2.0 | 1.0 | 740 | $1,045 | $1.41 | 43d | 1 | 0.64mi |
| 4226 Newsome Dr Newport News, VA | 2.0 | 1.0 | 740 | $1,045 | $1.41 | 23d | 1 | 0.64mi |
| 4241 Orcutt Ave Newport News, VA | 2.0 | 1.0 | 740 | $795 | $1.07 | 3d | 1 | 0.64mi |
| 749 31st St Newport News, VA | 3.0 | 2.0 | 1000 | $1,900 | $1.90 | 43d | 1 | 0.64mi |
| 4119 Newsome Dr Newport News, VA | 2.0 | 1.0 | 740 | $1,045 | $1.41 | 23d | 1 | 0.66mi |
| 4163 Newsome Dr Newport News, VA | 2.0 | 1.0 | 740 | $1,045 | $1.41 | 23d | 1 | 0.66mi |
| 4135 Newsome Dr Newport News, VA | 2.0 | 1.0 | 740 | $795 | $1.07 | 3d | 1 | 0.67mi |
| 4263 Newsome Dr Unit 4263 Newport News, VA | 2.0 | 1.0 | 740 | $1,045 | $1.41 | 43d | 1 | 0.67mi |
| 4263 Newsome Dr Newport News, VA | 2.0 | 1.0 | 740 | $795 | $1.07 | 10d | 1 | 0.67mi |
| 841 41st St Newport News, VA | 2.0 | 1.0 | 740 | $795 | $1.07 | 10d | 1 | 0.68mi |
| 4261 Newsome Dr Newport News, VA | 2.0 | 1.0 | 740 | $10,145 | $13.71 | 23d | 1 | 0.68mi |
| 4137 Newsome Dr Newport News, VA | 2.0 | 1.0 | 740 | $795 | $1.07 | 3d | 1 | 0.68mi |
| 4325 Newsome Dr Newport News, VA | 2.0 | 1.0 | 740 | $795 | $1.07 | 3d | 1 | 0.68mi |
| 4325 Newsome Dr Newport News, VA | 2.0 | 1.0 | 740 | $795 | $1.07 | 10d | 1 | 0.68mi |
| 829 22nd St Newport News, VA | 3.0 | 1.5 | 1020 | $1,650 | $1.62 | 43d | 1 | 0.71mi |
| 709 33rd St Unit 1 Newport News, VA | 2.0 | 1.0 | 878 | $1,400 | $1.59 | 17d | 1 | 0.73mi |
| 3206 Madison Ave Newport News, VA | 3.0 | 1.0 | 900 | $1,550 | $1.72 | 10d | 1 | 0.74mi |
| 41 Ash Ave Unit B Newport News, VA | 2.0 | 1.0 | 930 | $1,500 | $1.61 | 23d | 1 | 0.88mi |
| 740 21st St Newport News, VA | 3.0 | 2.0 | 1120 | $2,000 | $1.79 | 43d | 1 | 0.90mi |
| 932 16th St Newport News, VA | 2.0 | 1.0 | 754 | $1,500 | $1.99 | 43d | 1 | 0.93mi |
| 1152 Orcutt Ave Newport News, VA | 3.0 | 1.0 | 947 | $1,375 | $1.45 | 4d | 1 | 0.99mi |
| 417 Greenbriar Ave Hampton, VA | 3.0 | 2.0 | 1007 | $1,695 | $1.68 | 7d | 1 | 1.00mi |
Listing history 5 events
-
2026-05-08status Under Contract 51-char remark
Show marketing remark (51 chars)
INVESTMENT OPPORTUNITY – – GREAT RENTAL
-
2026-05-07price $84,900 51-char remark
Show marketing remark (51 chars)
INVESTMENT OPPORTUNITY – – GREAT RENTAL
-
2026-03-11$89,900 Active 51-char remark
Show marketing remark (51 chars)
INVESTMENT OPPORTUNITY – – GREAT RENTAL
-
2026-02-04soldstatus $56,000
-
1991-11-25soldstatus $7,900
ⓘ Source: listings_history table (triggers on properties + properties_extension) + one-shot
backfill from property_details.listing_events for pre-trigger history.
Tax reassessment forecast VA · Resets to sale price
- Current annual tax
- $923 · $77/mo
- Projected year-2 tax
- $923 · $77/mo
- Expected delta
- $0/yr ($0/mo · 0.0%)
ⓘ Screening estimate from a state-policy table — verify with the county assessor before closing.
Climate risk First Street
- Flood 5/10 Major FEMA zone X (unshaded) · 66% chance over 30 yrs
- Wildfire 1/10 Low
- Heat 9/10 Extreme 7 d/yr ≥106°F today · 16 d/yr by 30 yrs out
- Wind 8/10 Severe 80% chance of damaging wind over 30 yrs
- Air quality 2/10 Low 1 unhealthy d/yr today · 1 by 30 yrs out
Nearby sold comps map
Loading sold comps map…
Walkable amenities ~0.75 mi
Loading nearby amenities…
Taxation est. · year 1
- Rental income
- $15,833
- − Mortgage interest
- −$4,756
- − Property taxes
- −$923
- − Insurance
- −$424
- − Repairs & maintenance
- −$1,267
- − Management
- −$1,267
- − Depreciation
- −$2,470
- Taxable income
- $4,726
- Est. tax owed @ 24.0%
- −$1,134
- After-tax cash flow
- $4,683/yr
For passive investors: Depreciation is non-cash, so a rental often shows a tax loss while cash-flowing — sheltering income. Rental losses are passive: they offset passive income freely, and up to $25,000/yr can offset ordinary (W-2) income if you actively participate and your MAGI is under $100k (phasing out to $0 by $150k); unused losses carry forward. On sale, claimed depreciation is recaptured at up to 25%, and gains may owe capital-gains tax (a 1031 exchange can defer both). Figures are a year-1 estimate at your 24.0% rate — not tax advice; consult a CPA.
Schools (NCES district)
- District
- Newport News City Public School District
- NCES district ID
- 5102640
- Math proficiency
- 34% ▼ -37.00%
- Reading proficiency
- 54% ▼ -10.00%
- Median HH income
- $49,644
- Composite
- 37.7/100
- National rank
- #4360
- State rank
- #112 of 131 in VA
Livability — Newport News
- Score
- 75/100
- State rank
- #123
- US rank
- #4018
Category grades
Schools grade is shown separately in the Schools card above.
Census & demographics
- Census place
- Newport News, VA
- County
- Newport News City · 178,950 people
- City population
- 178,950
- Metro
- Virginia Beach-Norfolk-Newport News, VA-NC
- Population (ZIP)
- 23,096
- Household income
- $42,334
- Rent vs Own
- Severe rent burden
- 2008.0
Population outlook (Newport News County) Hauer SSP2
- Today (2025)
- 181,076 people
- By 2030
- 179,683 · -0.8%
- By 2040
- 174,649 · -3.5%
- By 2050
- 167,407 · -7.5%
- By 2075
- 147,597 · -18.5%
- By 2100
- 122,144 · -32.5%
Race, ethnicity, and origin ACS 2023
- Neighborhood character
- Predominantly Black (75%)
- Race & ethnicity
- Black 75% White 13% Two or more races 7% Hispanic / Latino 6% Asian 1%
- Hispanic origin (detail)
- Mexican 1% Puerto Rican 2%
- Foreign-born
- 3% · Canada
- Languages at home
- 96% English-only · Spanish 3%
Political lean MEDSL · Newport News
- 2024 margin
- Strong D (+28.8) · D 63.7% · R 34.9% · Other 1.4%
- 2008→2024 swing
- +0.1pp no change · 2008: 28.7pp · 2024: 28.8pp
- All cycles
- 2024: D+28.8 2020: D+32.9 2016: D+25.4 2012: D+30.0 2008: D+28.7
Not yet ingested
- Civics
- —
Market trends
- HPI YoY
- ▼ -0.84%
- Current HPI
- 312.4039
- Rent YoY
- ▲ 2.91%
- Metro
- Virginia Beach-Norfolk-Newport News, VA-NC
- State GDP YoY
- ▲ 2.40%
- F500 in state
- 50
Industry mix (Fortune 500 HQ in VA)
| Industry | F500 HQs | Revenue |
|---|---|---|
| Aerospace / Defense | 4 | $236B |
|
||
| Technology / Defense | 3 | $32B |
|
||
| Financial Services | 2 | $176B |
|
||
| Utilities | 2 | $27B |
|
||
| Insurance | 2 | $25B |
|
||
| Technology | 2 | $15B |
|
||
Price history
+974.7% since first listed5 events — show timeline
- 2026-05-08 Pending — REINMLS
- 2026-05-07 Price Changed $84,900 REINMLS
- 2026-03-11 Listed $89,900 REINMLS
- 2026-02-04 Sold (Public Records) $56,000 Public Records
- 1991-11-25 Sold (Public Records) $7,900 Public Records
Property tax history
+4.6%/yrLatest (2026): $923 · +26.4% YoY. Source: county tax records.
Cash-flow waterfall
monthlySold comps — $/sqft
last 12 mo · ≤1 miLoading sold comps…