 🏷️ Likely Rental
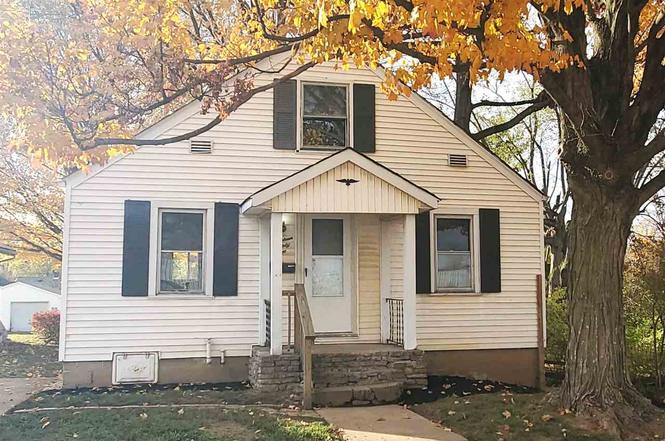
1332 S 6th St · Richmond, IN
Flood risk 1/10 · Minimal
- FEMA flood zone
- X (unshaded)
- Chance of flooding over 30 yrs
- 0.0%
- Est. flood insurance / yr
- $473 – $860
Fire risk 1/10 · Minimal
- Est. fire insurance / yr
- $717 – $1,331
Heat risk 3/10 · Minor
- Hot days now (above 100°F)
- 7 days/yr
- Hot days in 30 yrs
- 18 days/yr
Wind risk 2/10 · Minimal
- Chance of severe wind over 30 yrs
- 1.0%
Air-quality risk 3/10 · Minor
- Unhealthy air days now
- 2 days/yr
- Unhealthy air days in 30 yrs
- 3 days/yr
Risk factors via First Street. Map © Google.
Why this score? — see what drove the B+ grade
The composite is a weighted blend of 9 inputs, each scored 0–100. Each bar is that input's sub-score; the figure is the points it added to the 100-point composite (weight × sub-score).
- Cash flow +30.0/30.0
- ARV discount +15.0/15.0
- 1% rule +10.0/10.0
- DSCR +10.0/10.0
- Livability +4.2/5.0
- Rent growth +2.5/5.0
- Condition / age +2.5/5.0
- Schools +1.9/10.0
- Appreciation +0.0/10.0
$89,900
🖨 Deal sheet 📄 Offer letter ✓ Due diligence
Listing remarks MLS
Exceptional single family 2 bedroom low maintance home in a great location. This ready to go investment is in excellent shape with plenty of opportunity for growth potential. Showing an 10.7% cap rate rented with excellent long term investment opportunity that will pay dividends. This single family home is in good condition. This home has had the same owners for many years, and has ben cared for, as a result the current tenant has been there nearly 10 years. This property is ready for your investment. Call or text Kyle Tom @ 765.220.0199 for your own private tour, or visit kyletom.com for more details or photos.
Key facts
- Solid basement
- Move-in ready
- Large yard
Tags
Property features AI
Exterior
- Parking: Concrete parking
- Utilities: Public water; Public sewer; Cable available
- Home design: Single-family residence; One story
- Construction: Vinyl siding
- Exterior features: Chain link fencing; Asphalt shingle roof
Interior
- Bedrooms: Total of 6 rooms
- Bathrooms: 1 full bathroom
- Heating & cooling: Forced air heating; Natural gas heating
- Interior features: Gas water heater; Basement
Neighborhood map
What this means for you Summary
Snapshot
- This is a 4-bed/1.0-bath single-family listed at $90k.
Deal economics
- At list price, monthly cash flow is $522 ($6k/yr) — positive.
- The deal already cash-flows at list — no discount required.
- Meets the 1% rule at list price ($1k rent vs $90k).
- Recommended offer: $79k (12.0% below list) — sets the bar for market timing.
- Cap rate 13.3% vs local median 5.2% in Richmond — top-decile yield for the area; either an underpriced asset or a hidden risk that comps aren't pricing in. Stress-test before assuming the spread holds.
Location & tenants
- Location reads 83/100 on livability (#10 in IN, #869 nationally) — a professional / high-income tenant draw. Strengths: commute A+, cost of living A+, housing A+; Watch: crime D+, employment D-.
- Richmond Community Schools (town): math 18% / reading 27% proficiency, ranked #270 of 301 in IN (top 90%) — low school quality limits family demand, transient renter base, plan for 1-2y turnover; 65% free/reduced lunch — lower-income household profile, screen leases tightly.
- Zoned schools: Vaile Elementary School (math 17% / reading 22%, grade F, #814 of 994 statewide, top 83%, 304 students, 92% FRL); Richmond High School (math 21% / reading 48%, grade F, #270 of 369 statewide, top 77%, 1,332 students, 66% FRL).
- Market conditions: 273 active listings in the ZIP; 38 units permitted in Wayne County in 2024 (0 in 5+ unit buildings).
- This rent runs 33% of the median local income ($51k/yr) — at the standard rent-burdened threshold; future hikes will face affordability resistance.
Forward outlook
- Local home prices are declining (-3.0%/yr); year-one equity from $622 of loan paydown is wiped out by about $3k of value loss. Plan a longer hold.
- Wayne County population projected at -21% by 2050 — secular population decline; favor cash flow + early exit over multi-decade hold.
- At projected returns (-3.0% appreciation + 3.0% rent growth), your $25k cash investment doubles in ~5 years — after that, you're playing with house money.
Negotiation context
- It's been on market 177 days — a 12% lower offer ($79k) is reasonable based on typical stale-listing flexibility.
- 5 sale attempts since 5y ago; this cycle's ask has dropped $5k (5%) from the opening price — seller is motivated, your offer sets the floor, not the list.
- Current owner paid $40k; list at $90k implies a 125% gain — meaningful room to come down on a strong offer.
Risks & watch-outs
- Watch-outs: built in 1940 — expect roof / HVAC / electrical / plumbing capex.
Questions for the listing agent
- It's been on market 177 days. Have you received any prior offers? Is the seller open to a 12% concession, seller financing, or rate buy-down credit?
- Built in 1940 — when were the roof, HVAC, electrical panel, plumbing, and water heater last replaced?
- Why hasn't it sold? Are there any deal-killer items the seller is aware of (foundation, flood, title, zoning, code violations)?
- Is there a deadline driving the sale (1031 exchange, divorce, estate, relocation)? That informs how much negotiation room exists.
- Schools are D-rated, which usually means shorter tenancies and higher turnover. Who's the typical renter profile here, and what's been the actual vacancy rate?
- Crime grade is D in this area — have there been break-ins, vandalism, or insurance claims at this property in the last 3 years? What carrier currently insures it and at what premium?
- What's the average days-on-market for RENTAL listings here right now (not sales)? A rising rental-DOM trend means longer vacancies and softer asking-rent achievability than the comps imply.
- What's the recent tenant-quality profile in this submarket — average credit score on applications, eviction rate, late-payment / NSF rate, and stable-employment percentage? A property-management company in the area should have these aggregated.
- How much new for-sale + rental construction is in the pipeline within 1–3 miles? Heavy new supply typically softens prices + rents 12–24 months out; constrained supply supports both.
Investment metrics
- 1% rule
- 1.56% ✓
- Cap rate
- 13.26%
- Cash-on-cash
- 24.87%
- DSCR
- 2.11
- GRM
- 5.3
CMA / ARV
- ARV (on-the-fly)
- $134,784
- Comps found
- 12
Show comp detail 12 sales within ~0.75 mi
| Address | Dist | Beds/Ba | Sqft | Sold | Price | $/sf | Match |
|---|---|---|---|---|---|---|---|
| 907 S 7th St | 0.34mi | 4/2.0 | 1,632 (-2%) | 14mo | $20,000 | $12 | 65 |
| 906 S 5th St | 0.29mi | 3/1.0 (-1) | 1,778 (+7%) | 9mo | $120,000 | $67 | 63 |
| 911 S 7th St | 0.34mi | 4/2.0 | 1,728 (+4%) | 16mo | $50,000 | $29 | 61 |
| 906 S 6th St | 0.29mi | 4/1.0 | 1,516 (-9%) | 15mo | $141,000 | $93 | 59 |
| 1441 S 10th St | 0.40mi | 4/1.5 | 1,834 (+10%) | 9mo | $160,000 | $87 | 55 |
| 1221 Abington Pike | 0.59mi | 3/1.5 (-1) | 1,556 (-6%) | 8mo | $179,500 | $115 | 48 |
| 447 S 4th St | 0.68mi | 4/2.0 | 1,704 (+2%) | 18mo | $123,000 | $72 | 45 |
| 109 Lin Kay Pl | 0.52mi | 3/2.0 (-1) | 1,448 (-13%) | 1mo | $120,000 | $83 | 44 |
| 1037 SW 1st St | 0.50mi | 3/2.0 (-1) | 1,468 (-12%) | 9mo | $204,500 | $139 | 41 |
| 617 S 8th St | 0.58mi | 5/2.0 (+1) | 1,898 (+14%) | 5mo | $55,000 | $29 | 36 |
| 735 S 13th St | 0.73mi | 3/2.0 (-1) | 1,485 (-11%) | 10mo | $119,900 | $81 | 31 |
| 1222 S O St | 0.55mi | 3/1.0 (-1) | 1,896 (+14%) | 19mo | $129,500 | $68 | 30 |
Match score weights: distance 35% · size 25% · config 20% · recency 20%. Top-matched comps best support the ARV.
Projected returns pro-forma
-3.0% appreciation · 3.0% rent growth · sell at horizon
- IRR
- 18.3%
- Equity multiple
- 1.74×
- Total profit
- $18,657
- Equity at exit
- $13,404
- IRR
- 26.7%
- Equity multiple
- 3.34×
- Total profit
- $59,024
- Equity at exit
- $7,773
Cash invested: $25,172 (down + closing). Projections, not guarantees.
Landlord ↔ Tenant lean methodology
- Overall (STATE)
- 90 Strongly Landlord-Friendly
- State Indiana
- 90 Strongly Landlord-Friendly · R+11
- County
- — inherits STATE
- City
- — inherits STATE
ZIP-level market 47374
- Active inventory
- 273
- Price-to-rent
- 5.3×
Monthly cashflow live
- Estimated rent
- $1,401 medium interval (Pro) →
- Mortgage (P&I)
- −$471
- Tax from tax record
- −$76 /mo · $912/yr
- Insurance
- −$37
- HOA
- −$0
- Vacancy / Maint / Mgmt
- −$294
- Net cashflow
- $522
Break-even live
UW: 25.0% down · 7.5% · 30yr · 1.5% tax · 5.0% vac · 8.0% maint · 8.0% mgmt
Financing live
Cash to close
- Down payment
- $22,475
- Closing costs
- $2,697
- Reserves months
- —
- Total cash needed
- —
Loan-product check · same deal, 3 products live
Conventional
25% down · 7.5% · 30yr
- Down + closing
- —
- Monthly P&I
- —
- Monthly cashflow
- —
- DSCR
- —
- Eligible?
- —
Personal DTI + credit; lowest rate.
DSCR
20% down · 8.5% · 30yr
- Down + closing
- —
- Monthly P&I
- —
- Monthly cashflow
- —
- DSCR
- —
- Eligible?
- —
No personal income docs; deal must DSCR.
Hard money
10% down · 12.0% · 12mo
- Down + closing
- —
- Monthly P&I
- —
- Monthly cashflow
- —
- DSCR
- —
- Eligible?
- —
Short-term bridge; refi at stabilization.
Listing history 11 events
-
2026-05-20status Pending
-
2026-03-22status Active
-
2026-03-09status Pending
-
2025-12-04price $89,900
-
2025-11-10$94,900 Active
-
2025-09-28historical $1,000
-
2025-09-14$1,000
-
2025-09-13historical $1,000
-
2025-09-12$1,000
-
2021-11-02soldstatus $39,900 619-char remark
Show marketing remark (619 chars)
Exceptional single family 2 bedroom low maintance home in a great location. This ready to go investment is in excellent shape with plenty of opportunity for growth potential. Showing an 10.7% cap rate rented with excellent long term investment opportunity that will pay dividends. This single family home is in good condition. This home has had the same owners for many years, and has ben cared for, as a result the current tenant has been there nearly 10 years. This property is ready for your investment. Call or text Kyle Tom @ 765.220.0199 for your own private tour, or visit kyletom.com for more details or photos.
-
2021-08-09$39,900 619-char remark
Show marketing remark (619 chars)
Exceptional single family 2 bedroom low maintance home in a great location. This ready to go investment is in excellent shape with plenty of opportunity for growth potential. Showing an 10.7% cap rate rented with excellent long term investment opportunity that will pay dividends. This single family home is in good condition. This home has had the same owners for many years, and has ben cared for, as a result the current tenant has been there nearly 10 years. This property is ready for your investment. Call or text Kyle Tom @ 765.220.0199 for your own private tour, or visit kyletom.com for more details or photos.
ⓘ Source: listings_history table (triggers on properties + properties_extension) + one-shot
backfill from property_details.listing_events for pre-trigger history.
Tax reassessment forecast IN · Partial reset (capped growth)
- Current annual tax
- $912 · $76/mo
- Projected year-2 tax
- $912 · $76/mo
- Expected delta
- $0/yr ($0/mo · 0.0%)
ⓘ Screening estimate from a state-policy table — verify with the county assessor before closing.
Climate risk First Street
- Flood 1/10 Low FEMA zone X (unshaded) · 0% chance over 30 yrs
- Wildfire 1/10 Low
- Heat 3/10 Moderate 7 d/yr ≥100°F today · 18 d/yr by 30 yrs out
- Wind 2/10 Low 100% chance of damaging wind over 30 yrs
- Air quality 3/10 Moderate 2 unhealthy d/yr today · 3 by 30 yrs out
Nearby sold comps map
Loading sold comps map…
Walkable amenities ~0.75 mi
Loading nearby amenities…
Taxation est. · year 1
- Rental income
- $16,809
- − Mortgage interest
- −$5,036
- − Property taxes
- −$912
- − Insurance
- −$450
- − Repairs & maintenance
- −$1,345
- − Management
- −$1,345
- − Depreciation
- −$2,615
- Taxable income
- $5,107
- Est. tax owed @ 24.0%
- −$1,226
- After-tax cash flow
- $5,034/yr
For passive investors: Depreciation is non-cash, so a rental often shows a tax loss while cash-flowing — sheltering income. Rental losses are passive: they offset passive income freely, and up to $25,000/yr can offset ordinary (W-2) income if you actively participate and your MAGI is under $100k (phasing out to $0 by $150k); unused losses carry forward. On sale, claimed depreciation is recaptured at up to 25%, and gains may owe capital-gains tax (a 1031 exchange can defer both). Figures are a year-1 estimate at your 24.0% rate — not tax advice; consult a CPA.
Schools (NCES district)
- District
- Richmond Community Schools
- NCES district ID
- 1809510
- Math proficiency
- 18% ▼ -7.00%
- Reading proficiency
- 27% ▼ -2.00%
- Median HH income
- $35,288
- Composite
- 18.55/100
- National rank
- #8913
- State rank
- #270 of 301 in IN
Livability — Richmond
- Score
- 83/100
- State rank
- #10
- US rank
- #869
Category grades
Schools grade is shown separately in the Schools card above.
Census & demographics
- Census place
- Richmond, IN
- County
- Wayne County · 44,615 people
- City population
- 44,615
- Metro
- Richmond, IN
- Population (ZIP)
- 44,615
- Household income
- $50,766
- Rent vs Own
- Severe rent burden
- 1600.0
Population outlook (Wayne County) Hauer SSP2
- Today (2025)
- 63,316 people
- By 2030
- 60,893 · -3.8%
- By 2040
- 55,386 · -12.5%
- By 2050
- 49,946 · -21.1%
- By 2075
- 37,900 · -40.1%
- By 2100
- 26,562 · -58.0%
Race, ethnicity, and origin ACS 2023
- Neighborhood character
- Predominantly White (82%)
- Race & ethnicity
- White 82% Two or more races 7% Black 6% Hispanic / Latino 4% Asian 1%
- Common ancestry
- Slovak 2% Italian 1% Lithuanian 1%
- Foreign-born
- 4% · Canada, China
- Languages at home
- 95% English-only · Spanish 3%
Political lean MEDSL · Wayne
- 2024 margin
- Solid R (+32.5) · D 32.9% · R 65.4% · Other 1.6%
- 2008→2024 swing
- -28.6pp toward R · 2008: -3.9pp · 2024: -32.5pp
- All cycles
- 2024: R+32.5 2020: R+29.1 2016: R+30.1 2012: R+14.7 2008: R+3.9
Not yet ingested
- Civics
- —
Market trends
- HPI YoY
- ▼ -118.64%
- Current HPI
- 182.5038
- Rent YoY
- —
- Metro
- Richmond, IN
- State GDP YoY
- ▲ 2.90%
- F500 in state
- 18
Industry mix (Fortune 500 HQ in IN)
| Industry | F500 HQs | Revenue |
|---|---|---|
| Industrial Machinery | 2 | $37B |
|
||
| Healthcare | 1 | $177B |
|
||
| Pharmaceuticals | 1 | $45B |
|
||
| Metals / Steel | 1 | $18B |
|
||
| Agriculture | 1 | $17B |
|
||
| Packaging | 1 | $12B |
|
||
Price history
+125.3% since first listed11 events — show timeline
- 2026-05-20 Pending — RRELMS
- 2026-03-22 Relisted — RRELMS
- 2026-03-09 Pending — RRELMS
- 2025-12-04 Price Changed $89,900 RRELMS
- 2025-11-10 Listed $94,900 RRELMS
- 2025-09-28 Rental Removed $1,000 LISTANZA
- 2025-09-14 Listed for Rent $1,000 LISTANZA
- 2025-09-13 Rental Removed $1,000 ZUMPER1
- 2025-09-12 Listed for Rent $1,000 ZUMPER1
- 2021-11-02 Sold (MLS) $39,900 RRELMS
- 2021-08-09 Listed $39,900 RRELMS
Property tax history
-2.1%/yrLatest (2024): $912 · +14.0% YoY. Source: county tax records.
Cash-flow waterfall
monthlySold comps — $/sqft
last 12 mo · ≤1 miLoading sold comps…