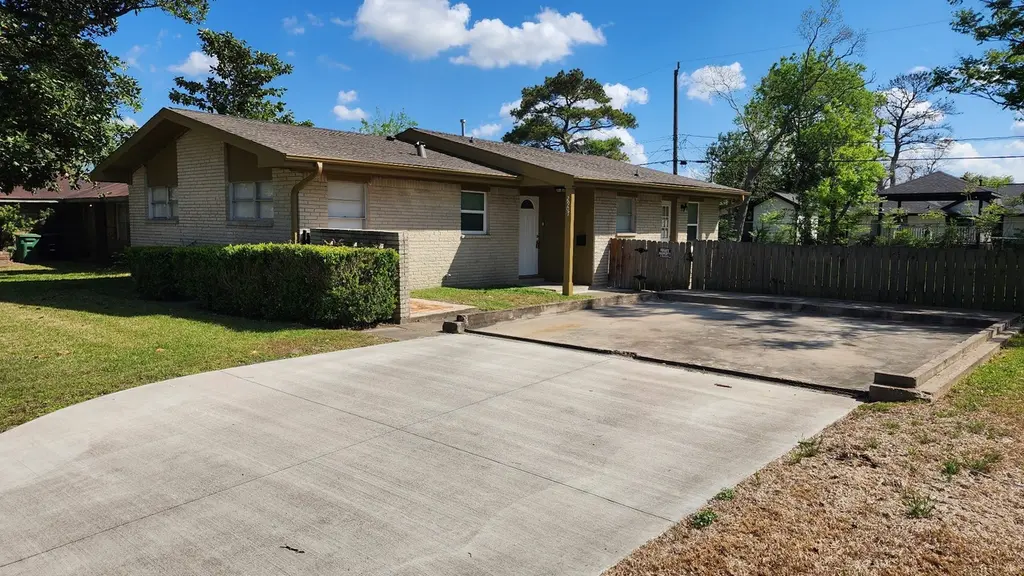
2907 Dragonwick Dr · Houston, TX
Flood risk 6/10 · Moderate
- FEMA flood zone
- X (shaded)
- Chance of flooding over 30 yrs
- 0.73%
- Est. flood insurance / yr
- $507 – $1,088
Fire risk 1/10 · Minimal
- Est. fire insurance / yr
- $1,222 – $2,270
Heat risk 9/10 · Severe
- Hot days now (above 109°F)
- 7 days/yr
- Hot days in 30 yrs
- 23 days/yr
Wind risk 9/10 · Severe
- Chance of severe wind over 30 yrs
- 99.0%
Air-quality risk 2/10 · Minimal
- Unhealthy air days now
- 2 days/yr
- Unhealthy air days in 30 yrs
- 2 days/yr
Risk factors via First Street. Map © Google.
Why this score? — see what drove the D grade
The composite is a weighted blend of 9 inputs, each scored 0–100. Each bar is that input's sub-score; the figure is the points it added to the 100-point composite (weight × sub-score).
- Cash flow +14.0/30.0
- ARV discount +9.9/15.0
- DSCR +4.2/10.0
- 1% rule +4.1/10.0
- Livability +3.7/5.0
- Schools +2.7/10.0
- Condition / age +2.5/5.0
- Rent growth +1.9/5.0
- Appreciation +0.0/10.0
$184,900
🖨 Deal sheet 📄 Offer letter ✓ Due diligence
Listing remarks
Welcome to this beautifully updated 3-bedroom, 2-bath home that perfectly blends comfort and style. From the moment you walk in, you’ll notice the stunning flooring and modern cabinetry that elevate the space. The open-concept kitchen flows seamlessly into the family room—ideal for entertaining or everyday living. Each bedroom is generously sized and offers ample closet space, providing both comfort and functionality. Situated on a spacious lot, the home features a large backyard with plenty of room to relax, play, or create your own outdoor oasis. A double-wide driveway ensures plenty of parking for family and guests. This home is move-in ready and designed for easy living&mdas
Key facts
- Stunning flooring
- Modern cabinetry
- Open-concept kitchen
Tags
Neighborhood map
What this means for you Summary
Snapshot
- This is a 3-bed/2.0-bath single-family listed at $185k.
Deal economics
- At list price, monthly cash flow is $23 ($282/yr) — positive.
- The deal already cash-flows at list — no discount required.
- To meet the 1% rule (rent ≥ 1% of price), the offer needs to be $168k (9.4% below list).
- Recommended offer: $168k (9.4% below list) — sets the bar for 1% rule.
- Cap rate 6.4% vs local median 3.2% in Houston — top-decile yield for the area; either an underpriced asset or a hidden risk that comps aren't pricing in. Stress-test before assuming the spread holds.
Location & tenants
- Location reads 74/100 on livability (#184 in TX, #4,771 nationally) — a middle-class / working-renter tenant base. Strengths: amenities A+, cost of living A+, housing A+; Watch: crime F.
- Houston ISD (urban): math 27% / reading 35% proficiency, ranked #593 of 826 in TX (top 72%) — families likely to look elsewhere, expect single-tenant / working-renter base with shorter leases; 71% free/reduced lunch — lower-income household profile, screen leases tightly.
- Zoned schools: Lawson Middle (math 21% / reading 27%, grade F, #1,301 of 1,662 statewide, top 79%, 1,274 students, 96% FRL); Madison H S (math 9% / reading 17%, grade F, #1,537 of 1,632 statewide, top 94%, 1,924 students, 93% FRL) — zoned schools average 94% FRL vs 71% district-wide (23 pts higher); higher-poverty schools than district average — tighter screening recommended.
- Zoned-school proficiency averages 18% at this address vs 31% district-wide (-12 pts) — the specific schools serving this property underperform the Houston ISD average; the district grade overstates school quality for this exact location.
- Market conditions: Rents soft (-2.4%/yr); 135 active listings in the ZIP; 16 comparable units currently listed for rent nearby; rentals at typical pace (median 16d on market — plan ~3-4 weeks tenant-placement turnaround); 29,883 units permitted in Harris County in 2024 (8,621 in 5+ unit buildings).
- This rent runs 34% of the median local income ($60k/yr) — at the standard rent-burdened threshold; future hikes will face affordability resistance.
Forward outlook
- Local home prices are declining (-3.0%/yr); year-one equity from $1k of loan paydown is wiped out by about $6k of value loss. Plan a longer hold.
- Harris County population projected at +47% by 2050 — long-run rental-demand tailwind backs the buy-and-hold thesis.
Negotiation context
- It's been on market 25 days — a 2% lower offer ($182k) is reasonable based on typical stale-listing flexibility.
- 2 sale attempts; this cycle's ask is 11106% above the opening price — seller raised mid-cycle; expect resistance to lowballs.
Risks & watch-outs
- Climate carrying-cost: major flood risk; severe wind risk, 99% chance of damaging wind over 30y; extreme-heat days projected 7→23/yr by 2055 (HVAC capex compounding) — expect insurance premiums to compound above CPI over the hold.
Questions for the listing agent
- Built in 1960 — when were the roof, HVAC, electrical panel, plumbing, and water heater last replaced?
- Is there a deadline driving the sale (1031 exchange, divorce, estate, relocation)? That informs how much negotiation room exists.
- Schools are D-rated, which usually means shorter tenancies and higher turnover. Who's the typical renter profile here, and what's been the actual vacancy rate?
- Crime grade is F in this area — have there been break-ins, vandalism, or insurance claims at this property in the last 3 years? What carrier currently insures it and at what premium?
- The area grade is low — what's the realistic commute time and amenity access for the typical tenant pool here? Any planned neighborhood developments (good or bad) we should know about?
- What's the average days-on-market for RENTAL listings here right now (not sales)? A rising rental-DOM trend means longer vacancies and softer asking-rent achievability than the comps imply.
- What's the recent tenant-quality profile in this submarket — average credit score on applications, eviction rate, late-payment / NSF rate, and stable-employment percentage? A property-management company in the area should have these aggregated.
- How much new for-sale + rental construction is in the pipeline within 1–3 miles? Heavy new supply typically softens prices + rents 12–24 months out; constrained supply supports both.
Investment metrics
- 1% rule
- 0.91% ✗
- Cap rate
- 6.45%
- Cash-on-cash
- 0.54%
- DSCR
- 1.02
- GRM
- 9.2
CMA / ARV
- ARV (on-the-fly)
- $195,210
- Comps found
- 12
Show comp detail 12 sales within ~0.75 mi
| Address | Dist | Beds/Ba | Sqft | Sold | Price | $/sf | Match |
|---|---|---|---|---|---|---|---|
| 2907 Dragonwick Dr | 0.00mi | 3/2.0 | 1,205 (0%) | 1mo | $184,900 | $153 | 99 |
| 3210 Wuthering Heights Dr | 0.34mi | 3/2.0 | 1,193 (-1%) | 5mo | $225,000 | $189 | 78 |
| 3218 Wuthering Heights Dr | 0.36mi | 3/2.0 | 1,162 (-4%) | 3mo | $194,900 | $168 | 75 |
| 3238 Knotty Oaks Trl | 0.42mi | 3/1.5 | 1,208 (+0%) | 4mo | $170,000 | $141 | 75 |
| 2810 Tidewater Dr | 0.19mi | 4/2.0 (+1) | 1,276 (+6%) | 2mo | $139,999 | $110 | 75 |
| 3135 Trail Lake Dr | 0.37mi | 3/2.0 | 1,164 (-3%) | 6mo | $189,000 | $162 | 72 |
| 3306 Trail Lake Dr | 0.49mi | 3/2.0 | 1,176 (-2%) | 8mo | $189,999 | $162 | 67 |
| 2718 Summertime Dr | 0.31mi | 4/1.0 (+1) | 1,294 (+7%) | 0mo | $165,000 | $128 | 64 |
| 3226 Brookston St | 0.44mi | 3/2.0 | 1,116 (-7%) | 4mo | $209,999 | $188 | 64 |
| 13434 Woodring Dr | 0.64mi | 3/2.0 | 1,241 (+3%) | 7mo | $215,000 | $173 | 60 |
| 2707 Almeda Plaza Dr | 0.30mi | 3/1.0 | 1,032 (-14%) | 4mo | $95,000 | $92 | 55 |
| 3335 Angel Ln | 0.68mi | 3/1.0 | 1,104 (-8%) | 5mo | $179,990 | $163 | 46 |
Match score weights: distance 35% · size 25% · config 20% · recency 20%. Top-matched comps best support the ARV.
Projected returns pro-forma
-3.0% appreciation · 0.0% rent growth · sell at horizon
- IRR
- -18.9%
- Equity multiple
- 0.36×
- Total profit
- $-33,338
- Equity at exit
- $27,569
- IRR
- -19.3%
- Equity multiple
- 0.11×
- Total profit
- $-45,926
- Equity at exit
- $15,987
Cash invested: $51,772 (down + closing). Projections, not guarantees.
Landlord ↔ Tenant lean methodology
- Overall (STATE)
- 87 Strongly Landlord-Friendly
- State Texas
- 87 Strongly Landlord-Friendly · R+5
- County
- — inherits STATE
- City
- — inherits STATE
ZIP-level market 77045
- Home prices YoY
- -7.4%
- Rents YoY
- -2.4%
- Active inventory
- 135
- Price-to-rent
- 9.2×
Monthly cashflow live
- Estimated rent
- $1,676 high interval (Pro) →
- Mortgage (P&I)
- −$970
- Tax from tax record
- −$254 /mo · $3,047/yr
- Insurance
- −$77
- HOA
- −$0
- Vacancy / Maint / Mgmt
- −$352
- Net cashflow
- $23
Break-even live
UW: 25.0% down · 7.5% · 30yr · 1.5% tax · 5.0% vac · 8.0% maint · 8.0% mgmt
Financing live
Cash to close
- Down payment
- $46,225
- Closing costs
- $5,547
- Reserves months
- —
- Total cash needed
- —
Loan-product check · same deal, 3 products live
Conventional
25% down · 7.5% · 30yr
- Down + closing
- —
- Monthly P&I
- —
- Monthly cashflow
- —
- DSCR
- —
- Eligible?
- —
Personal DTI + credit; lowest rate.
DSCR
20% down · 8.5% · 30yr
- Down + closing
- —
- Monthly P&I
- —
- Monthly cashflow
- —
- DSCR
- —
- Eligible?
- —
No personal income docs; deal must DSCR.
Hard money
10% down · 12.0% · 12mo
- Down + closing
- —
- Monthly P&I
- —
- Monthly cashflow
- —
- DSCR
- —
- Eligible?
- —
Short-term bridge; refi at stabilization.
Rent comps 16 comps
| Address | Beds | Baths | Sqft | Rent | $/sqft | DOM | Units | Dist |
|---|---|---|---|---|---|---|---|---|
| 3103 Kelling St Houston, TX | 4.0 | 2.0 | 1311 | $1,619 | $1.23 | 7d | 1 | 0.44mi |
| 3119 Kelling St Houston, TX | 4.0 | 2.0 | 1311 | $1,599 | $1.22 | 43d | 1 | 0.46mi |
| 3150 Kelling St Houston, TX | 4.0 | 2.0 | 1311 | $1,619 | $1.23 | 7d | 1 | 0.47mi |
| 3135 Kelling St Houston, TX | 4.0 | 2.0 | 1311 | $1,599 | $1.22 | 22d | 1 | 0.48mi |
| 3234 Kelling St Houston, TX | 4.0 | 2.0 | 1311 | $1,599 | $1.22 | 24d | 1 | 0.52mi |
| 3239 Kelling St Houston, TX | 4.0 | 2.0 | 1311 | $1,589 | $1.21 | 16d | 1 | 0.55mi |
| 3215 Boynton Dr Houston, TX | 4.0 | 2.0 | 1311 | $1,599 | $1.22 | 24d | 1 | 0.56mi |
| 12806 Buffalo Speedway Houston, TX | 1.0–2.0 | 1.0–2.0 | 916 | $1,636 | $1.79 | 1d | 18 | 0.85mi |
| 6 W Orem Dr Houston, TX | 2.0 | 2.0 | 1138 | $1,380 | $1.21 | 43d | 1 | 1.03mi |
| 2201 W Orem Dr Unit 2148 Houston, TX | 2.0 | 2.0 | 1138 | $1,546 | $1.36 | 3d | 1 | 1.07mi |
| 2201 W Orem Dr Unit 2238 Houston, TX | 2.0 | 2.0 | 1138 | $1,578 | $1.39 | 11d | 1 | 1.07mi |
| 2201 W Orem Dr Unit 2238 Houston, TX | 2.0 | 2.0 | 1138 | $1,579 | $1.39 | 43d | 1 | 1.07mi |
| 2201 W Orem Dr Apt 424 Houston, TX | 2.0 | 2.0 | 1138 | $1,554 | $1.37 | 7d | 1 | 1.07mi |
| 2201 W Orem Dr Unit 2047 Houston, TX | 2.0 | 2.0 | 1138 | $1,589 | $1.40 | 11d | 1 | 1.09mi |
| 11900 Oakmoor Pkwy Houston, TX | 1.0–3.0 | 1.0–2.0 | 892 | $1,469 | $1.65 | 3d | 12 | 1.17mi |
| 14435 Acuna Ln Houston, TX | 3.0 | 2.0 | 1496 | $1,805 | $1.21 | 43d | 1 | 1.24mi |
Listing history 8 events
-
2026-04-29status Pending
-
2026-04-16historical $1,650
-
2026-04-16status Pending
-
2026-04-04$1,650
-
2026-04-03$184,900 Active
-
2018-01-17soldstatus
-
2006-11-01soldstatus
-
1988-01-02soldstatus
ⓘ Source: listings_history table (triggers on properties + properties_extension) + one-shot
backfill from property_details.listing_events for pre-trigger history.
Tax reassessment forecast TX · Resets to sale price
- Current annual tax
- $3,047 · $254/mo
- Projected year-2 tax
- $3,384 · $282/mo
- Expected delta
- +$337/yr (+$28/mo · 11.1%)
ⓘ Screening estimate from a state-policy table — verify with the county assessor before closing.
Climate risk First Street
- Flood 6/10 Major FEMA zone X (shaded) · 73% chance over 30 yrs
- Wildfire 1/10 Low
- Heat 9/10 Extreme 7 d/yr ≥109°F today · 23 d/yr by 30 yrs out
- Wind 9/10 Extreme 99% chance of damaging wind over 30 yrs
- Air quality 2/10 Low 2 unhealthy d/yr today · 2 by 30 yrs out
Nearby sold comps map
Loading sold comps map…
Walkable amenities ~0.75 mi
Loading nearby amenities…
Taxation est. · year 1
- Rental income
- $20,112
- − Mortgage interest
- −$10,357
- − Property taxes
- −$3,047
- − Insurance
- −$924
- − Repairs & maintenance
- −$1,609
- − Management
- −$1,609
- − Depreciation
- −$5,379
- Taxable loss
- −$2,813
- Est. tax savings @ 24.0%
- +$675
- After-tax cash flow
- $957/yr
For passive investors: Depreciation is non-cash, so a rental often shows a tax loss while cash-flowing — sheltering income. Rental losses are passive: they offset passive income freely, and up to $25,000/yr can offset ordinary (W-2) income if you actively participate and your MAGI is under $100k (phasing out to $0 by $150k); unused losses carry forward. On sale, claimed depreciation is recaptured at up to 25%, and gains may owe capital-gains tax (a 1031 exchange can defer both). Figures are a year-1 estimate at your 24.0% rate — not tax advice; consult a CPA.
Schools (NCES district)
- District
- Houston ISD
- NCES district ID
- 4823640
- Math proficiency
- 27% ▼ -18.00%
- Reading proficiency
- 35% ▼ -6.00%
- Median HH income
- $46,054
- Composite
- 26.63/100
- National rank
- #7173
- State rank
- #593 of 826 in TX
Livability — Houston
- Score
- 74/100
- State rank
- #184
- US rank
- #4771
Category grades
Schools grade is shown separately in the Schools card above.
Census & demographics
- Census place
- Houston, TX
- County
- Harris County · 4,702,590 people
- City population
- 3,226,434
- Metro
- Houston-The Woodlands-Sugar Land, TX
- Population (ZIP)
- 33,563
- Household income
- $59,688
- Rent vs Own
- Severe rent burden
- 803.0
Population outlook (Harris County) Hauer SSP2
- Today (2025)
- 5,571,493 people
- By 2030
- 6,089,821 · +9.3%
- By 2040
- 7,142,806 · +28.2%
- By 2050
- 8,185,864 · +46.9%
- By 2075
- 10,574,329 · +89.8%
- By 2100
- 12,109,958 · +117.4%
Race, ethnicity, and origin ACS 2023
- Neighborhood character
- Diverse neighborhood (Simpson 0.56)
- Race & ethnicity
- Hispanic / Latino 54% Black 37% Two or more races 25% White 4% Asian 2% Native American 1%
- Hispanic origin (detail)
- Mexican 37%
- Common ancestry
- Ukrainian 1% Lithuanian 1%
- Foreign-born
- 23% · Canada, Jamaica, China
- Languages at home
- 47% English-only · Spanish 49% Arabic 2% Tagalog/Filipino 1%
Political lean MEDSL · Harris
- 2024 margin
- Lean D (+5.5) · D 52.0% · R 46.4% · Other 1.6%
- 2008→2024 swing
- +3.9pp toward D · 2008: 1.6pp · 2024: 5.5pp
- All cycles
- 2024: D+5.5 2020: D+13.3 2016: D+12.4 2012: D+0.1 2008: D+1.6
Not yet ingested
- Civics
- —
Market trends
- HPI YoY
- ▼ -22.49%
- Current HPI
- 282.5426
- Rent YoY
- ▼ -2.35%
- Metro
- Houston-The Woodlands-Sugar Land, TX
- State GDP YoY
- ▲ 3.95%
- F500 in state
- 110
Industry mix (Fortune 500 HQ in TX)
| Industry | F500 HQs | Revenue |
|---|---|---|
| Energy | 16 | $1,198B |
|
||
| Technology | 5 | $198B |
|
||
| Engineering / Construction | 4 | $72B |
|
||
| Energy Services | 3 | $60B |
|
||
| Utilities | 3 | $41B |
|
||
| Healthcare | 2 | $330B |
|
||
Price history
-99.1% since first listed8 events — show timeline
- 2026-04-29 Pending — HARMLS
- 2026-04-16 Rental Removed $1,650 HARMLS
- 2026-04-16 Pending — HARMLS
- 2026-04-04 Listed for Rent $1,650 HARMLS
- 2026-04-03 Listed $184,900 HARMLS
- 2018-01-17 Sold (Public Records) — Public Records
- 2006-11-01 Sold (Public Records) — Public Records
- 1988-01-02 Sold (Public Records) — Public Records
Property tax history
+5.0%/yrLatest (2025): $3,047 · -10.4% YoY. Source: county tax records.
Cash-flow waterfall
monthlySold comps — $/sqft
last 12 mo · ≤1 miLoading sold comps…