4161 Pine St · Clement, MI
Flood risk 1/10 · Minimal
- FEMA flood zone
- X (unshaded)
- Chance of flooding over 30 yrs
- 0.0%
- Est. flood insurance / yr
- $473 – $860
Fire risk 2/10 · Minimal
- Est. fire insurance / yr
- $784 – $1,456
Heat risk 2/10 · Minimal
- Hot days now (above 95°F)
- 7 days/yr
- Hot days in 30 yrs
- 13 days/yr
Wind risk 1/10 · Minimal
- Chance of severe wind over 30 yrs
- —
Air-quality risk 2/10 · Minimal
- Unhealthy air days now
- 0 days/yr
- Unhealthy air days in 30 yrs
- 1 days/yr
Risk factors via First Street. Map © Google.
Why this score? — see what drove the B grade
The composite is a weighted blend of 9 inputs, each scored 0–100. Each bar is that input's sub-score; the figure is the points it added to the 100-point composite (weight × sub-score).
- Cash flow +30.0/30.0
- ARV discount +15.0/15.0
- DSCR +10.0/10.0
- 1% rule +8.8/10.0
- Schools +2.9/10.0
- Rent growth +2.5/5.0
- Livability +2.5/5.0
- Condition / age +2.5/5.0
- Appreciation +0.0/10.0
$154,900
🖨 Deal sheet 📄 Offer letter ✓ Due diligence
Listing remarks
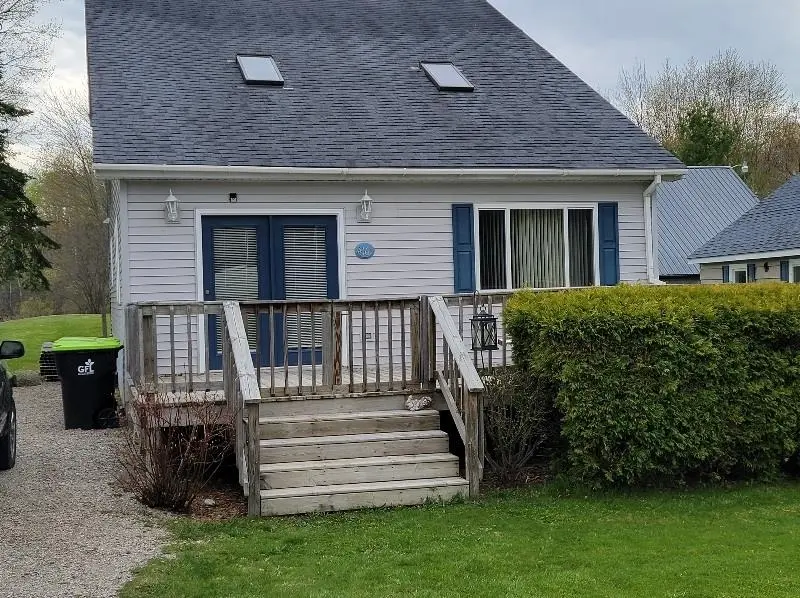
Secord Lake Water Access across the street. Two bedrooms, two bath home move in ready. Natural gas furnace. Newly renovated fresh paint, flooring and carpet. Large great room with vaulted ceilings, overlooking the deck. Primary suite upstairs with 3/4 bathroom overlooking living room. Near thousands of acres of State Land for trail riding or hunting. Come on over an take a look.
Key facts
- Primary suite
- Vaulted ceilings
- Natural gas furnace
Tags
Property features AI
Exterior
- Parking: 3 or more parking spaces
- Utilities: Electricity connected; Internet (Spectrum); Shared private well; Septic system
- Home design: Residential property; 2-story structure; Built in 1999; Interior lake water access
- Construction: Crawl foundation
- Exterior features: Vinyl siding; Deck; Lake view; Lake/river privileges; Subdivision (platted)
Interior
- Kitchen: Kitchen on main level (approx. 15 x 8) with laminate flooring; Dishwasher
- Bedrooms: Main-level bedroom (13 x 10) with carpet; Upper-level bedroom (23 x 23) with carpet; First-floor bedroom
- Flooring: Carpet in primary living areas and bedrooms; Laminate in kitchen and laundry; Vinyl in bathrooms
- Bathrooms: Two full bathrooms; Main-level full bathroom with vinyl flooring (approx. 9 x 5); Upper-level full bathroom with vinyl flooring (approx. 8 x 5)
- Heating & cooling: Forced air heating; Natural gas fuel
- Interior features: 9-foot (or higher) ceilings; First-floor full bathroom
- Laundry & utility: Main-level laundry room (approx. 11 x 7) with laminate flooring
Neighborhood map
What this means for you Summary
Snapshot
- This is a 2-bed/2.0-bath single-family listed at $155k.
Deal economics
- At list price, monthly cash flow is $616 ($7k/yr) — positive.
- The deal already cash-flows at list — no discount required.
- Meets the 1% rule at list price ($2k rent vs $155k).
- Recommended offer: $150k (3.0% below list) — sets the bar for market timing.
Location & tenants
- Location reads: area grade B — affects rentability + tenant quality, not the cash-flow math above.
- West Branch-Rose City Area Schools (rural): math 27% / reading 43% proficiency, ranked #306 of 540 in MI (top 57%) — families likely to look elsewhere, expect single-tenant / working-renter base with shorter leases.
- Market conditions: 287 active listings in the ZIP; 90 units permitted in Gladwin County in 2024 (0 in 5+ unit buildings).
Forward outlook
- Local home prices are declining (-3.0%/yr); year-one equity from $1k of loan paydown is wiped out by about $5k of value loss. Plan a longer hold.
- Gladwin County population projected at -25% by 2050 — secular population decline; favor cash flow + early exit over multi-decade hold.
- At projected returns (-3.0% appreciation + 3.0% rent growth), your $43k cash investment doubles in ~8 years — after that, you're playing with house money.
Negotiation context
- It's been on market 40 days — a 3% lower offer ($150k) is reasonable based on typical stale-listing flexibility.
- 9 sale attempts since 23y ago with the ask held roughly flat each time — persistent listings suggest the price (not the market) is what's stuck; bring a comps-based counter.
- Current owner paid $86k; list at $155k implies a 80% gain — meaningful room to come down on a strong offer.
Questions for the listing agent
- It's been on market 40 days. Have you received any prior offers? Is the seller open to a 3% concession, seller financing, or rate buy-down credit?
- Is there a deadline driving the sale (1031 exchange, divorce, estate, relocation)? That informs how much negotiation room exists.
- What's the average days-on-market for RENTAL listings here right now (not sales)? A rising rental-DOM trend means longer vacancies and softer asking-rent achievability than the comps imply.
- What's the recent tenant-quality profile in this submarket — average credit score on applications, eviction rate, late-payment / NSF rate, and stable-employment percentage? A property-management company in the area should have these aggregated.
- How much new for-sale + rental construction is in the pipeline within 1–3 miles? Heavy new supply typically softens prices + rents 12–24 months out; constrained supply supports both.
Investment metrics
- 1% rule
- 1.38% ✓
- Cap rate
- 11.07%
- Cash-on-cash
- 17.06%
- DSCR
- 1.76
- GRM
- 6.0
CMA / ARV
- ARV (median comp)
- $196,945
- List price
- $154,900
- Delta
- -21.35%
- Verdict
- UNDERPRICED
- Comps
- 20 within 1.0 mi
Show comp detail 5 sales within ~0.75 mi
| Address | Dist | Beds/Ba | Sqft | Sold | Price | $/sf | Match |
|---|---|---|---|---|---|---|---|
| 1543 Loebrich Dr | 0.24mi | 3/2.0 (+1) | 1,544 (+1%) | 10mo | $344,500 | $223 | 74 |
| 4166 Scott Ct | 0.48mi | 2/1.5 | 1,464 (-4%) | 12mo | $320,000 | $219 | 59 |
| 4100 N Three Rivers Rd | 0.20mi | 3/2.0 (+1) | 1,300 (-15%) | 15mo | $169,000 | $130 | 48 |
| 4158 Scott Ct | 0.52mi | 3/2.0 (+1) | 1,710 (+12%) | 9mo | $307,000 | $180 | 44 |
| 4289 Rose Ln | 0.36mi | 3/3.0 (+1) | 1,758 (+15%) | 12mo | $707,500 | $402 | 39 |
Match score weights: distance 35% · size 25% · config 20% · recency 20%. Top-matched comps best support the ARV.
Projected returns pro-forma
-3.0% appreciation · 3.0% rent growth · sell at horizon
- IRR
- 8.3%
- Equity multiple
- 1.33×
- Total profit
- $14,196
- Equity at exit
- $23,096
- IRR
- 17.6%
- Equity multiple
- 2.45×
- Total profit
- $63,052
- Equity at exit
- $13,393
Cash invested: $43,372 (down + closing). Projections, not guarantees.
Landlord ↔ Tenant lean methodology
- Overall (STATE)
- 62 Landlord-Friendly
- State Michigan
- 62 Landlord-Friendly · EVEN
- County
- — inherits STATE
- City
- — inherits STATE
ZIP-level market 48624
- Home prices YoY
- -23.4%
- Active inventory
- 287
- Price-to-rent
- 6.0×
Monthly cashflow live
- Estimated rent
- $2,135 medium interval (Pro) →
- Mortgage (P&I)
- −$812
- Tax est. 1.5%
- −$194 /mo · $2,324/yr
- Insurance
- −$65
- HOA
- −$0
- Vacancy / Maint / Mgmt
- −$448
- Net cashflow
- $616
Break-even live
UW: 25.0% down · 7.5% · 30yr · 1.5% tax · 5.0% vac · 8.0% maint · 8.0% mgmt
Financing live
Cash to close
- Down payment
- $38,725
- Closing costs
- $4,647
- Reserves months
- —
- Total cash needed
- —
Loan-product check · same deal, 3 products live
Conventional
25% down · 7.5% · 30yr
- Down + closing
- —
- Monthly P&I
- —
- Monthly cashflow
- —
- DSCR
- —
- Eligible?
- —
Personal DTI + credit; lowest rate.
DSCR
20% down · 8.5% · 30yr
- Down + closing
- —
- Monthly P&I
- —
- Monthly cashflow
- —
- DSCR
- —
- Eligible?
- —
No personal income docs; deal must DSCR.
Hard money
10% down · 12.0% · 12mo
- Down + closing
- —
- Monthly P&I
- —
- Monthly cashflow
- —
- DSCR
- —
- Eligible?
- —
Short-term bridge; refi at stabilization.
Listing history 34 events
-
2026-06-18days on market $154,900 Active 40 DOM
-
2026-06-17days on market $154,900 Active 39 DOM
-
2026-06-16days on market $154,900 Active 38 DOM
-
2026-06-15days on market $154,900 Active 37 DOM
-
2026-06-13days on market $154,900 Active 35 DOM
-
2026-06-12days on market $154,900 Active 34 DOM
-
2026-06-09days on market $154,900 Active 31 DOM
-
2026-06-08days on market $154,900 Active 30 DOM
-
2026-06-07days on market $154,900 Active 29 DOM
-
2026-06-07days on market $154,900 Active 28 DOM
-
2026-06-04days on market $154,900 Active 25 DOM
-
2026-06-02days on market $154,900 Active 24 DOM
-
2026-06-01days on market $154,900 Active 23 DOM
-
2026-05-31days on market $154,900 Active 22 DOM
-
2026-05-31days on market $154,900 Active 21 DOM
-
2026-05-08$154,900 Active 381-char remark
-
2026-01-01historical
-
2025-06-11$159,900 Active
-
2025-06-02historical
-
2025-01-03status Back on Market
-
2024-12-31historical
-
2024-10-09price $149,900
-
2024-05-24$154,900 Active
-
2024-01-01historical
-
2023-07-19price $149,900
-
2023-05-10$160,000 Active
-
2014-03-04$43,900
-
2013-09-14historical
-
2013-03-10$54,900
-
2012-06-25soldstatus $85,921
-
2006-06-21soldstatus $110,000
-
2004-02-13$119,000
-
2004-02-13historical
-
2003-08-19$139,900
ⓘ Source: listings_history table (triggers on properties + properties_extension) + one-shot
backfill from property_details.listing_events for pre-trigger history.
Climate risk First Street
- Flood 1/10 Low FEMA zone X (unshaded) · 0% chance over 30 yrs
- Wildfire 2/10 Low
- Heat 2/10 Low 7 d/yr ≥95°F today · 13 d/yr by 30 yrs out
- Wind 1/10 Low
- Air quality 2/10 Low 0 unhealthy d/yr today · 1 by 30 yrs out
Nearby sold comps map
Loading sold comps map…
Walkable amenities ~0.75 mi
Loading nearby amenities…
Taxation est. · year 1
- Rental income
- $25,625
- − Mortgage interest
- −$8,677
- − Property taxes
- −$2,324
- − Insurance
- −$774
- − Repairs & maintenance
- −$2,050
- − Management
- −$2,050
- − Depreciation
- −$4,506
- Taxable income
- $5,244
- Est. tax owed @ 24.0%
- −$1,259
- After-tax cash flow
- $6,139/yr
For passive investors: Depreciation is non-cash, so a rental often shows a tax loss while cash-flowing — sheltering income. Rental losses are passive: they offset passive income freely, and up to $25,000/yr can offset ordinary (W-2) income if you actively participate and your MAGI is under $100k (phasing out to $0 by $150k); unused losses carry forward. On sale, claimed depreciation is recaptured at up to 25%, and gains may owe capital-gains tax (a 1031 exchange can defer both). Figures are a year-1 estimate at your 24.0% rate — not tax advice; consult a CPA.
Schools (NCES district)
- District
- West Branch-Rose City Area Schools
- NCES district ID
- 2635850
- Math proficiency
- 27% ▼ -14.00%
- Reading proficiency
- 43% ▼ -10.00%
- Median HH income
- $38,145
- Composite
- 29.15/100
- National rank
- #6580
- State rank
- #306 of 540 in MI
Livability — Clement
No livability data for this city. (Only ~50 U.S. cities are tracked.)
Census & demographics
- Population (ZIP)
- 16,269
Population outlook (Gladwin County) Hauer SSP2
- Today (2025)
- 23,440 people
- By 2030
- 22,281 · -4.9%
- By 2040
- 19,867 · -15.2%
- By 2050
- 17,667 · -24.6%
- By 2075
- 12,909 · -44.9%
- By 2100
- 8,629 · -63.2%
Race, ethnicity, and origin ACS 2023
- Neighborhood character
- Predominantly White (94%)
- Race & ethnicity
- White 94% Two or more races 4% Hispanic / Latino 2%
- Common ancestry
- Romanian 8% Lithuanian 3% Iranian 3%
- Foreign-born
- 1%
- Languages at home
- 95% English-only · German/W. Germanic 4% Spanish 1%
Political lean MEDSL · Gladwin
- 2024 margin
- Solid R (+40.7) · D 29.1% · R 69.8% · Other 1.1%
- 2008→2024 swing
- -42.2pp toward R · 2008: 1.5pp · 2024: -40.7pp
- All cycles
- 2024: R+40.7 2020: R+36.8 2016: R+34.7 2012: R+7.2 2008: D+1.5
Not yet ingested
- Civics
- —
Market trends
- HPI YoY
- ▼ -72.67%
- Current HPI
- 238.0744
- Rent YoY
- —
- Metro
- —
- State GDP YoY
- ▲ 1.37%
- F500 in state
- 28
Industry mix (Fortune 500 HQ in MI)
| Industry | F500 HQs | Revenue |
|---|---|---|
| Automotive Parts | 3 | $48B |
|
||
| Automotive | 2 | $372B |
|
||
| Chemicals | 1 | $45B |
|
||
| Automotive Retail | 1 | $29B |
|
||
| Healthcare / Medical Devices | 1 | $23B |
|
||
| Automotive Technology | 1 | $20B |
|
||
Price history
+10.7% since first listed19 events — show timeline
- 2026-05-08 Listed $154,900 MiRealSource-MiMLS
- 2026-01-01 Listing Removed — MiRealSource-MiMLS
- 2025-06-11 Listed $159,900 MiRealSource-MiMLS
- 2025-06-02 Listing Removed — MiRealSource-MiMLS
- 2025-01-03 Relisted — MiRealSource-MiMLS
- 2024-12-31 Listing Removed — MiRealSource-MiMLS
- 2024-10-09 Price Changed $149,900 MiRealSource-MiMLS
- 2024-05-24 Listed $154,900 MiRealSource-MiMLS
- 2024-01-01 Listing Removed — MiRealSource-MiMLS
- 2023-07-19 Price Changed $149,900 MiRealSource-MiMLS
- 2023-05-10 Listed $160,000 MiRealSource-MiMLS
- 2014-03-04 Listed $43,900 MiRealSource-MiMLS
- 2013-09-14 Listing Removed — MiRealSource-MiMLS
- 2013-03-10 Listed $54,900 MiRealSource-MiMLS
- 2012-06-25 Sold (Public Records) $85,921 Public Records
- 2006-06-21 Sold (Public Records) $110,000 Public Records
- 2004-02-13 Listing Removed — MiRealSource-MiMLS
- 2004-02-13 Listed $119,000 MiRealSource-MiMLS
- 2003-08-19 Listed $139,900 MiRealSource-MiMLS
Property tax history
-15.2%/yrLatest (2024): $286 · +7.8% YoY. Source: county tax records.
Cash-flow waterfall
monthlySold comps — $/sqft
last 12 mo · ≤1 miLoading sold comps…