27 W Tiana Rd Unit A · Hampton Bays, NY
Flood risk 5/10 · Moderate
- FEMA flood zone
- X (unshaded)
- Chance of flooding over 30 yrs
- 0.48%
- Est. flood insurance / yr
- $473 – $860
Fire risk 1/10 · Minimal
- Est. fire insurance / yr
- $691 – $1,283
Heat risk 4/10 · Minor
- Hot days now (above 90°F)
- 7 days/yr
- Hot days in 30 yrs
- 21 days/yr
Wind risk 8/10 · Major
- Chance of severe wind over 30 yrs
- 80.0%
Air-quality risk 3/10 · Minor
- Unhealthy air days now
- 2 days/yr
- Unhealthy air days in 30 yrs
- 3 days/yr
Risk factors via First Street. Map © Google.
Why this score? — see what drove the B grade
The composite is a weighted blend of 9 inputs, each scored 0–100. Each bar is that input's sub-score; the figure is the points it added to the 100-point composite (weight × sub-score).
- Cash flow +28.2/30.0
- ARV discount +14.7/15.0
- DSCR +10.0/10.0
- 1% rule +6.9/10.0
- Rent growth +5.0/5.0
- Schools +4.0/10.0
- Livability +3.4/5.0
- Condition / age +2.5/5.0
- Appreciation +0.0/10.0
$800,000
🖨 Deal sheet 📄 Offer letter ✓ Due diligence
Listing remarks
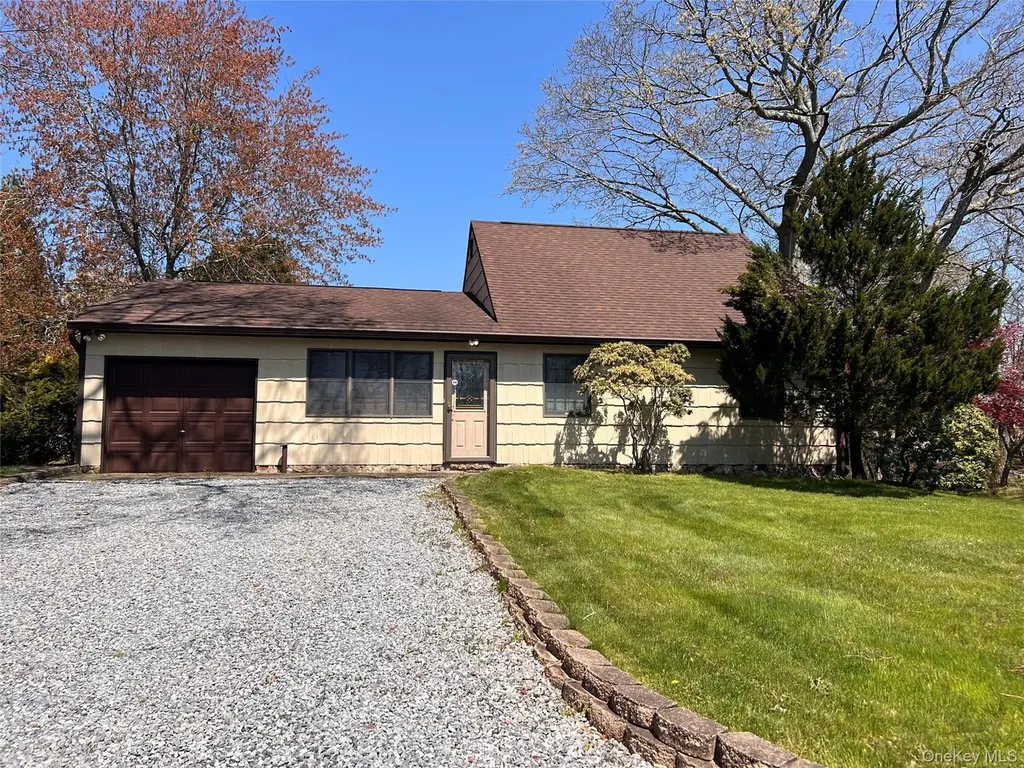
Charming Farm Ranch in the Heart of Hampton Bays Nestled on a generous property in one of Hampton Bays’ most sought-after locations, this warm farm ranch offers classic Hamptons character with smart, long-term updates. The main level features 3 bedrooms, a full bath, and a sun-filled eat-in kitchen. Upstairs, cedar closets and an expansive open space offer endless possibilities — home office, guest suite, studio, and more. Major mechanicals are done: new oil boiler & central A/C (2025), 30-year architectural roof, updated leaders & gutters, sprinkler system, and new storm door. The sprawling flat lot leaves room to add a pool or simply enjoy the open space — a
Key facts
- 0.37 acre lot
- Garage
- Built 1971
Property features AI
Exterior
- Parking: Garage (1 space); No carport
- Utilities: Electricity connected; PSEG electric service; Cesspool sewer
- Home design: Single family residence; Two levels
- Construction: Wood siding construction
- Exterior features: Wood siding; Not waterfront
Interior
- Kitchen: Electric cooktop; Electric oven; Refrigerator
- Bedrooms: Total rooms: 6
- Flooring: Carpet
- Bathrooms: 1 full bathroom
- Heating & cooling: Baseboard heating; Oil heating; Central air conditioning
- Interior features: First-floor bedroom; Eat-in kitchen; Full walkup attic
- Laundry & utility: Washer hookup; Electric dryer hookup
Neighborhood map
What this means for you Summary
Snapshot
- This is a 3-bed/1.0-bath single-family listed at $800k.
Deal economics
- At list price, monthly cash flow is $3k ($30k/yr) — positive.
- The deal already cash-flows at list — no discount required.
- Meets the 1% rule at list price ($10k rent vs $800k).
- Recommended offer: $776k (3.0% below list) — sets the bar for market timing.
- Cap rate 10.1% vs local median 6.4% in Hampton Bays — top-decile yield for the area; either an underpriced asset or a hidden risk that comps aren't pricing in. Stress-test before assuming the spread holds.
Location & tenants
- Location reads 68/100 on livability (#551 in NY) — a middle-class / working-renter tenant base. Strengths: crime A+, employment A+, health & safety B+; Watch: amenities F, commute F, cost of living F.
- Hampton Bays Union Free School District (suburban): math 45% / reading 44% proficiency, ranked #434 of 590 in NY (top 74%) — families likely to look elsewhere, expect single-tenant / working-renter base with shorter leases.
- Zoned schools: Hampton Bays Elementary School (math 32% / reading 52%, grade F, #1,361 of 2,108 statewide, top 67%, 682 students, 55% FRL); Hampton Bays Middle School (math 25% / reading 38%, grade F, #522 of 729 statewide, top 73%, 597 students, 64% FRL); Hampton Bays High School (math 98% / reading 57%, grade A-, #580 of 1,100 statewide, top 53%, 769 students, 53% FRL) — zoned schools average 58% FRL vs 38% district-wide (20 pts higher); higher-poverty schools than district average — tighter screening recommended.
- Market conditions: Rents rising fast (+16.1%/yr); 172 active listings in the ZIP; 14 comparable units currently listed for rent nearby; rentals lingering (median 44d on market — plan ~5-8 weeks vacancy on turnover, expect pricing pressure); 57% of comp listings sitting > 30 days — soft ceiling on asking rent; high-income renter base; 1,366 units permitted in Suffolk County in 2024 (216 in 5+ unit buildings).
- At $9,515/mo this rent would consume 85% of the median local household income ($134k/yr) (locally 199% of renters already pay >50% of income on rent) — very limited rent-growth headroom before tenants either downsize or default.
Forward outlook
- Local home prices are declining (-3.0%/yr); year-one equity from $6k of loan paydown is wiped out by about $24k of value loss. Plan a longer hold.
- Suffolk County population projected to shrink 5% by 2050 — rents likely to lag national; underwrite the cash flow, not the appreciation.
- At projected returns (-3.0% appreciation + 8.0% rent growth), your $224k cash investment doubles in ~7 years — after that, you're playing with house money.
Negotiation context
- It's been on market 43 days — a 3% lower offer ($776k) is reasonable based on typical stale-listing flexibility.
Risks & watch-outs
- Climate carrying-cost: moderate flood risk; severe wind risk, 80% chance of damaging wind over 30y — expect insurance premiums to compound above CPI over the hold.
Questions for the listing agent
- It's been on market 43 days. Have you received any prior offers? Is the seller open to a 3% concession, seller financing, or rate buy-down credit?
- Built in 1971 — when were the roof, HVAC, electrical panel, plumbing, and water heater last replaced?
- Is there a deadline driving the sale (1031 exchange, divorce, estate, relocation)? That informs how much negotiation room exists.
- Schools are B-rated — typically a magnet for longer-tenancy family renters. What's the average tenant stay here, and is there a school-zone premium baked into asking?
- What's the average days-on-market for RENTAL listings here right now (not sales)? A rising rental-DOM trend means longer vacancies and softer asking-rent achievability than the comps imply.
- What's the recent tenant-quality profile in this submarket — average credit score on applications, eviction rate, late-payment / NSF rate, and stable-employment percentage? A property-management company in the area should have these aggregated.
- How much new for-sale + rental construction is in the pipeline within 1–3 miles? Heavy new supply typically softens prices + rents 12–24 months out; constrained supply supports both.
Investment metrics
- 1% rule
- 1.19% ✓
- Cap rate
- 10.09%
- Cash-on-cash
- 13.56%
- DSCR
- 1.60
- GRM
- 7.0
CMA / ARV
- ARV (median comp)
- $951,455
- List price
- $800,000
- Delta
- -15.92%
- Verdict
- UNDERPRICED
- Comps
- 20 within 1.0 mi
Show comp detail 12 sales within ~0.75 mi
| Address | Dist | Beds/Ba | Sqft | Sold | Price | $/sf | Match |
|---|---|---|---|---|---|---|---|
| 53 Shore Rd | 0.34mi | 3/2.5 | 1,390 (-1%) | 10mo | $774,000 | $557 | 68 |
| 3 Vine St | 0.37mi | 3/2.0 | 1,500 (+7%) | 1mo | $785,000 | $523 | 67 |
| 43 West Tiana Rd | 0.16mi | 3/2.0 | 1,248 (-11%) | 12mo | $632,000 | $506 | 60 |
| 35A Neptune Ave | 0.57mi | 4/1.0 (+1) | 1,388 (-1%) | 12mo | $935,000 | $674 | 56 |
| 58 Ocean Ave | 0.37mi | 3/2.0 | 1,600 (+14%) | 4mo | $910,000 | $569 | 53 |
| 10 Rolling Hill Rd | 0.70mi | 3/2.0 | 1,400 (-0%) | 13mo | $1,095,000 | $782 | 52 |
| 54 Ocean Ave | 0.40mi | 3/2.0 | 1,200 (-15%) | 11mo | $705,000 | $588 | 44 |
| 17 Washington Dr | 0.65mi | 3/2.0 | 1,500 (+7%) | 14mo | $1,800,000 | $1,200 | 43 |
| 27 Norwood Rd | 0.68mi | 4/2.0 (+1) | 1,468 (+4%) | 17mo | $919,999 | $627 | 38 |
| 4 Poplar St | 0.70mi | 2/2.0 (-1) | 1,332 (-5%) | 22mo | $735,000 | $552 | 31 |
| 7 Homewood Dr | 0.67mi | 3/2.0 | 1,591 (+13%) | 20mo | $865,000 | $544 | 27 |
| 3 Elm St | 0.69mi | 2/2.0 (-1) | 1,200 (-15%) | 16mo | $735,000 | $613 | 22 |
Match score weights: distance 35% · size 25% · config 20% · recency 20%. Top-matched comps best support the ARV.
Projected returns pro-forma
-3.0% appreciation · 8.0% rent growth · sell at horizon
- IRR
- 8.8%
- Equity multiple
- 1.36×
- Total profit
- $81,646
- Equity at exit
- $119,283
- IRR
- 21.7%
- Equity multiple
- 3.26×
- Total profit
- $506,741
- Equity at exit
- $69,169
Cash invested: $224,000 (down + closing). Projections, not guarantees.
Landlord ↔ Tenant lean methodology
- Overall (STATE)
- 15 Strongly Tenant-Friendly
- State New York
- 15 Strongly Tenant-Friendly · D+10
- County
- — inherits STATE
- City
- — inherits STATE
ZIP-level market 11946
- Home prices YoY
- -20.3%
- Rents YoY
- 16.1%
- Active inventory
- 172
- Price-to-rent
- 7.0×
Monthly cashflow live
- Estimated rent
- $9,515 medium interval (Pro) →
- Mortgage (P&I)
- −$4,195
- Tax from tax record
- −$457 /mo · $5,489/yr
- Insurance
- −$333
- HOA
- −$0
- Vacancy / Maint / Mgmt
- −$1,998
- Net cashflow
- $2,531
Break-even live
UW: 25.0% down · 7.5% · 30yr · 1.5% tax · 5.0% vac · 8.0% maint · 8.0% mgmt
Financing live
Cash to close
- Down payment
- $200,000
- Closing costs
- $24,000
- Reserves months
- —
- Total cash needed
- —
Loan-product check · same deal, 3 products live
Conventional
25% down · 7.5% · 30yr
- Down + closing
- —
- Monthly P&I
- —
- Monthly cashflow
- —
- DSCR
- —
- Eligible?
- —
Personal DTI + credit; lowest rate.
DSCR
20% down · 8.5% · 30yr
- Down + closing
- —
- Monthly P&I
- —
- Monthly cashflow
- —
- DSCR
- —
- Eligible?
- —
No personal income docs; deal must DSCR.
Hard money
10% down · 12.0% · 12mo
- Down + closing
- —
- Monthly P&I
- —
- Monthly cashflow
- —
- DSCR
- —
- Eligible?
- —
Short-term bridge; refi at stabilization.
Rent comps 14 comps
| Address | Beds | Baths | Sqft | Rent | $/sqft | DOM | Units | Dist |
|---|---|---|---|---|---|---|---|---|
| 58 Ocean Ave Hampton Bays, NY | 3.0 | 2.0 | 1600 | $10,000 | $6.25 | 43d | 1 | 0.35mi |
| 73 W Tiana Rd Unit 11 Hampton Bays, NY | 2.0 | 1.0 | 1000 | $11,000 | $11.00 | 43d | 1 | 0.43mi |
| 51 Ocean Ave Hampton Bays, NY | 3.0 | 2.0 | 1200 | $5,000 | $4.17 | 43d | 1 | 0.44mi |
| 45 Bellows Ter Unit B Hampton Bays, NY | 4.0 | 2.0 | 1722 | $7,000 | $4.07 | 43d | 1 | 0.49mi |
| 104 W Tiana Rd Hampton Bays, NY | 3.0 | 1.5 | 900 | $15,000 | $16.67 | 43d | 1 | 0.59mi |
| 6 Rolling Hill Rd Hampton Bays, NY | 3.0 | 3.0 | 1697 | $18,000 | $10.61 | 1d | 1 | 0.69mi |
| 35 Grant Blvd Hampton Bays, NY | 4.0 | 3.0 | 1484 | $35,000 | $23.58 | 24d | 1 | 0.75mi |
| 138 W Tiana Rd Hampton Bays, NY | 3.0 | 1.0 | 1040 | $16,000 | $15.38 | 11d | 1 | 0.77mi |
| 2 Fairview Rd Hampton Bays, NY | 2.0 | 1.0 | 1440 | $17,500 | $12.15 | 17d | 1 | 0.81mi |
| 168 W Tiana Rd Hampton Bays, NY | 3.0 | 2.0 | 1004 | $4,000 | $3.98 | 43d | 1 | 1.05mi |
| 28 Bay Ave W Hampton Bays, NY | 3.0 | 2.5 | 945 | $66,000 | $69.84 | 43d | 1 | 1.11mi |
| 15 Birchwood Ln East Quogue, NY | 3.0 | 3.0 | 1635 | $5,000 | $3.06 | 43d | 1 | 1.13mi |
| 71 Hampton Rd Hampton Bays, NY | 3.0 | 2.5 | 1500 | $18,000 | $12.00 | 24d | 1 | 1.19mi |
| 18 Maryland Blvd Unit 1429741P Hampton Bays, NY | 3.0 | 3.0 | 1732 | $7,445 | $4.30 | 2d | 1 | 1.44mi |
Listing history 15 events
-
2026-06-18days on market $800,000 Active 43 DOM
-
2026-06-17days on market $800,000 Active 42 DOM
-
2026-06-16days on market $800,000 Active 41 DOM
-
2026-06-15days on market $800,000 Active 40 DOM
-
2026-06-13days on market $800,000 Active 38 DOM
-
2026-06-13days on market $800,000 Active 37 DOM
-
2026-06-09days on market $800,000 Active 34 DOM
-
2026-06-08days on market $800,000 Active 33 DOM
-
2026-06-07days on market $800,000 Active 32 DOM
-
2026-06-04days on market $800,000 Active 29 DOM
-
2026-06-03days on market $800,000 Active 28 DOM
-
2026-06-02days on market $800,000 Active 27 DOM
-
2026-06-01days on market $800,000 Active 26 DOM
-
2026-05-31days on market $800,000 Active 25 DOM
-
2026-05-05$895,000 Active 841-char remark
ⓘ Source: listings_history table (triggers on properties + properties_extension) + one-shot
backfill from property_details.listing_events for pre-trigger history.
Tax reassessment forecast NY · Partial reset (capped growth)
- Current annual tax
- $5,489 · $457/mo
- Projected year-2 tax
- $9,505 · $792/mo
- Expected delta
- +$4,015/yr (+$335/mo · 73.1%)
ⓘ Screening estimate from a state-policy table — verify with the county assessor before closing.
Climate risk First Street
- Flood 5/10 Major FEMA zone X (unshaded) · 48% chance over 30 yrs
- Wildfire 1/10 Low
- Heat 4/10 Moderate 7 d/yr ≥90°F today · 21 d/yr by 30 yrs out
- Wind 8/10 Severe 80% chance of damaging wind over 30 yrs
- Air quality 3/10 Moderate 2 unhealthy d/yr today · 3 by 30 yrs out
Nearby sold comps map
Loading sold comps map…
Walkable amenities ~0.75 mi
Loading nearby amenities…
Taxation est. · year 1
- Rental income
- $114,180
- − Mortgage interest
- −$44,812
- − Property taxes
- −$5,489
- − Insurance
- −$4,000
- − Repairs & maintenance
- −$9,134
- − Management
- −$9,134
- − Depreciation
- −$23,273
- Taxable income
- $18,336
- Est. tax owed @ 24.0%
- −$4,401
- After-tax cash flow
- $25,968/yr
For passive investors: Depreciation is non-cash, so a rental often shows a tax loss while cash-flowing — sheltering income. Rental losses are passive: they offset passive income freely, and up to $25,000/yr can offset ordinary (W-2) income if you actively participate and your MAGI is under $100k (phasing out to $0 by $150k); unused losses carry forward. On sale, claimed depreciation is recaptured at up to 25%, and gains may owe capital-gains tax (a 1031 exchange can defer both). Figures are a year-1 estimate at your 24.0% rate — not tax advice; consult a CPA.
Schools (NCES district)
- District
- Hampton Bays Union Free School District
- NCES district ID
- 3613530
- Math proficiency
- 45% ▼ -8.00%
- Reading proficiency
- 44% ▼ -1.00%
- Median HH income
- $70,274
- Composite
- 40.18/100
- National rank
- #3788
- State rank
- #434 of 590 in NY
Livability — Hampton Bays
- Score
- 68/100
- State rank
- #551
- US rank
- #9894
Category grades
Schools grade is shown separately in the Schools card above.
Census & demographics
- Census place
- Hampton Bays, NY
- County
- Suffolk County · 679,920 people
- City population
- 15,819
- Metro
- New York-Newark-Jersey City, NY-NJ-PA
- Population (ZIP)
- 15,819
- Household income
- $133,918
- Rent vs Own
- Severe rent burden
- 199.0
Population outlook (Suffolk County) Hauer SSP2
- Today (2025)
- 1,505,262 people
- By 2030
- 1,498,318 · -0.5%
- By 2040
- 1,471,101 · -2.3%
- By 2050
- 1,424,848 · -5.3%
- By 2075
- 1,337,157 · -11.2%
- By 2100
- 1,217,720 · -19.1%
Race, ethnicity, and origin ACS 2023
- Neighborhood character
- Majority White (62%)
- Race & ethnicity
- White 62% Hispanic / Latino 32% Two or more races 13% Asian 3% Black 2%
- Hispanic origin (detail)
- Mexican 6%
- Common ancestry
- Romanian 4% Slovak 2% Portuguese 2%
- Foreign-born
- 26% · Canada, Jamaica, Guatemala
- Languages at home
- 64% English-only · Spanish 29% Other Indo-European 2% French/Haitian/Cajun 2%
Political lean MEDSL · Suffolk
- 2024 margin
- Lean R (+10.0) · D 45.0% · R 55.0%
- 2008→2024 swing
- -16.0pp toward R · 2008: 6.0pp · 2024: -10.0pp
- All cycles
- 2024: R+10.0 2020: R+0.0 2016: R+8.2 2012: D+2.9 2008: D+6.0
Not yet ingested
- Civics
- —
Market trends
- HPI YoY
- ▼ -118.82%
- Current HPI
- 467.2466
- Rent YoY
- ▲ 16.07%
- Metro
- New York-Newark-Jersey City, NY-NJ-PA
- State GDP YoY
- ▲ 2.60%
- F500 in state
- 92
Industry mix (Fortune 500 HQ in NY)
| Industry | F500 HQs | Revenue |
|---|---|---|
| Financial Services | 10 | $950B |
|
||
| Consumer Goods | 9 | $162B |
|
||
| Insurance | 4 | $225B |
|
||
| Telecommunications | 2 | $144B |
|
||
| Pharmaceuticals | 2 | $112B |
|
||
| Media / Entertainment | 2 | $69B |
|
||
Price history
-10.6% since first listed2 events — show timeline
- 2026-05-21 Price Changed $800,000 OneKey® MLS as Distributed by MLS Grid
- 2026-05-05 Listed $895,000 OneKey® MLS as Distributed by MLS Grid
Property tax history
+1.5%/yrLatest (2022): $5,489 · +0.0% YoY. Source: county tax records.
Cash-flow waterfall
monthlySold comps — $/sqft
last 12 mo · ≤1 miLoading sold comps…