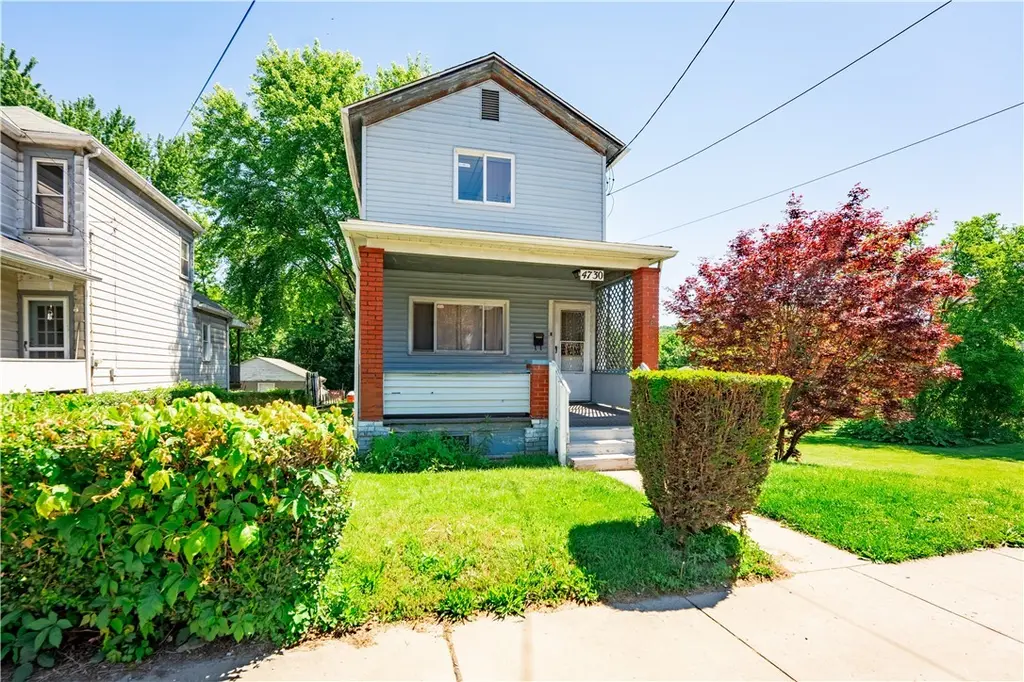
4730 Fourth Ave · Beaver Falls, PA
Flood risk 1/10 · Minimal
- FEMA flood zone
- X (unshaded)
- Chance of flooding over 30 yrs
- 0.0%
- Est. flood insurance / yr
- $473 – $860
Fire risk 1/10 · Minimal
- Est. fire insurance / yr
- $511 – $949
Heat risk 3/10 · Minor
- Hot days now (above 96°F)
- 7 days/yr
- Hot days in 30 yrs
- 18 days/yr
Wind risk 2/10 · Minimal
- Chance of severe wind over 30 yrs
- —
Air-quality risk 3/10 · Minor
- Unhealthy air days now
- 2 days/yr
- Unhealthy air days in 30 yrs
- 4 days/yr
Risk factors via First Street. Map © Google.
Why this score? — see what drove the B- grade
The composite is a weighted blend of 9 inputs, each scored 0–100. Each bar is that input's sub-score; the figure is the points it added to the 100-point composite (weight × sub-score).
- Cash flow +30.0/30.0
- 1% rule +10.0/10.0
- DSCR +10.0/10.0
- ARV discount +7.5/15.0
- Livability +4.2/5.0
- Rent growth +3.3/5.0
- Condition / age +2.5/5.0
- Schools +2.2/10.0
- Appreciation +0.0/10.0
$45,000
🖨 Deal sheet (PDF) 📄 Offer letter ✓ Due diligence
Listing remarks
Calling all investors and handy homeowners! This solid 2-story home is loaded with the right bones and ready for a buyer who wants to build some sweat equity in a comfortable home in a quaint little area of College Hill. Set against a river view backdrop, it sits just 5 minutes from Geneva College and the PA turnpike. The location alone checks every box for commuters and investors alike. The big-ticket items are already done for you: newer roof & some windows (+/- 2 years), newer furnace (5+/-), and a newer water heater, updated 100 amp electric, walk-in shower), replaced sewer line — so your money can go straight into the upgrades you want to make, not the ones you have to. The
Key facts
- Large deck
- River view
- Updated electric
Tags
Property features AI
Exterior
- Parking: Off-street parking for 3 vehicles
- Utilities: Public water; Public sewer
- Home design: 2-story home; Asphalt roof
- Construction: Asphalt roof
- Exterior features: 30 x 130 (approx.) lot dimensions; Resale condition
Interior
- Kitchen: Kitchen (Main) — approx. 15 x 12; Dishwasher; Refrigerator; Stove; Some gas appliances
- Bedrooms: Bedroom 2 (Upper) — approx. 13 x 10; Bedroom 3 (Upper) — approx. 10 x 12; Additional upper bedroom — approx. 13 x 12
- Flooring: Vinyl flooring
- Bathrooms: 1 full bathroom
- Heating & cooling: Forced air heating (gas)
- Interior features: Full walk-out basement; Electric fireplace
- Laundry & utility: Laundry (Lower)
Neighborhood map
What this means for you Summary
Snapshot
- This is a 3-bed/1.0-bath single-family listed at $45k.
Deal economics
- At list price, monthly cash flow is $523 ($6k/yr) — positive.
- The deal already cash-flows at list — no discount required.
- Meets the 1% rule at list price ($1k rent vs $45k).
- Cap rate 20.2% vs local median 7.5% in Beaver Falls — top-decile yield for the area; either an underpriced asset or a hidden risk that comps aren't pricing in. Stress-test before assuming the spread holds.
Location & tenants
- Location reads 84/100 on livability (#93 in PA, #675 nationally) — a professional / high-income tenant draw. Strengths: commute A+, cost of living A+, housing A+; Watch: amenities F, employment F.
- Big Beaver Falls Area SD (suburban): math 16% / reading 37% proficiency, ranked #467 of 539 in PA (top 87%) — low school quality limits family demand, transient renter base, plan for 1-2y turnover; 66% free/reduced lunch — lower-income household profile, screen leases tightly.
- Market conditions: Rents rising (+3.1%/yr); 146 active listings in the ZIP; 2 comparable units currently listed for rent nearby; 272 units permitted in Beaver County in 2024 (80 in 5+ unit buildings).
Forward outlook
- Local home prices are declining (-3.0%/yr); year-one equity from $311 of loan paydown is wiped out by about $1k of value loss. Plan a longer hold.
- Beaver County population projected at -14% by 2050 — secular population decline; favor cash flow + early exit over multi-decade hold.
- At projected returns (-3.0% appreciation + 3.1% rent growth), your $13k cash investment doubles in ~3 years — after that, you're playing with house money.
Negotiation context
- Only 4 days on market — expect competitive offers; lowballing is unlikely to land.
- Current owner paid $10k; list at $45k implies a 374% gain — meaningful room to come down on a strong offer.
Risks & watch-outs
- Watch-outs: property tax is 2.7% of price; built in 1900 — expect roof / HVAC / electrical / plumbing capex.
Questions for the listing agent
- Built in 1900 — when were the roof, HVAC, electrical panel, plumbing, and water heater last replaced?
- Property tax is high relative to price — has the assessment been appealed recently, and will the sale trigger a re-assessment?
- Is there a deadline driving the sale (1031 exchange, divorce, estate, relocation)? That informs how much negotiation room exists.
- Schools are B-rated — typically a magnet for longer-tenancy family renters. What's the average tenant stay here, and is there a school-zone premium baked into asking?
- What's the average days-on-market for RENTAL listings here right now (not sales)? A rising rental-DOM trend means longer vacancies and softer asking-rent achievability than the comps imply.
- What's the recent tenant-quality profile in this submarket — average credit score on applications, eviction rate, late-payment / NSF rate, and stable-employment percentage? A property-management company in the area should have these aggregated.
- How much new for-sale + rental construction is in the pipeline within 1–3 miles? Heavy new supply typically softens prices + rents 12–24 months out; constrained supply supports both.
Investment metrics
- 1% rule
- 2.47% ✓
- Cap rate
- 20.24%
- Cash-on-cash
- 49.82%
- DSCR
- 3.22
- GRM
- 3.4
CMA / ARV
- ARV (on-the-fly)
- $156,160
- Comps found
- 10
Show comp detail 10 sales within ~0.75 mi
| Address | Dist | Beds/Ba | Sqft | Sold | Price | $/sf | Match |
|---|---|---|---|---|---|---|---|
| 4403 W 6th Ave | 0.46mi | 3/2.0 | 1,250 (-2%) | 8mo | $162,500 | $130 | 64 |
| 506 38th St | 0.67mi | 3/2.0 | 1,288 (+1%) | 1mo | $179,900 | $140 | 63 |
| 4727 5th Ave | 0.09mi | 2/1.0 (-1) | 1,136 (-11%) | 16mo | $60,000 | $53 | 59 |
| 4312 W 7th Ave | 0.45mi | 3/1.5 | 1,232 (-4%) | 20mo | $186,000 | $151 | 54 |
| 4724 5th Ave | 0.07mi | 2/1.0 (-1) | 1,088 (-15%) | 18mo | $55,000 | $51 | 52 |
| 3912 College Ave | 0.63mi | 3/1.0 | 1,241 (-3%) | 24mo | $134,000 | $108 | 46 |
| 903 37th Street Ext | 0.71mi | 3/2.0 | 1,148 (-10%) | 3mo | $172,500 | $150 | 43 |
| 3618 6th Ave | 0.73mi | 3/1.0 | 1,176 (-8%) | 15mo | $142,900 | $122 | 40 |
| 208 38th St | 0.73mi | 3/1.0 | 1,196 (-7%) | 23mo | $129,000 | $108 | 36 |
| 3609 6th Ave | 0.75mi | 3/2.0 | 1,416 (+11%) | 19mo | $157,500 | $111 | 27 |
Match score weights: distance 35% · size 25% · config 20% · recency 20%. Top-matched comps best support the ARV.
Projected returns pro-forma
-3.0% appreciation · 3.07% rent growth · sell at horizon
- IRR
- 47.6%
- Equity multiple
- 3.08×
- Total profit
- $26,146
- Equity at exit
- $6,710
- IRR
- 53.3%
- Equity multiple
- 6.25×
- Total profit
- $66,169
- Equity at exit
- $3,891
Cash invested: $12,600 (down + closing). Projections, not guarantees.
Landlord ↔ Tenant lean methodology
- Overall (STATE)
- 62 Landlord-Friendly
- State Pennsylvania
- 62 Landlord-Friendly · EVEN
- County
- — inherits STATE
- City
- — inherits STATE
ZIP-level market 15010
- Home prices YoY
- -22.6%
- Rents YoY
- 3.1%
- Active inventory
- 146
- Price-to-rent
- 3.4×
Monthly cashflow live
- Estimated rent
- $1,113 medium interval (Pro) →
- Mortgage (P&I)
- −$236
- Tax from tax record
- −$102 /mo · $1,222/yr
- Insurance
- −$19
- HOA
- −$0
- Vacancy / Maint / Mgmt
- −$234
- Net cashflow
- $523
Break-even live
Sensitivity live
| Price | -10% $549 | -5% $536 | +0% $523 | +5% $510 | +10% $498 |
|---|---|---|---|---|---|
| Rent | -10% $435 | -5% $479 | +0% $523 | +5% $567 | +10% $611 |
| Rate | -1.0pp $546 | -0.5pp $535 | base $523 | +0.5pp $511 | +1.0pp $500 |
UW: 25.0% down · 7.5% · 30yr · 1.5% tax · 5.0% vac · 8.0% maint · 8.0% mgmt
Financing live
Cash to close
- Down payment
- $11,250
- Closing costs
- $1,350
- Reserves months
- —
- Total cash needed
- —
Loan-product check · same deal, 3 products live
Conventional
25% down · 7.5% · 30yr
- Down + closing
- —
- Monthly P&I
- —
- Monthly cashflow
- —
- DSCR
- —
- Eligible?
- —
Personal DTI + credit; lowest rate.
DSCR
20% down · 8.5% · 30yr
- Down + closing
- —
- Monthly P&I
- —
- Monthly cashflow
- —
- DSCR
- —
- Eligible?
- —
No personal income docs; deal must DSCR.
Hard money
10% down · 12.0% · 12mo
- Down + closing
- —
- Monthly P&I
- —
- Monthly cashflow
- —
- DSCR
- —
- Eligible?
- —
Short-term bridge; refi at stabilization.
Rent comps 2 comps
| Address | Beds | Baths | Sqft | Rent | $/sqft | DOM | Units | Dist |
|---|---|---|---|---|---|---|---|---|
| 4727 5th Ave Beaver Falls, PA | 2.0 | 1.0 | 1136 | $950 | $0.84 | 3d | 1 | 0.11mi |
| 149 Colonial Oaks Beaver Falls, PA | 2.0–4.0 | 1.0–1.5 | 958 | $1,425 | $1.49 | 3d | 1 | 1.25mi |
Listing history 4 events
-
2026-06-07statusdays on market $45,000 Pending 4 DOM
-
2026-06-05days on market $45,000 Active 2 DOM
-
2026-06-03remarks 689-char remark
-
2026-06-03$45,000 Active 1 DOM
ⓘ Source: listings_history table (triggers on properties + properties_extension) + one-shot
backfill from property_details.listing_events for pre-trigger history.
Tax reassessment forecast PA · Partial reset (capped growth)
- Current annual tax
- $1,222 · $102/mo
- Projected year-2 tax
- $1,222 · $102/mo
- Expected delta
- $0/yr ($0/mo · 0.0%)
ⓘ Screening estimate from a state-policy table — verify with the county assessor before closing.
Climate risk First Street
- Flood 1/10 Low FEMA zone X (unshaded) · 0% chance over 30 yrs
- Wildfire 1/10 Low
- Heat 3/10 Moderate 7 d/yr ≥96°F today · 18 d/yr by 30 yrs out
- Wind 2/10 Low
- Air quality 3/10 Moderate 2 unhealthy d/yr today · 4 by 30 yrs out
Nearby sold comps map
Loading sold comps map…
Walkable amenities ~0.75 mi
Loading nearby amenities…
Taxation est. · year 1
- Rental income
- $13,361
- − Mortgage interest
- −$2,521
- − Property taxes
- −$1,222
- − Insurance
- −$225
- − Repairs & maintenance
- −$1,069
- − Management
- −$1,069
- − Depreciation
- −$1,309
- Taxable income
- $5,947
- Est. tax owed @ 24.0%
- −$1,427
- After-tax cash flow
- $4,850/yr
For passive investors: Depreciation is non-cash, so a rental often shows a tax loss while cash-flowing — sheltering income. Rental losses are passive: they offset passive income freely, and up to $25,000/yr can offset ordinary (W-2) income if you actively participate and your MAGI is under $100k (phasing out to $0 by $150k); unused losses carry forward. On sale, claimed depreciation is recaptured at up to 25%, and gains may owe capital-gains tax (a 1031 exchange can defer both). Figures are a year-1 estimate at your 24.0% rate — not tax advice; consult a CPA.
Schools (NCES district)
- District
- Big Beaver Falls Area SD
- NCES district ID
- 4203630
- Math proficiency
- 16% ▼ -11.00%
- Reading proficiency
- 37% ▼ -15.00%
- Median HH income
- $35,686
- Composite
- 21.85/100
- National rank
- #8241
- State rank
- #467 of 539 in PA
Livability — Beaver Falls
- Score
- 84/100
- State rank
- #93
- US rank
- #675
Category grades
Schools grade is shown separately in the Schools card above.
Census & demographics
- Census place
- Beaver Falls, PA
- County
- Beaver County · 116,001 people
- City population
- 28,542
- Metro
- Pittsburgh, PA
- Population (ZIP)
- 28,542
- Household income
- $71,200
- Rent vs Own
- Severe rent burden
- 519.0
Population outlook (Beaver County) Hauer SSP2
- Today (2025)
- 164,976 people
- By 2030
- 161,449 · -2.1%
- By 2040
- 151,752 · -8.0%
- By 2050
- 141,155 · -14.4%
- By 2075
- 118,142 · -28.4%
- By 2100
- 91,740 · -44.4%
Race, ethnicity, and origin ACS 2023
- Neighborhood character
- Predominantly White (85%)
- Race & ethnicity
- White 85% Black 9% Two or more races 4% Hispanic / Latino 1%
- Common ancestry
- Romanian 5% Slovak 2% Iranian 1%
- Foreign-born
- 2% · Canada
- Languages at home
- 98% English-only · Spanish 1%
Political lean MEDSL · Beaver
- 2024 margin
- Strong R (+20.7) · D 39.2% · R 59.9%
- 2008→2024 swing
- -17.9pp toward R · 2008: -2.8pp · 2024: -20.7pp
- All cycles
- 2024: R+20.7 2020: R+17.7 2016: R+20.1 2012: R+6.6 2008: R+2.8
Not yet ingested
- Civics
- —
Market trends
- HPI YoY
- ▼ -76.25%
- Current HPI
- 261.2703
- Rent YoY
- ▲ 3.07%
- Metro
- Pittsburgh, PA
- State GDP YoY
- ▲ 1.68%
- F500 in state
- 34
Industry mix (Fortune 500 HQ in PA)
| Industry | F500 HQs | Revenue |
|---|---|---|
| Healthcare | 2 | $309B |
|
||
| Insurance | 2 | $27B |
|
||
| Telecommunications / Media | 1 | $124B |
|
||
| Industrial Distribution | 1 | $22B |
|
||
| Financial Services | 1 | $20B |
|
||
| Chemicals / Materials | 1 | $18B |
|
||
Price history
+373.7% since first listed2 events — show timeline
- 2026-06-02 Listed $45,000 West Penn MLS
- 1967-03-01 Sold (Public Records) $9,500 Public Records
Property tax history
+3.5%/yrLatest (2026): $1,222 · +0.0% YoY. Source: county tax records.
Cash-flow waterfall
monthlySold comps — $/sqft
last 12 mo · ≤1 miLoading sold comps…