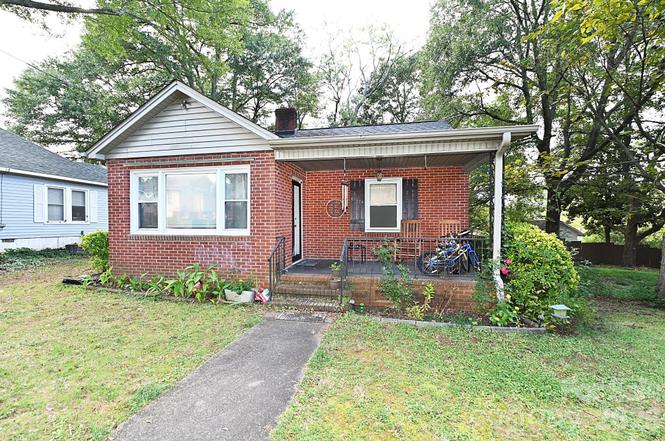
614 S Ashe Ave · Newton, NC
Flood risk 1/10 · Minimal
- FEMA flood zone
- X (unshaded)
- Chance of flooding over 30 yrs
- 0.0%
- Est. flood insurance / yr
- $507 – $1,088
Fire risk 1/10 · Minimal
- Est. fire insurance / yr
- $906 – $1,684
Heat risk 5/10 · Moderate
- Hot days now (above 103°F)
- 7 days/yr
- Hot days in 30 yrs
- 17 days/yr
Wind risk 3/10 · Minor
- Chance of severe wind over 30 yrs
- 4.0%
Air-quality risk 3/10 · Minor
- Unhealthy air days now
- 2 days/yr
- Unhealthy air days in 30 yrs
- 3 days/yr
Risk factors via First Street. Map © Google.
Why this score? — see what drove the D- grade
The composite is a weighted blend of 9 inputs, each scored 0–100. Each bar is that input's sub-score; the figure is the points it added to the 100-point composite (weight × sub-score).
- Cash flow +15.0/30.0
- DSCR +4.6/10.0
- Schools +4.0/10.0
- Livability +3.7/5.0
- 1% rule +3.2/10.0
- Rent growth +2.5/5.0
- Condition / age +2.5/5.0
- ARV discount +0.0/15.0
- Appreciation +0.0/10.0
$178,500
🖨 Deal sheet (PDF) 📄 Offer letter ✓ Due diligence
Listing remarks
Charming two-bedroom, one-bath brick bungalow offering comfortable one level living space. Conveniently located within walking distance of downtown Newton, you’ll enjoy easy access to shopping, dining, schools, and a nearby park. Quick connections to NC Highway 16 and Highway 321 make commuting a breeze. With city utilities and a prime in-town location, this home is an excellent opportunity for a starter home, investment property or downsizing. Some photos virtually staged.
Key facts
- Brick bungalow
- Nearby park
- One level living
Tags
Property features AI
Finance
- HOA & community: No HOA
Exterior
- Parking: Driveway
- Utilities: City water; Public sewer
- Home design: Single-family residence; Site-built construction; One story
- Construction: Exterior clad in aluminum, full brick, and vinyl; Crawl space foundation
- Exterior features: Covered patio/porch; Level lot; Roads are gravel and paved; publicly maintained
Interior
- Kitchen: Refrigerator included
- Bedrooms: 2 bedrooms on the main level
- Bathrooms: 1 full bathroom on the main level
- Heating & cooling: Forced air heating (natural gas); Central air conditioning
- Interior features: 7 total rooms; Living room fireplace (wood-burning or gas not specified)
- Laundry & utility: Laundry on the main level
Neighborhood map
What this means for you Summary
Snapshot
- This is a 2-bed/1.0-bath single-family listed at $178k.
Deal economics
- At list price, monthly cash flow is $57 ($686/yr) — positive.
- The deal already cash-flows at list — no discount required.
- To meet the 1% rule (rent ≥ 1% of price), the offer needs to be $147k (17.9% below list).
- Recommended offer: $147k (17.9% below list) — sets the bar for 1% rule.
- Cap rate 6.7% vs local median 2.9% in Newton — top-decile yield for the area; either an underpriced asset or a hidden risk that comps aren't pricing in. Stress-test before assuming the spread holds.
Location & tenants
- Location reads 73/100 on livability (#77 in NC) — a middle-class / working-renter tenant base. Strengths: cost of living A+, housing A+, health & safety A+; Watch: employment C-, crime D+, amenities F.
- Newton Conover City Schools (suburban): math 49% / reading 47% proficiency, ranked #74 of 178 in NC (top 42%) — families likely to look elsewhere, expect single-tenant / working-renter base with shorter leases.
- Zoned schools: South Newton Elementary (math 37% / reading 32%, grade F, #835 of 1,410 statewide, top 62%, 350 students, 75% FRL); Newton-Conover Middle (math 43% / reading 48%, grade D+, #154 of 475 statewide, top 33%, 603 students, 65% FRL); Newton-Conover High (math 57% / reading 52%, grade C-, #270 of 535 statewide, top 52%, 758 students, 59% FRL).
- Market conditions: 229 active listings in the ZIP; 2 comparable units currently listed for rent nearby; 2,016 units permitted in Catawba County in 2024 (255 in 5+ unit buildings).
Forward outlook
- Local home prices are declining (-3.0%/yr); year-one equity from $1k of loan paydown is wiped out by about $5k of value loss. Plan a longer hold.
- Catawba County population projected to shrink 7% by 2050 — rents likely to lag national; underwrite the cash flow, not the appreciation.
Negotiation context
- It's been on market 109 days — a 9% lower offer ($162k) is reasonable based on typical stale-listing flexibility.
- 2 sale attempts with the ask held roughly flat each time — persistent listings suggest the price (not the market) is what's stuck; bring a comps-based counter.
- Current owner paid $87k; list at $178k implies a 105% gain — meaningful room to come down on a strong offer.
Risks & watch-outs
- Watch-outs: built in 1948 — expect roof / HVAC / electrical / plumbing capex.
- Climate carrying-cost: extreme-heat days projected 7→17/yr by 2055 (HVAC capex compounding) — expect insurance premiums to compound above CPI over the hold.
Questions for the listing agent
- It's been on market 109 days. Have you received any prior offers? Is the seller open to a 18% concession, seller financing, or rate buy-down credit?
- Built in 1948 — when were the roof, HVAC, electrical panel, plumbing, and water heater last replaced?
- Why hasn't it sold? Are there any deal-killer items the seller is aware of (foundation, flood, title, zoning, code violations)?
- Is there a deadline driving the sale (1031 exchange, divorce, estate, relocation)? That informs how much negotiation room exists.
- Schools are D-rated, which usually means shorter tenancies and higher turnover. Who's the typical renter profile here, and what's been the actual vacancy rate?
- Crime grade is D in this area — have there been break-ins, vandalism, or insurance claims at this property in the last 3 years? What carrier currently insures it and at what premium?
- The area grade is low — what's the realistic commute time and amenity access for the typical tenant pool here? Any planned neighborhood developments (good or bad) we should know about?
- What's the average days-on-market for RENTAL listings here right now (not sales)? A rising rental-DOM trend means longer vacancies and softer asking-rent achievability than the comps imply.
- What's the recent tenant-quality profile in this submarket — average credit score on applications, eviction rate, late-payment / NSF rate, and stable-employment percentage? A property-management company in the area should have these aggregated.
- How much new for-sale + rental construction is in the pipeline within 1–3 miles? Heavy new supply typically softens prices + rents 12–24 months out; constrained supply supports both.
Investment metrics
- 1% rule
- 0.82% ✗
- Cap rate
- 6.68%
- Cash-on-cash
- 1.37%
- DSCR
- 1.06
- GRM
- 10.1
CMA / ARV
- ARV (on-the-fly)
- $152,320
- Comps found
- 12
Show comp detail 12 sales within ~0.75 mi
| Address | Dist | Beds/Ba | Sqft | Sold | Price | $/sf | Match |
|---|---|---|---|---|---|---|---|
| 614 S Ashe Ave | 0.00mi | 2/1.0 | 984 (+10%) | 1mo | $167,500 | $170 | 83 |
| 1051 S Brady Ave | 0.52mi | 2/1.5 | 930 (+4%) | 12mo | $205,000 | $220 | 58 |
| 306 E Herman St | 0.29mi | 3/1.0 (+1) | 955 (+7%) | 17mo | $107,000 | $112 | 57 |
| 317 S Cline Ave | 0.26mi | 3/2.0 (+1) | 950 (+6%) | 18mo | $199,000 | $209 | 54 |
| 504 N Spring Ave | 0.74mi | 2/1.0 | 946 (+6%) | 5mo | $167,000 | $177 | 52 |
| 615 E Saunders Ave | 0.74mi | 2/1.0 | 850 (-5%) | 15mo | $60,000 | $71 | 44 |
| 216 N Brady Ave | 0.66mi | 2/1.0 | 772 (-14%) | 2mo | $48,750 | $63 | 44 |
| 621 E A St | 0.73mi | 2/1.0 | 784 (-12%) | 2mo | $154,000 | $196 | 44 |
| 10 N Davis Ave | 0.69mi | 3/1.0 (+1) | 850 (-5%) | 13mo | $40,000 | $47 | 43 |
| 400 S Forney Ave | 0.39mi | 3/1.0 (+1) | 1,021 (+14%) | 16mo | $135,000 | $132 | 41 |
| 127 S Caldwell Ave | 0.61mi | 3/1.0 (+1) | 1,000 (+12%) | 11mo | $102,000 | $102 | 38 |
| 608 E E St | 0.59mi | 3/2.0 (+1) | 1,018 (+14%) | 10mo | $195,000 | $192 | 32 |
Match score weights: distance 35% · size 25% · config 20% · recency 20%. Top-matched comps best support the ARV.
Projected returns pro-forma
-3.0% appreciation · 3.0% rent growth · sell at horizon
- IRR
- -14.2%
- Equity multiple
- 0.49×
- Total profit
- $-25,346
- Equity at exit
- $26,615
- IRR
- -5.4%
- Equity multiple
- 0.65×
- Total profit
- $-17,627
- Equity at exit
- $15,433
Cash invested: $49,980 (down + closing). Projections, not guarantees.
Landlord ↔ Tenant lean methodology
- Overall (STATE)
- 85 Strongly Landlord-Friendly
- State North Carolina
- 85 Strongly Landlord-Friendly · R+3
- County
- — inherits STATE
- City
- — inherits STATE
ZIP-level market 28658
- Home prices YoY
- -23.3%
- Active inventory
- 229
- Price-to-rent
- 10.1×
Monthly cashflow live
- Estimated rent
- $1,466 medium interval (Pro) →
- Mortgage (P&I)
- −$936
- Tax from tax record
- −$90 /mo · $1,083/yr
- Insurance
- −$74
- HOA
- −$0
- Vacancy / Maint / Mgmt
- −$308
- Net cashflow
- $57
Break-even live
Sensitivity live
| Price | -10% $158 | -5% $108 | +0% $57 | +5% $7 | +10% $-44 |
|---|---|---|---|---|---|
| Rent | -10% $-59 | -5% $-1 | +0% $57 | +5% $115 | +10% $173 |
| Rate | -1.0pp $147 | -0.5pp $103 | base $57 | +0.5pp $11 | +1.0pp $-36 |
UW: 25.0% down · 7.5% · 30yr · 1.5% tax · 5.0% vac · 8.0% maint · 8.0% mgmt
Financing live
Cash to close
- Down payment
- $44,625
- Closing costs
- $5,355
- Reserves months
- —
- Total cash needed
- —
Loan-product check · same deal, 3 products live
Conventional
25% down · 7.5% · 30yr
- Down + closing
- —
- Monthly P&I
- —
- Monthly cashflow
- —
- DSCR
- —
- Eligible?
- —
Personal DTI + credit; lowest rate.
DSCR
20% down · 8.5% · 30yr
- Down + closing
- —
- Monthly P&I
- —
- Monthly cashflow
- —
- DSCR
- —
- Eligible?
- —
No personal income docs; deal must DSCR.
Hard money
10% down · 12.0% · 12mo
- Down + closing
- —
- Monthly P&I
- —
- Monthly cashflow
- —
- DSCR
- —
- Eligible?
- —
Short-term bridge; refi at stabilization.
Rent comps 2 comps
| Address | Beds | Baths | Sqft | Rent | $/sqft | DOM | Units | Dist |
|---|---|---|---|---|---|---|---|---|
| 244 S Caldwell Ave Newton, NC | 2.0 | 1.5 | 918 | $1,575 | $1.72 | 6d | 1 | 0.55mi |
| 1326 N Frye Ave Unit I Newton, NC | 2.0 | 1.0 | 730 | $1,150 | $1.58 | 14d | 1 | 1.32mi |
Listing history 8 events
-
2026-05-12status Pending
-
2026-04-17price $178,500
-
2026-02-28price $178,900
-
2026-02-19status Active
-
2026-02-10status Pending
-
2026-02-04price $179,500
-
2026-01-14$180,000 Active
-
2021-02-17soldstatus $87,000
ⓘ Source: listings_history table (triggers on properties + properties_extension) + one-shot
backfill from property_details.listing_events for pre-trigger history.
Tax reassessment forecast NC · Resets to sale price
- Current annual tax
- $1,083 · $90/mo
- Projected year-2 tax
- $1,464 · $122/mo
- Expected delta
- +$381/yr (+$32/mo · 35.2%)
ⓘ Screening estimate from a state-policy table — verify with the county assessor before closing.
Climate risk First Street
- Flood 1/10 Low FEMA zone X (unshaded) · 0% chance over 30 yrs
- Wildfire 1/10 Low
- Heat 5/10 Major 7 d/yr ≥103°F today · 17 d/yr by 30 yrs out
- Wind 3/10 Moderate 4% chance of damaging wind over 30 yrs
- Air quality 3/10 Moderate 2 unhealthy d/yr today · 3 by 30 yrs out
Nearby sold comps map
Loading sold comps map…
Walkable amenities ~0.75 mi
Loading nearby amenities…
Taxation est. · year 1
- Rental income
- $17,587
- − Mortgage interest
- −$9,999
- − Property taxes
- −$1,083
- − Insurance
- −$892
- − Repairs & maintenance
- −$1,407
- − Management
- −$1,407
- − Depreciation
- −$5,193
- Taxable loss
- −$2,394
- Est. tax savings @ 24.0%
- +$574
- After-tax cash flow
- $1,260/yr
For passive investors: Depreciation is non-cash, so a rental often shows a tax loss while cash-flowing — sheltering income. Rental losses are passive: they offset passive income freely, and up to $25,000/yr can offset ordinary (W-2) income if you actively participate and your MAGI is under $100k (phasing out to $0 by $150k); unused losses carry forward. On sale, claimed depreciation is recaptured at up to 25%, and gains may owe capital-gains tax (a 1031 exchange can defer both). Figures are a year-1 estimate at your 24.0% rate — not tax advice; consult a CPA.
Schools (NCES district)
- District
- Newton Conover City Schools
- NCES district ID
- 3703360
- Math proficiency
- 49% ▲ 11.00%
- Reading proficiency
- 47% ▲ 3.00%
- Median HH income
- $39,491
- Composite
- 40.13/100
- National rank
- #3797
- State rank
- #74 of 178 in NC
Livability — Newton
- Score
- 73/100
- State rank
- #77
- US rank
- #5536
Category grades
Schools grade is shown separately in the Schools card above.
Census & demographics
- Census place
- Newton, NC
- Population (ZIP)
- 25,681
Population outlook (Catawba County) Hauer SSP2
- Today (2025)
- 156,513 people
- By 2030
- 155,267 · -0.8%
- By 2040
- 151,110 · -3.5%
- By 2050
- 145,524 · -7.0%
- By 2075
- 134,047 · -14.4%
- By 2100
- 119,424 · -23.7%
Race, ethnicity, and origin ACS 2023
- Neighborhood character
- Predominantly White (69%)
- Race & ethnicity
- White 69% Hispanic / Latino 12% Black 8% Two or more races 8% Asian 5%
- Hispanic origin (detail)
- Mexican 9%
- Common ancestry
- Slovak 2% Serbian 2% Italian 2%
- Foreign-born
- 8% · Canada, Jamaica, Vietnam
- Languages at home
- 84% English-only · Spanish 11% Other Asian/Pacific 3% Tagalog/Filipino 1%
Political lean MEDSL · Catawba
- 2024 margin
- Solid R (+38.0) · D 30.6% · R 68.6%
- 2008→2024 swing
- -13.0pp toward R · 2008: -25.0pp · 2024: -38.0pp
- All cycles
- 2024: R+38.0 2020: R+37.0 2016: R+38.0 2012: R+29.6 2008: R+25.0
Not yet ingested
- Civics
- —
Market trends
- HPI YoY
- ▼ -79.85%
- Current HPI
- 262.8541
- Rent YoY
- —
- Metro
- —
- State GDP YoY
- ▲ 3.28%
- F500 in state
- 26
Industry mix (Fortune 500 HQ in NC)
| Industry | F500 HQs | Revenue |
|---|---|---|
| Financial Services | 2 | $213B |
|
||
| Retail | 2 | $95B |
|
||
| Industrial Conglomerate | 1 | $38B |
|
||
| Metals / Steel | 1 | $35B |
|
||
| Utilities | 1 | $30B |
|
||
| Industrial Machinery | 1 | $19B |
|
||
Price history
+105.2% since first listed8 events — show timeline
- 2026-05-12 Pending — CANOPYMLS as Distributed by MLS Grid
- 2026-04-17 Price Changed $178,500 CANOPYMLS as Distributed by MLS Grid
- 2026-02-28 Price Changed $178,900 CANOPYMLS as Distributed by MLS Grid
- 2026-02-19 Relisted — CANOPYMLS as Distributed by MLS Grid
- 2026-02-10 Pending — CANOPYMLS as Distributed by MLS Grid
- 2026-02-04 Price Changed $179,500 CANOPYMLS as Distributed by MLS Grid
- 2026-01-14 Listed $180,000 CANOPYMLS as Distributed by MLS Grid
- 2021-02-17 Sold (Public Records) $87,000 Public Records
Property tax history
+4.4%/yrLatest (2024): $1,083 · +0.0% YoY. Source: county tax records.
Cash-flow waterfall
monthlySold comps — $/sqft
last 12 mo · ≤1 miLoading sold comps…