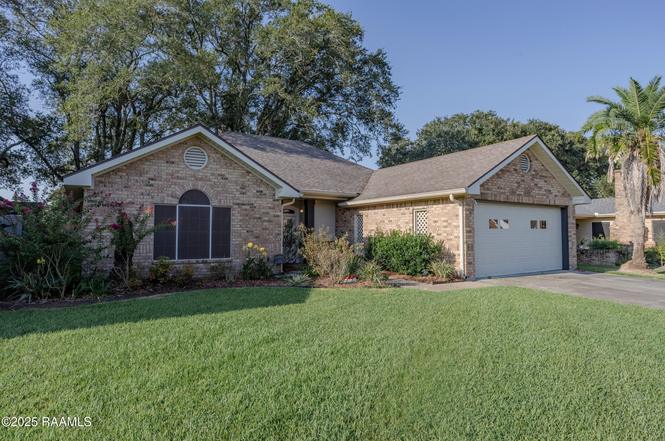
213 Tuscany Valley Dr · Lafayette, LA
Flood risk 1/10 · Minimal
- FEMA flood zone
- X (unshaded)
- Chance of flooding over 30 yrs
- 0.0%
- Est. flood insurance / yr
- $507 – $1,088
Fire risk 2/10 · Minimal
- Est. fire insurance / yr
- $1,269 – $2,357
Heat risk 9/10 · Severe
- Hot days now (above 108°F)
- 7 days/yr
- Hot days in 30 yrs
- 21 days/yr
Wind risk 9/10 · Severe
- Chance of severe wind over 30 yrs
- 99.0%
Air-quality risk 1/10 · Minimal
- Unhealthy air days now
- 0 days/yr
- Unhealthy air days in 30 yrs
- 0 days/yr
Risk factors via First Street. Map © Google.
Why this score? — see what drove the C grade
The composite is a weighted blend of 9 inputs, each scored 0–100. Each bar is that input's sub-score; the figure is the points it added to the 100-point composite (weight × sub-score).
- Cash flow +20.4/30.0
- ARV discount +15.0/15.0
- DSCR +6.5/10.0
- 1% rule +4.7/10.0
- Schools +3.6/10.0
- Rent growth +3.5/5.0
- Livability +3.5/5.0
- Condition / age +2.5/5.0
- Appreciation +0.0/10.0
$215,000
🖨 Deal sheet 📄 Offer letter ✓ Due diligence
Listing remarks
Beautifully Updated Home in Cross Creek SubdivisionThis 3-bedroom, 2-bath residence offers stylish updates and functional living spaces in the desirable Cross Creek subdivision. The home features new flooring throughout, granite and quartz countertops, real wood cabinetry, a spacious kitchen island, and a pantry for added storage. The inviting living area includes an updated fireplace mantle, and the new wood privacy fence encloses a large backyard ideal for outdoor enjoyment. With its combination of modern finishes, open layout, and move-in ready condition, this home is an excellent opportunity for anyone seeking quality and comfort in a convenient location. 📅 Schedule your showing today -
Key facts
- Pantry
- Quartz countertops
- Updated floors
Tags
Neighborhood map
What this means for you Summary
Snapshot
- This is a 3-bed/2.0-bath single-family listed at $215k.
Deal economics
- At list price, monthly cash flow is $279 ($3k/yr) — positive.
- The deal already cash-flows at list — no discount required.
- To meet the 1% rule (rent ≥ 1% of price), the offer needs to be $208k (3.2% below list).
- Recommended offer: $189k (12.0% below list) — sets the bar for market timing.
- Cap rate 7.8% vs local median 4.7% in Lafayette — top-decile yield for the area; either an underpriced asset or a hidden risk that comps aren't pricing in. Stress-test before assuming the spread holds.
Location & tenants
- Location reads 70/100 on livability (#63 in LA) — a middle-class / working-renter tenant base. Strengths: cost of living A+, housing A+, health & safety A+; Watch: amenities C-, employment C-, crime F.
- Lafayette Parish (urban): math 38% / reading 46% proficiency, ranked #19 of 98 in LA (top 19%) — families likely to look elsewhere, expect single-tenant / working-renter base with shorter leases.
- Market conditions: Rents rising fast (+4.1%/yr); 404 active listings in the ZIP; 14 comparable units currently listed for rent nearby; rentals at typical pace (median 21d on market — plan ~3-4 weeks tenant-placement turnaround); 1,585 units permitted in Lafayette Parish in 2024 (10 in 5+ unit buildings).
- This rent runs 44% of the median local income ($57k/yr) — at the standard rent-burdened threshold; future hikes will face affordability resistance.
Forward outlook
- Local home prices are declining (-3.0%/yr); year-one equity from $1k of loan paydown is wiped out by about $6k of value loss. Plan a longer hold.
- Lafayette County population projected at +34% by 2050 — long-run rental-demand tailwind backs the buy-and-hold thesis.
Negotiation context
- It's been on market 202 days — a 12% lower offer ($189k) is reasonable based on typical stale-listing flexibility.
- 3 sale attempts since 2y ago; this cycle's ask has dropped $34k (14%) from the opening price — seller is motivated, your offer sets the floor, not the list.
- Current owner paid $186k; 16% above their basis — modest negotiation headroom, anchor on the comps not their cost.
Risks & watch-outs
- Climate carrying-cost: severe wind risk, 99% chance of damaging wind over 30y; extreme-heat days projected 7→21/yr by 2055 (HVAC capex compounding) — expect insurance premiums to compound above CPI over the hold.
Questions for the listing agent
- It's been on market 202 days. Have you received any prior offers? Is the seller open to a 12% concession, seller financing, or rate buy-down credit?
- What does the HOA fee cover, when was the last increase, and are there any pending special assessments or reserve-fund shortfalls?
- Why hasn't it sold? Are there any deal-killer items the seller is aware of (foundation, flood, title, zoning, code violations)?
- Is there a deadline driving the sale (1031 exchange, divorce, estate, relocation)? That informs how much negotiation room exists.
- Schools are B-rated — typically a magnet for longer-tenancy family renters. What's the average tenant stay here, and is there a school-zone premium baked into asking?
- Crime grade is F in this area — have there been break-ins, vandalism, or insurance claims at this property in the last 3 years? What carrier currently insures it and at what premium?
- What's the average days-on-market for RENTAL listings here right now (not sales)? A rising rental-DOM trend means longer vacancies and softer asking-rent achievability than the comps imply.
- What's the recent tenant-quality profile in this submarket — average credit score on applications, eviction rate, late-payment / NSF rate, and stable-employment percentage? A property-management company in the area should have these aggregated.
- How much new for-sale + rental construction is in the pipeline within 1–3 miles? Heavy new supply typically softens prices + rents 12–24 months out; constrained supply supports both.
Investment metrics
- 1% rule
- 0.97% ✗
- Cap rate
- 7.85%
- Cash-on-cash
- 5.56%
- DSCR
- 1.25
- GRM
- 8.6
CMA / ARV
- ARV (on-the-fly)
- $337,088
- Comps found
- 12
Show comp detail 12 sales within ~0.75 mi
| Address | Dist | Beds/Ba | Sqft | Sold | Price | $/sf | Match |
|---|---|---|---|---|---|---|---|
| 213 Tuscany Valley Dr | 0.00mi | 3/2.0 | 1,832 (0%) | 0mo | $203,000 | $111 | 100 |
| 100 Parkerson St | 0.23mi | 3/2.0 | 1,852 (+1%) | 3mo | $335,000 | $181 | 85 |
| 306 Capstone Xing | 0.32mi | 3/2.0 | 1,825 (-0%) | 0mo | $335,000 | $184 | 84 |
| 106 Finsbury Ln | 0.22mi | 3/2.5 | 1,790 (-2%) | 2mo | $332,000 | $185 | 82 |
| 102 Channing Cir | 0.13mi | 4/2.5 (+1) | 1,952 (+7%) | 2mo | $285,000 | $146 | 75 |
| 102 Sun Vista Ln | 0.42mi | 3/2.5 | 1,843 (+1%) | 4mo | $352,900 | $191 | 74 |
| 508 Capstone Xing | 0.45mi | 3/2.0 | 1,905 (+4%) | 2mo | $374,500 | $197 | 71 |
| 600 Capstone Xing | 0.48mi | 4/2.0 (+1) | 1,887 (+3%) | 5mo | $358,900 | $190 | 64 |
| 201 Fillmore Way | 0.55mi | 4/2.0 (+1) | 1,887 (+3%) | 4mo | $358,900 | $190 | 61 |
| 304 Capstone Xing | 0.31mi | 3/2.0 | 2,077 (+13%) | 5mo | $338,000 | $163 | 59 |
| 112 Gentle Crescent Ln | 0.54mi | 3/2.0 | 1,657 (-10%) | 5mo | $231,000 | $139 | 54 |
| 107 Sun Vista Ln | 0.42mi | 4/3.0 (+1) | 2,105 (+15%) | 2mo | $380,000 | $181 | 45 |
Match score weights: distance 35% · size 25% · config 20% · recency 20%. Top-matched comps best support the ARV.
Projected returns pro-forma
-3.0% appreciation · 4.12% rent growth · sell at horizon
- IRR
- -6.5%
- Equity multiple
- 0.76×
- Total profit
- $-14,749
- Equity at exit
- $32,057
- IRR
- 4.3%
- Equity multiple
- 1.33×
- Total profit
- $19,810
- Equity at exit
- $18,589
Cash invested: $60,200 (down + closing). Projections, not guarantees.
Landlord ↔ Tenant lean methodology
- Overall (STATE)
- 90 Strongly Landlord-Friendly
- State Louisiana
- 90 Strongly Landlord-Friendly · R+12
- County
- — inherits STATE
- City
- — inherits STATE
ZIP-level market 70506
- Home prices YoY
- -34.8%
- Rents YoY
- 4.1%
- Active inventory
- 404
- Price-to-rent
- 8.6×
Monthly cashflow live
- Estimated rent
- $2,081 high interval (Pro) →
- Mortgage (P&I)
- −$1,127
- Tax from tax record
- −$140 /mo · $1,683/yr
- Insurance
- −$90
- HOA
- −$8
- Vacancy / Maint / Mgmt
- −$437
- Net cashflow
- $279
Break-even live
UW: 25.0% down · 7.5% · 30yr · 1.5% tax · 5.0% vac · 8.0% maint · 8.0% mgmt
Financing live
Cash to close
- Down payment
- $53,750
- Closing costs
- $6,450
- Reserves months
- —
- Total cash needed
- —
Loan-product check · same deal, 3 products live
Conventional
25% down · 7.5% · 30yr
- Down + closing
- —
- Monthly P&I
- —
- Monthly cashflow
- —
- DSCR
- —
- Eligible?
- —
Personal DTI + credit; lowest rate.
DSCR
20% down · 8.5% · 30yr
- Down + closing
- —
- Monthly P&I
- —
- Monthly cashflow
- —
- DSCR
- —
- Eligible?
- —
No personal income docs; deal must DSCR.
Hard money
10% down · 12.0% · 12mo
- Down + closing
- —
- Monthly P&I
- —
- Monthly cashflow
- —
- DSCR
- —
- Eligible?
- —
Short-term bridge; refi at stabilization.
Rent comps 14 comps
| Address | Beds | Baths | Sqft | Rent | $/sqft | DOM | Units | Dist |
|---|---|---|---|---|---|---|---|---|
| 201 Finsbury Ln Lafayette, LA | 3.0 | 2.0 | 1730 | $2,575 | $1.49 | 20d | 1 | 0.17mi |
| 303 Tall Meadows Ln Lafayette, LA | 3.0 | 2.0 | 1522 | $2,000 | $1.31 | 20d | 1 | 0.68mi |
| 304 Tall Meadows Ln Lafayette, LA | 3.0 | 2.0 | 1689 | $1,850 | $1.10 | 43d | 1 | 0.70mi |
| 105 Alpine Meadows Ln Lafayette, LA | 3.0 | 2.0 | 1629 | $1,945 | $1.19 | 20d | 1 | 0.70mi |
| 307 Grassy Meadows Ln Lafayette, LA | 3.0 | 2.0 | 1603 | $2,200 | $1.37 | 20d | 1 | 0.73mi |
| 1630 Rue du Belier Lafayette, LA | 1.0–3.0 | 1.0–2.0 | 1060 | $1,600 | $1.51 | 13d | 25 | 0.79mi |
| 104 Marblehead Ave Lafayette, LA | 2.0–3.0 | 2.0–2.5 | 1448 | $2,668 | $1.84 | 13d | 126 | 0.89mi |
| 225 Shadowbrush Bnd Lafayette, LA | 3.0 | 2.0 | 1585 | $1,700 | $1.07 | 43d | 1 | 0.90mi |
| 600 Glade Blvd Lafayette, LA | 3.0 | 2.0 | 1617 | $1,695 | $1.05 | 13d | 1 | 0.91mi |
| 221 Wakely CT Lafayette, LA | 3.0 | 2.0 | 1659 | $1,975 | $1.19 | 13d | 1 | 1.00mi |
| 6000 Johnston St Lafayette, LA | 1.0–3.0 | 1.0–2.0 | 1093 | $1,740 | $1.59 | 13d | 20 | 1.08mi |
| 106 Braddish Ct Lafayette, LA | 3.0 | 2.0 | 1659 | $1,900 | $1.15 | 20d | 1 | 1.11mi |
| 330 Dunvegan Ct Lafayette, LA | 3.0 | 2.5 | 1848 | $2,400 | $1.30 | 43d | 1 | 1.22mi |
| 343 Ridge Rd Lafayette, LA | 2.0–3.0 | 2.0 | 1113 | $1,995 | $1.79 | 13d | 34 | 1.48mi |
HOA detail
- Monthly dues
- $8 · $96/yr
Listing history 18 events
-
2026-04-09status Pending
-
2026-03-30status Active
-
2026-03-19status Pending
-
2026-03-09price $215,000
-
2026-02-27price $230,000
-
2026-02-17price $235,000
-
2026-01-12price $237,000
-
2025-11-19price $239,000
-
2025-10-20price $244,500
-
2025-09-08$249,500 Active
-
2024-07-08soldstatus $185,902
-
2024-03-01$283,000
-
2023-05-27price $270,000
-
2023-03-23price $210,000
-
2023-03-19price $245,000
-
2023-03-01price $220,000
-
2023-02-17price $230,000
-
2023-02-06price $240,000
ⓘ Source: listings_history table (triggers on properties + properties_extension) + one-shot
backfill from property_details.listing_events for pre-trigger history.
Tax reassessment forecast LA · Resets to sale price
- Current annual tax
- $1,683 · $140/mo
- Projected year-2 tax
- $1,683 · $140/mo
- Expected delta
- $0/yr ($0/mo · -0.0%)
ⓘ Screening estimate from a state-policy table — verify with the county assessor before closing.
Climate risk First Street
- Flood 1/10 Low FEMA zone X (unshaded) · 0% chance over 30 yrs
- Wildfire 2/10 Low
- Heat 9/10 Extreme 7 d/yr ≥108°F today · 21 d/yr by 30 yrs out
- Wind 9/10 Extreme 99% chance of damaging wind over 30 yrs
- Air quality 1/10 Low 0 unhealthy d/yr today · 0 by 30 yrs out
Nearby sold comps map
Loading sold comps map…
Walkable amenities ~0.75 mi
Loading nearby amenities…
Taxation est. · year 1
- Rental income
- $24,975
- − Mortgage interest
- −$12,043
- − Property taxes
- −$1,683
- − Insurance
- −$1,075
- − Repairs & maintenance
- −$1,998
- − Management
- −$1,998
- − HOA
- −$96
- − Depreciation
- −$6,255
- Taxable loss
- −$173
- Est. tax savings @ 24.0%
- +$41
- After-tax cash flow
- $3,388/yr
For passive investors: Depreciation is non-cash, so a rental often shows a tax loss while cash-flowing — sheltering income. Rental losses are passive: they offset passive income freely, and up to $25,000/yr can offset ordinary (W-2) income if you actively participate and your MAGI is under $100k (phasing out to $0 by $150k); unused losses carry forward. On sale, claimed depreciation is recaptured at up to 25%, and gains may owe capital-gains tax (a 1031 exchange can defer both). Figures are a year-1 estimate at your 24.0% rate — not tax advice; consult a CPA.
Schools (NCES district)
- District
- Lafayette Parish
- NCES district ID
- 2200870
- Math proficiency
- 38% ▼ -32.00%
- Reading proficiency
- 46% ▼ -24.00%
- Median HH income
- $50,238
- Composite
- 36.15/100
- National rank
- #4741
- State rank
- #19 of 98 in LA
Livability — Lafayette
- Score
- 70/100
- State rank
- #63
- US rank
- #8133
Category grades
Schools grade is shown separately in the Schools card above.
Census & demographics
- County
- Lafayette Parish · 207,544 people
- City population
- 158,114
- Metro
- Lafayette, LA
- Population (ZIP)
- 42,318
- Household income
- $57,379
- Rent vs Own
- Severe rent burden
- 2095.0
Population outlook (Lafayette County) Hauer SSP2
- Today (2025)
- 280,930 people
- By 2030
- 301,092 · +7.2%
- By 2040
- 339,456 · +20.8%
- By 2050
- 375,156 · +33.5%
- By 2075
- 451,672 · +60.8%
- By 2100
- 497,203 · +77.0%
Race, ethnicity, and origin ACS 2023
- Neighborhood character
- Diverse neighborhood (Simpson 0.58)
- Race & ethnicity
- White 60% Black 20% Hispanic / Latino 13% Two or more races 13% Asian 3%
- Hispanic origin (detail)
- Mexican 4%
- Common ancestry
- Lithuanian 18% Armenian 1% Slovak 1%
- Foreign-born
- 12% · Canada, Vietnam
- Languages at home
- 83% English-only · Spanish 9% French/Haitian/Cajun 3% Vietnamese 1%
Political lean MEDSL · Lafayette
- 2024 margin
- Solid R (+31.4) · D 33.5% · R 64.8% · Other 1.7%
- 2008→2024 swing
- -0.1pp no change · 2008: -31.3pp · 2024: -31.4pp
- All cycles
- 2024: R+31.4 2020: R+28.7 2016: R+33.6 2012: R+33.7 2008: R+31.3
Not yet ingested
- Civics
- —
Market trends
- HPI YoY
- ▼ -75.28%
- Current HPI
- 140.8445
- Rent YoY
- ▲ 4.12%
- Metro
- Lafayette, LA
- State GDP YoY
- ▲ 3.29%
- F500 in state
- 10
Industry mix (Fortune 500 HQ in LA)
| Industry | F500 HQs | Revenue |
|---|---|---|
| Telecommunications | 2 | $23B |
|
||
| Utilities | 1 | $12B |
|
||
| Wholesale / Distribution | 1 | $5B |
|
||
| Advertising | 1 | $2B |
|
||
Price history
-10.4% since first listed18 events — show timeline
- 2026-04-09 Pending — AcadianaMLS
- 2026-03-30 Relisted — AcadianaMLS
- 2026-03-19 Pending — AcadianaMLS
- 2026-03-09 Price Changed $215,000 AcadianaMLS
- 2026-02-27 Price Changed $230,000 AcadianaMLS
- 2026-02-17 Price Changed $235,000 AcadianaMLS
- 2026-01-12 Price Changed $237,000 AcadianaMLS
- 2025-11-19 Price Changed $239,000 AcadianaMLS
- 2025-10-20 Price Changed $244,500 AcadianaMLS
- 2025-09-08 Listed $249,500 AcadianaMLS
- 2024-07-08 Sold (Public Records) $185,902 Public Records
- 2024-03-01 Listed $283,000 AcadianaMLS
- 2023-05-27 Price Changed $270,000 FSBO.com
- 2023-03-23 Price Changed $210,000 FSBO.com
- 2023-03-19 Price Changed $245,000 FSBO.com
- 2023-03-01 Price Changed $220,000 FSBO.com
- 2023-02-17 Price Changed $230,000 FSBO.com
- 2023-02-06 Price Changed $240,000 FSBO.com
Property tax history
+5.1%/yrLatest (2025): $1,683 · -1.3% YoY. Source: county tax records.
Cash-flow waterfall
monthlySold comps — $/sqft
last 12 mo · ≤1 miLoading sold comps…