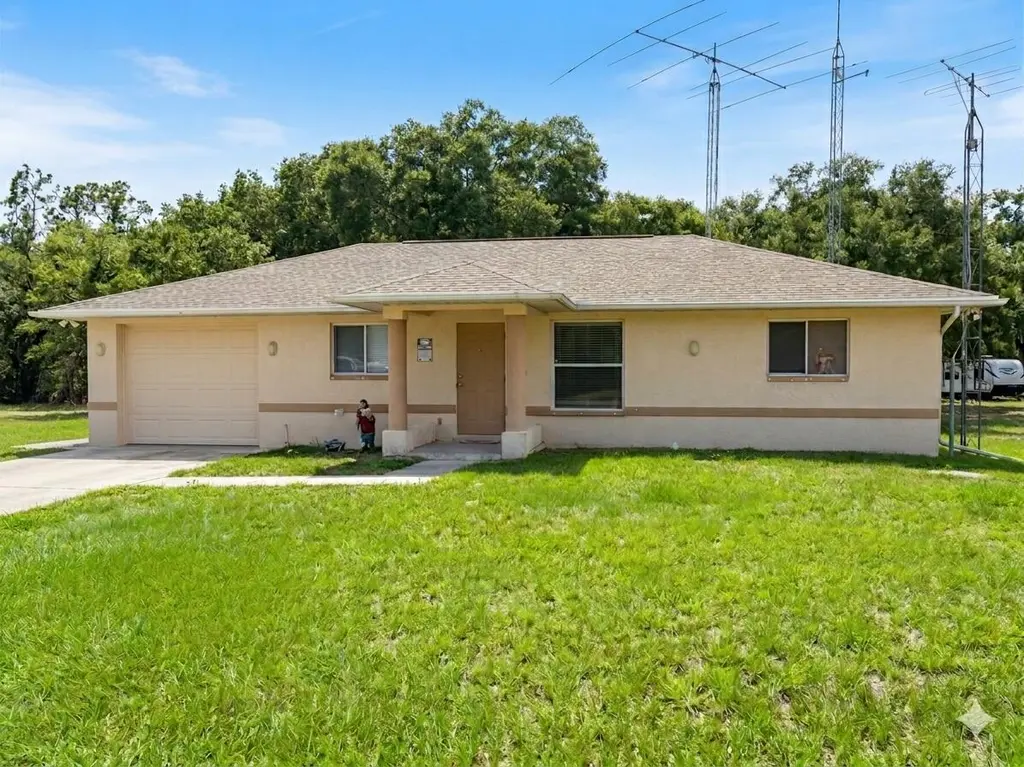
1519 Michael Ave · Lehigh Acres, FL
Flood risk 1/10 · Minimal
- FEMA flood zone
- X (unshaded)
- Chance of flooding over 30 yrs
- 0.0%
- Est. flood insurance / yr
- $507 – $1,088
Fire risk 3/10 · Minor
- Est. fire insurance / yr
- $947 – $1,759
Heat risk 9/10 · Severe
- Hot days now (above 108°F)
- 7 days/yr
- Hot days in 30 yrs
- 26 days/yr
Wind risk 10/10 · Severe
- Chance of severe wind over 30 yrs
- 99.0%
Air-quality risk 2/10 · Minimal
- Unhealthy air days now
- 2 days/yr
- Unhealthy air days in 30 yrs
- 2 days/yr
Risk factors via First Street. Map © Google.
Why this score? — see what drove the C grade
The composite is a weighted blend of 9 inputs, each scored 0–100. Each bar is that input's sub-score; the figure is the points it added to the 100-point composite (weight × sub-score).
- Cash flow +23.7/30.0
- DSCR +7.6/10.0
- ARV discount +7.5/15.0
- 1% rule +5.5/10.0
- Schools +4.1/10.0
- Rent growth +3.8/5.0
- Livability +3.0/5.0
- Condition / age +2.5/5.0
- Appreciation +0.0/10.0
$179,900
🖨 Deal sheet 📄 Offer letter ✓ Due diligence
Listing remarks MLS
A great opportunity in Lehigh Acres! CBS construction, built in 2000, 1154 sq ft under air, 3 bedrooms, 2 bathrooms, a single attached garage, open patio, serviced by a private well and septic tank, and in good condition! Freddie Mac Owned, sold as-is, Special Addenda, solid pre-qualification letter or proof of cash needed with all offers. BUYER TO PAY DOC STAMPS ON DEED. This is NOT a short sale. .. fast response seller. Don't miss it!
Key facts
- 0.5 acre lot
- Garage
- Built 2000
Property features AI
Finance
- Other: Pets allowed with no restrictions
Exterior
- Parking: Attached garage (1 garage space); Total parking for 2 vehicles (1 covered space)
- Utilities: Well water; Septic tank; Electricity available; Water available; Sewer available
- Home design: Single family residence; One-story; Faces south; Resale property
- Construction: Concrete block construction with stucco; Building area approximately 1,944 (source: public records); Living area approximately 1,154; One-story
- Exterior features: Not waterfront; Shingle roof
Interior
- Kitchen: Dishwasher; Electric range / electric cooktop; Microwave; Refrigerator
- Bedrooms: 3 bedrooms on the main level
- Flooring: Carpet; Laminate
- Bathrooms: 2 full bathrooms on the main level
- Heating & cooling: Central heating; Central air conditioning; Ceiling fans
- Interior features: Split bedroom layout; Water softener (owned)
- Laundry & utility: Electric water heater
Neighborhood map
What this means for you Summary
Snapshot
- This is a 3-bed/2.0-bath single-family listed at $180k.
Deal economics
- At list price, monthly cash flow is $343 ($4k/yr) — positive.
- The deal already cash-flows at list — no discount required.
- Meets the 1% rule at list price ($2k rent vs $180k).
- Recommended offer: $175k (3.0% below list) — sets the bar for market timing.
- Cap rate 8.6% vs local median 4.7% in Lehigh Acres — top-decile yield for the area; either an underpriced asset or a hidden risk that comps aren't pricing in. Stress-test before assuming the spread holds.
Location & tenants
- Location reads 59/100 on livability (#826 in FL) — a working-class tenant base; expect higher turnover. Strengths: cost of living A+, housing A+; Watch: crime C-, employment D+, schools D-.
- Lee (suburban): math 47% / reading 50% proficiency, ranked #42 of 73 in FL (top 58%) — families likely to look elsewhere, expect single-tenant / working-renter base with shorter leases.
- Market conditions: Rents rising fast (+5.3%/yr); 1611 active listings in the ZIP; 14 comparable units currently listed for rent nearby; rentals at typical pace (median 24d on market — plan ~3-4 weeks tenant-placement turnaround); 15,411 units permitted in Lee County in 2024 (4,686 in 5+ unit buildings).
- This rent runs 31% of the median local income ($74k/yr) — at the standard rent-burdened threshold; future hikes will face affordability resistance.
Forward outlook
- Local home prices are declining (-3.0%/yr); year-one equity from $1k of loan paydown is wiped out by about $5k of value loss. Plan a longer hold.
- Lee County population projected at +44% by 2050 — long-run rental-demand tailwind backs the buy-and-hold thesis.
- At projected returns (-3.0% appreciation + 5.3% rent growth), your $50k cash investment doubles in ~10 years — after that, you're playing with house money.
Negotiation context
- It's been on market 32 days — a 3% lower offer ($175k) is reasonable based on typical stale-listing flexibility.
- Current owner paid $70k; list at $180k implies a 157% gain — meaningful room to come down on a strong offer.
Risks & watch-outs
- Climate carrying-cost: severe wind risk, 99% chance of damaging wind over 30y; extreme-heat days projected 7→26/yr by 2055 (HVAC capex compounding) — expect insurance premiums to compound above CPI over the hold.
Questions for the listing agent
- It's been on market 32 days. Have you received any prior offers? Is the seller open to a 3% concession, seller financing, or rate buy-down credit?
- Is there a deadline driving the sale (1031 exchange, divorce, estate, relocation)? That informs how much negotiation room exists.
- Schools are D-rated, which usually means shorter tenancies and higher turnover. Who's the typical renter profile here, and what's been the actual vacancy rate?
- What's the average days-on-market for RENTAL listings here right now (not sales)? A rising rental-DOM trend means longer vacancies and softer asking-rent achievability than the comps imply.
- What's the recent tenant-quality profile in this submarket — average credit score on applications, eviction rate, late-payment / NSF rate, and stable-employment percentage? A property-management company in the area should have these aggregated.
- How much new for-sale + rental construction is in the pipeline within 1–3 miles? Heavy new supply typically softens prices + rents 12–24 months out; constrained supply supports both.
Investment metrics
- 1% rule
- 1.05% ✓
- Cap rate
- 8.58%
- Cash-on-cash
- 8.17%
- DSCR
- 1.36
- GRM
- 8.0
CMA / ARV
No comps found within radius.
Projected returns pro-forma
-3.0% appreciation · 5.33% rent growth · sell at horizon
- IRR
- -1.5%
- Equity multiple
- 0.94×
- Total profit
- $-2,832
- Equity at exit
- $26,824
- IRR
- 10.4%
- Equity multiple
- 1.89×
- Total profit
- $44,937
- Equity at exit
- $15,554
Cash invested: $50,372 (down + closing). Projections, not guarantees.
Landlord ↔ Tenant lean methodology
- Overall (STATE)
- 87 Strongly Landlord-Friendly
- State Florida
- 87 Strongly Landlord-Friendly · R+3
- County
- — inherits STATE
- City
- — inherits STATE
ZIP-level market 33972
- Home prices YoY
- -13.6%
- Rents YoY
- 5.3%
- Active inventory
- 1611
- Price-to-rent
- 8.0×
Monthly cashflow live
- Estimated rent
- $1,880 high interval (Pro) →
- Mortgage (P&I)
- −$943
- Tax from tax record
- −$124 /mo · $1,488/yr
- Insurance
- −$75
- HOA
- −$0
- Vacancy / Maint / Mgmt
- −$395
- Net cashflow
- $343
Break-even live
UW: 25.0% down · 7.5% · 30yr · 1.5% tax · 5.0% vac · 8.0% maint · 8.0% mgmt
Financing live
Cash to close
- Down payment
- $44,975
- Closing costs
- $5,397
- Reserves months
- —
- Total cash needed
- —
Loan-product check · same deal, 3 products live
Conventional
25% down · 7.5% · 30yr
- Down + closing
- —
- Monthly P&I
- —
- Monthly cashflow
- —
- DSCR
- —
- Eligible?
- —
Personal DTI + credit; lowest rate.
DSCR
20% down · 8.5% · 30yr
- Down + closing
- —
- Monthly P&I
- —
- Monthly cashflow
- —
- DSCR
- —
- Eligible?
- —
No personal income docs; deal must DSCR.
Hard money
10% down · 12.0% · 12mo
- Down + closing
- —
- Monthly P&I
- —
- Monthly cashflow
- —
- DSCR
- —
- Eligible?
- —
Short-term bridge; refi at stabilization.
Rent comps 14 comps
| Address | Beds | Baths | Sqft | Rent | $/sqft | DOM | Units | Dist |
|---|---|---|---|---|---|---|---|---|
| 1224 Hamilton Ave Lehigh Acres, FL | 3.0 | 2.0 | 1347 | $1,595 | $1.18 | 15d | 1 | 1.13mi |
| 1917 Lorna Ave Lehigh Acres, FL | 2.0 | 2.0 | 1042 | $1,675 | $1.61 | 23d | 1 | 1.17mi |
| 1221 E 12th St Lehigh Acres, FL | 3.0 | 2.0 | 1217 | $1,550 | $1.27 | 23d | 1 | 1.18mi |
| 1924 Marlay Ave Lehigh Acres, FL | 3.0 | 2.0 | 1310 | $1,700 | $1.30 | 23d | 1 | 1.21mi |
| 805 E 13th St Lehigh Acres, FL | 3.0 | 2.0 | 1407 | $1,795 | $1.28 | 3d | 1 | 1.22mi |
| 134 Viewpoint Dr Lehigh Acres, FL | 2.0 | 2.0 | 1042 | $1,650 | $1.58 | 3d | 1 | 1.22mi |
| 3402 14th St W Lehigh Acres, FL | 2.0 | 1.0 | 777 | $1,350 | $1.74 | 2d | 1 | 1.33mi |
| 225 Rogers St Lehigh Acres, FL | 2.0 | 2.0 | 1138 | $1,400 | $1.23 | 10d | 1 | 1.39mi |
| 2011 Olsen Ln Lehigh Acres, FL | 3.0 | 2.0 | 1229 | $2,400 | $1.95 | 3d | 1 | 1.40mi |
| 1920 Latona St Lehigh Acres, FL | 2.0 | 2.0 | 1132 | $1,325 | $1.17 | 23d | 1 | 1.41mi |
| 2004 Rosa Ct Unit 2004 Lehigh Acres, FL | 3.0 | 2.0 | 1304 | $1,950 | $1.50 | 23d | 1 | 1.41mi |
| 2015 Olsen Ln Lehigh Acres, FL | 3.0 | 2.0 | 1328 | $1,750 | $1.32 | 23d | 1 | 1.43mi |
| 503 E 13th St Lehigh Acres, FL | 3.0 | 2.0 | 1248 | $2,300 | $1.84 | 23d | 1 | 1.46mi |
| 152 Ridgemont Dr Lehigh Acres, FL | 3.0 | 2.0 | 1483 | $1,830 | $1.23 | 23d | 1 | 1.47mi |
Listing history 10 events
-
2026-06-07statusdays on market $179,900 Pending 32 DOM
-
2026-06-03days on market $179,900 Active Under Contract 29 DOM
-
2026-06-02days on market $179,900 Active Under Contract 28 DOM
-
2026-06-01days on market $179,900 Active Under Contract 27 DOM
-
2026-05-31days on market $179,900 Active Under Contract 26 DOM
-
2026-05-12historical Active Under Contract
-
2026-05-05$179,900 Active
-
2014-03-20soldstatus $69,900 441-char remark
Show marketing remark (441 chars)
A great opportunity in Lehigh Acres! CBS construction, built in 2000, 1154 sq ft under air, 3 bedrooms, 2 bathrooms, a single attached garage, open patio, serviced by a private well and septic tank, and in good condition! Freddie Mac Owned, sold as-is, Special Addenda, solid pre-qualification letter or proof of cash needed with all offers. BUYER TO PAY DOC STAMPS ON DEED. This is NOT a short sale. .. fast response seller. Don't miss it!
-
2014-03-20price $74,900 441-char remark
Show marketing remark (441 chars)
A great opportunity in Lehigh Acres! CBS construction, built in 2000, 1154 sq ft under air, 3 bedrooms, 2 bathrooms, a single attached garage, open patio, serviced by a private well and septic tank, and in good condition! Freddie Mac Owned, sold as-is, Special Addenda, solid pre-qualification letter or proof of cash needed with all offers. BUYER TO PAY DOC STAMPS ON DEED. This is NOT a short sale. .. fast response seller. Don't miss it!
-
1995-07-19soldstatus $6,000
ⓘ Source: listings_history table (triggers on properties + properties_extension) + one-shot
backfill from property_details.listing_events for pre-trigger history.
Tax reassessment forecast FL · Resets to sale price
- Current annual tax
- $1,488 · $124/mo
- Projected year-2 tax
- $1,493 · $124/mo
- Expected delta
- +$5/yr ($0/mo · 0.4%)
ⓘ Screening estimate from a state-policy table — verify with the county assessor before closing.
Climate risk First Street
- Flood 1/10 Low FEMA zone X (unshaded) · 0% chance over 30 yrs
- Wildfire 3/10 Moderate
- Heat 9/10 Extreme 7 d/yr ≥108°F today · 26 d/yr by 30 yrs out
- Wind 10/10 Extreme 99% chance of damaging wind over 30 yrs
- Air quality 2/10 Low 2 unhealthy d/yr today · 2 by 30 yrs out
Nearby sold comps map
Loading sold comps map…
Walkable amenities ~0.75 mi
Loading nearby amenities…
Taxation est. · year 1
- Rental income
- $22,562
- − Mortgage interest
- −$10,077
- − Property taxes
- −$1,488
- − Insurance
- −$900
- − Repairs & maintenance
- −$1,805
- − Management
- −$1,805
- − Depreciation
- −$5,233
- Taxable income
- $1,254
- Est. tax owed @ 24.0%
- −$301
- After-tax cash flow
- $3,815/yr
For passive investors: Depreciation is non-cash, so a rental often shows a tax loss while cash-flowing — sheltering income. Rental losses are passive: they offset passive income freely, and up to $25,000/yr can offset ordinary (W-2) income if you actively participate and your MAGI is under $100k (phasing out to $0 by $150k); unused losses carry forward. On sale, claimed depreciation is recaptured at up to 25%, and gains may owe capital-gains tax (a 1031 exchange can defer both). Figures are a year-1 estimate at your 24.0% rate — not tax advice; consult a CPA.
Schools (NCES district)
- District
- Lee
- NCES district ID
- 1201080
- Math proficiency
- 47% ▼ -11.00%
- Reading proficiency
- 50% ▼ -4.00%
- Median HH income
- $49,518
- Composite
- 41.49/100
- National rank
- #3458
- State rank
- #42 of 73 in FL
Livability — Lehigh Acres
- Score
- 59/100
- State rank
- #826
- US rank
- #20055
Category grades
Schools grade is shown separately in the Schools card above.
Census & demographics
- Census place
- Lehigh Acres, FL
- County
- Lee County · 788,662 people
- City population
- 130,638
- Metro
- Cape Coral-Fort Myers, FL
- Population (ZIP)
- 17,285
- Household income
- $73,819
- Rent vs Own
- Severe rent burden
- 190.0
Population outlook (Lee County) Hauer SSP2
- Today (2025)
- 871,946 people
- By 2030
- 955,468 · +9.6%
- By 2040
- 1,113,587 · +27.7%
- By 2050
- 1,256,891 · +44.1%
- By 2075
- 1,560,270 · +78.9%
- By 2100
- 1,726,848 · +98.0%
Race, ethnicity, and origin ACS 2023
- Neighborhood character
- Diverse neighborhood (Simpson 0.65)
- Race & ethnicity
- White 44% Hispanic / Latino 38% Two or more races 21% Black 13%
- Hispanic origin (detail)
- Mexican 8% Puerto Rican 7% Cuban 18%
- Common ancestry
- Hispanic 6% Italian 2% Romanian 2%
- Foreign-born
- 27% · Canada, Guatemala
- Languages at home
- 61% English-only · Spanish 32% French/Haitian/Cajun 4% Other Indo-European 1%
Political lean MEDSL · Lee
- 2024 margin
- Strong R (+28.4) · D 35.5% · R 63.9%
- 2008→2024 swing
- -18.0pp toward R · 2008: -10.4pp · 2024: -28.4pp
- All cycles
- 2024: R+28.4 2020: R+19.2 2016: R+20.4 2012: R+16.6 2008: R+10.4
Not yet ingested
- Civics
- —
Market trends
- HPI YoY
- ▼ -53.97%
- Current HPI
- 343.484
- Rent YoY
- ▲ 5.33%
- Metro
- Cape Coral-Fort Myers, FL
- State GDP YoY
- ▲ 3.28%
- F500 in state
- 36
Industry mix (Fortune 500 HQ in FL)
| Industry | F500 HQs | Revenue |
|---|---|---|
| Industrial Technology | 2 | $29B |
|
||
| Insurance | 2 | $17B |
|
||
| Retail | 1 | $60B |
|
||
| Technology Distribution | 1 | $58B |
|
||
| Homebuilding | 1 | $35B |
|
||
| Technology Manufacturing | 1 | $35B |
|
||
Price history
+2898.3% since first listed5 events — show timeline
- 2026-05-12 Contingent — Beaches MLS
- 2026-05-05 Listed $179,900 Beaches MLS
- 2014-03-20 Price Changed $74,900 FORTMLS
- 2014-03-20 Sold (MLS) $69,900 FORTMLS
- 1995-07-19 Sold (Public Records) $6,000 Public Records
Property tax history
+1.6%/yrLatest (2025): $1,488 · +5.2% YoY. Source: county tax records.
Cash-flow waterfall
monthlySold comps — $/sqft
last 12 mo · ≤1 miLoading sold comps…