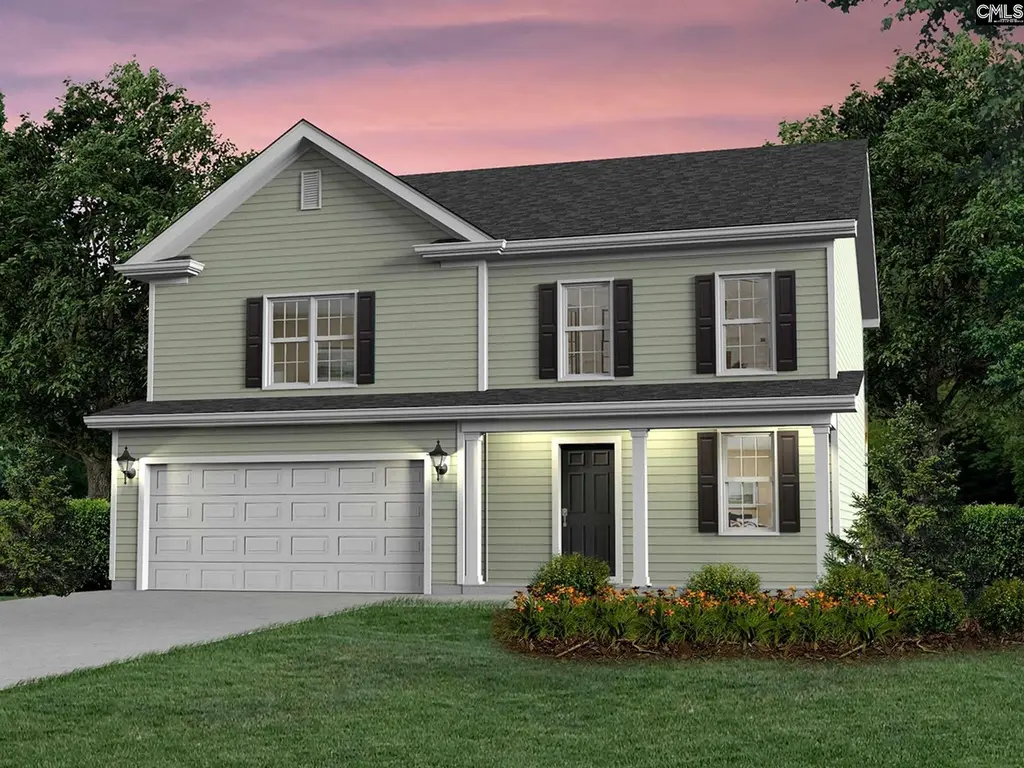
301 Rolling Knoll Dr · Dentsville, SC
Flood risk No data
- FEMA flood zone
- —
- Chance of flooding over 30 yrs
- —
- Est. flood insurance / yr
- —
Fire risk No data
- Est. fire insurance / yr
- —
Heat risk No data
- Hot days now (above threshold)
- —
- Hot days in 30 yrs
- —
Wind risk No data
- Chance of severe wind over 30 yrs
- —
Air-quality risk No data
- Unhealthy air days now
- —
- Unhealthy air days in 30 yrs
- —
Risk factors via First Street. Map © Google.
Why this score? — see what drove the D- grade
The composite is a weighted blend of 9 inputs, each scored 0–100. Each bar is that input's sub-score; the figure is the points it added to the 100-point composite (weight × sub-score).
- Cash flow +12.0/30.0
- Condition / age +4.8/5.0
- DSCR +3.6/10.0
- Schools +3.6/10.0
- Livability +3.6/5.0
- Rent growth +3.2/5.0
- 1% rule +3.0/10.0
- ARV discount +2.9/15.0
- Appreciation +0.0/10.0
$285,000
🖨 Deal sheet 📄 Offer letter ✓ Due diligence
Listing remarks
Welcome to this beautifully built 4-bedroom, 2 1/2-bath home offering 2,387 sq ft of open, modern living in The Summit community. Built in 2021 by Southern Traditional Homes, this CHiP-certified green home features a granite kitchen, smart home technology, energy-efficient systems, and a Sonos sound system, all in a neighborhood with pools, trails, and parks just minutes from everything Columbia has. Disclaimer: CMLS has not reviewed and, therefore, does not endorse vendors who may appear in listings.
Key facts
- Sonos sound system
- Trails
- Pools
Tags
Property features AI
Finance
- HOA & community: Property is part of an association
Exterior
- Parking: Attached garage with 2 parking spaces (garage at main level)
- Utilities: Public water; Public sewer
- Home design: Two-story residence
- Construction: Slab foundation
- Exterior features: Vinyl exterior finish; Paved road access; Approximately 0.24 acre lot
Interior
- Bedrooms: Master bedroom located on the second level
- Bathrooms: Two full bathrooms; One half bathroom; Two additional full second bathrooms
- Heating & cooling: Heat Pump on first level; Heat Pump on second level; Central air conditioning
- Interior features: Central cooling; Heat pumps serving first and second levels
Neighborhood map
What this means for you Summary
Snapshot
- This is a 4-bed/3.0-bath single-family listed at $285k. Condition is rated excellent.
Deal economics
- At list price, monthly cash flow is $-65 ($-785/yr) — negative.
- To cash-flow at today's rent, offer at most $273k (4.1% below list).
- To meet the 1% rule (rent ≥ 1% of price), the offer needs to be $227k (20.4% below list).
- Recommended offer: $227k (20.4% below list) — sets the bar for 1% rule.
Location & tenants
- Location reads 71/100 on livability (#50 in SC) — a middle-class / working-renter tenant base. Strengths: cost of living A+, health & safety A+, housing A; Watch: amenities D+, crime F, commute F.
- Richland 02 (suburban): math 35% / reading 47% proficiency, ranked #29 of 80 in SC (top 36%) — families likely to look elsewhere, expect single-tenant / working-renter base with shorter leases.
- Zoned schools: Rice Creek Elementary (math 36% / reading 34%, grade F, #339 of 597 statewide, top 57%, 737 students, 76% FRL); Ridge View High (math 43% / reading 76%, grade C+, #110 of 196 statewide, top 58%, 1,711 students, 60% FRL) — zoned schools average 68% FRL vs 38% district-wide (30 pts higher); higher-poverty schools than district average — tighter screening recommended.
- Market conditions: Rents rising (+2.8%/yr); 406 active listings in the ZIP; 15 comparable units currently listed for rent nearby; rentals at typical pace (median 14d on market — plan ~3-4 weeks tenant-placement turnaround); 3,472 units permitted in Richland County in 2024 (1,096 in 5+ unit buildings).
- This rent runs 37% of the median local income ($74k/yr) — at the standard rent-burdened threshold; future hikes will face affordability resistance.
Forward outlook
- Local home prices are declining (-3.0%/yr); year-one equity from $2k of loan paydown is wiped out by about $9k of value loss. Plan a longer hold.
- Richland County population projected at +30% by 2050 — long-run rental-demand tailwind backs the buy-and-hold thesis.
Negotiation context
- Only 7 days on market — expect competitive offers; lowballing is unlikely to land.
- 2 sale attempts since 5y ago with the ask held roughly flat each time — persistent listings suggest the price (not the market) is what's stuck; bring a comps-based counter.
Questions for the listing agent
- What do current leases actually rent for vs. the listed asking? Can we see a recent rent roll and the last 12 months of T-12 income?
- What does the HOA fee cover, when was the last increase, and are there any pending special assessments or reserve-fund shortfalls?
- Is there a deadline driving the sale (1031 exchange, divorce, estate, relocation)? That informs how much negotiation room exists.
- Schools are D-rated, which usually means shorter tenancies and higher turnover. Who's the typical renter profile here, and what's been the actual vacancy rate?
- Crime grade is F in this area — have there been break-ins, vandalism, or insurance claims at this property in the last 3 years? What carrier currently insures it and at what premium?
- The area grade is low — what's the realistic commute time and amenity access for the typical tenant pool here? Any planned neighborhood developments (good or bad) we should know about?
- What's the average days-on-market for RENTAL listings here right now (not sales)? A rising rental-DOM trend means longer vacancies and softer asking-rent achievability than the comps imply.
- What's the recent tenant-quality profile in this submarket — average credit score on applications, eviction rate, late-payment / NSF rate, and stable-employment percentage? A property-management company in the area should have these aggregated.
- How much new for-sale + rental construction is in the pipeline within 1–3 miles? Heavy new supply typically softens prices + rents 12–24 months out; constrained supply supports both.
Investment metrics
- 1% rule
- 0.80% ✗
- Cap rate
- 6.02%
- Cash-on-cash
- -0.98%
- DSCR
- 0.96
- GRM
- 10.5
CMA / ARV
- ARV (on-the-fly)
- $258,512
- Comps found
- 5
Show comp detail 5 sales within ~0.75 mi
| Address | Dist | Beds/Ba | Sqft | Sold | Price | $/sf | Match |
|---|---|---|---|---|---|---|---|
| 1 Duffie Ct | 0.46mi | 3/2.5 (-1) | 2,437 (+1%) | 6mo | $280,000 | $115 | 65 |
| 11 Long Glen Ct #113 | 0.30mi | 4/2.5 | 2,120 (-12%) | 5mo | $215,000 | $101 | 60 |
| 533 Autumn Glen Rd | 0.54mi | 4/2.5 | 2,161 (-11%) | 2mo | $190,000 | $88 | 53 |
| 845 Peony Ln | 0.66mi | 3/2.5 (-1) | 2,410 (-0%) | 18mo | $366,644 | $152 | 47 |
| 408 Indigo Ridge Dr | 0.60mi | 3/2.5 (-1) | 2,716 (+12%) | 1mo | $290,000 | $107 | 44 |
Match score weights: distance 35% · size 25% · config 20% · recency 20%. Top-matched comps best support the ARV.
Projected returns pro-forma
-3.0% appreciation · 2.81% rent growth · sell at horizon
- IRR
- -18.1%
- Equity multiple
- 0.36×
- Total profit
- $-50,816
- Equity at exit
- $42,494
- IRR
- -10.8%
- Equity multiple
- 0.35×
- Total profit
- $-51,525
- Equity at exit
- $24,642
Cash invested: $79,800 (down + closing). Projections, not guarantees.
Landlord ↔ Tenant lean methodology
- Overall (STATE)
- 90 Strongly Landlord-Friendly
- State South Carolina
- 90 Strongly Landlord-Friendly · R+6
- County
- — inherits STATE
- City
- — inherits STATE
ZIP-level market 29229
- Home prices YoY
- -21.5%
- Rents YoY
- 2.8%
- Active inventory
- 406
- Price-to-rent
- 10.5×
Monthly cashflow live
- Estimated rent
- $2,269 high interval (Pro) →
- Mortgage (P&I)
- −$1,495
- Tax from tax record
- −$201 /mo · $2,415/yr
- Insurance
- −$119
- HOA
- −$43
- Vacancy / Maint / Mgmt
- −$476
- Net cashflow
- $-65
Break-even live
UW: 25.0% down · 7.5% · 30yr · 1.5% tax · 5.0% vac · 8.0% maint · 8.0% mgmt
Financing live
Cash to close
- Down payment
- $71,250
- Closing costs
- $8,550
- Reserves months
- —
- Total cash needed
- —
Loan-product check · same deal, 3 products live
Conventional
25% down · 7.5% · 30yr
- Down + closing
- —
- Monthly P&I
- —
- Monthly cashflow
- —
- DSCR
- —
- Eligible?
- —
Personal DTI + credit; lowest rate.
DSCR
20% down · 8.5% · 30yr
- Down + closing
- —
- Monthly P&I
- —
- Monthly cashflow
- —
- DSCR
- —
- Eligible?
- —
No personal income docs; deal must DSCR.
Hard money
10% down · 12.0% · 12mo
- Down + closing
- —
- Monthly P&I
- —
- Monthly cashflow
- —
- DSCR
- —
- Eligible?
- —
Short-term bridge; refi at stabilization.
Rent comps 15 comps
| Address | Beds | Baths | Sqft | Rent | $/sqft | DOM | Units | Dist |
|---|---|---|---|---|---|---|---|---|
| 520 Timber Crest Dr Columbia, SC | 4.0 | 2.5 | 2195 | $2,250 | $1.03 | 23d | 1 | 0.42mi |
| 5 Elders Pond Ct Columbia, SC | 3.0 | 2.5 | 1640 | $1,795 | $1.09 | 14d | 1 | 0.55mi |
| 500 Castle Ridge Dr Columbia, SC | 3.0 | 2.0 | 1753 | $2,150 | $1.23 | 3d | 1 | 0.76mi |
| 669 Pine Lilly Dr Columbia, SC | 4.0 | 2.5 | 2912 | $2,595 | $0.89 | 23d | 1 | 1.01mi |
| 219 Pineclave Cir Columbia, SC | 4.0 | 3.0 | 2300 | $2,000 | $0.87 | 23d | 1 | 1.03mi |
| 201 Clearmeadow Dr Columbia, SC | 3.0 | 2.0 | 2423 | $2,379 | $0.98 | 2d | 1 | 1.03mi |
| 5 Glendevon Ct Columbia, SC | 5.0 | 2.5 | 2050 | $2,500 | $1.22 | 23d | 1 | 1.07mi |
| 429 Buttonbush Ct Columbia, SC | 4.0 | 2.5 | 2715 | $1,995 | $0.73 | 2d | 1 | 1.09mi |
| 416 Sandfarm Trl Blythewood, SC | 3.0 | 2.5 | 1664 | $2,025 | $1.22 | 14d | 1 | 1.14mi |
| 416 Sandfarm Trl Blythewood, SC | 3.0 | 2.5 | 1664 | $2,025 | $1.22 | 23d | 1 | 1.14mi |
| 102 Petworth Dr Columbia, SC | 4.0 | 3.0 | 1664 | $2,050 | $1.23 | 2d | 1 | 1.24mi |
| 313 Brook Hollow Dr Columbia, SC | 3.0 | 3.0 | 1879 | $1,700 | $0.90 | 14d | 1 | 1.34mi |
| 252 Bassett Loop Columbia, SC | 4.0 | 3.0 | 2260 | $2,295 | $1.02 | 23d | 1 | 1.38mi |
| 44 Ginkgo Ct Columbia, SC | 5.0 | 3.0 | 2743 | $2,750 | $1.00 | 3d | 1 | 1.41mi |
| 221 Fox Grove Cir Unit 1 Columbia, SC | 4.0 | 2.0 | 2046 | $1,700 | $0.83 | 2d | 1 | 1.47mi |
HOA detail
- Monthly dues
- $43 · $516/yr
- Likely covers
- pool
Listing history 3 events
-
2026-05-22$285,000 Active
-
2021-04-08historical
-
2021-04-08$209,900 Active
ⓘ Source: listings_history table (triggers on properties + properties_extension) + one-shot
backfill from property_details.listing_events for pre-trigger history.
Tax reassessment forecast SC · Resets to sale price
- Current annual tax
- $2,415 · $201/mo
- Projected year-2 tax
- $2,415 · $201/mo
- Expected delta
- $0/yr ($0/mo · 0.0%)
ⓘ Screening estimate from a state-policy table — verify with the county assessor before closing.
Nearby sold comps map
Loading sold comps map…
Walkable amenities ~0.75 mi
Loading nearby amenities…
Taxation est. · year 1
- Rental income
- $27,223
- − Mortgage interest
- −$15,964
- − Property taxes
- −$2,415
- − Insurance
- −$1,425
- − Repairs & maintenance
- −$2,178
- − Management
- −$2,178
- − HOA
- −$516
- − Depreciation
- −$8,291
- Taxable loss
- −$5,744
- Est. tax savings @ 24.0%
- +$1,379
- After-tax cash flow
- $594/yr
For passive investors: Depreciation is non-cash, so a rental often shows a tax loss while cash-flowing — sheltering income. Rental losses are passive: they offset passive income freely, and up to $25,000/yr can offset ordinary (W-2) income if you actively participate and your MAGI is under $100k (phasing out to $0 by $150k); unused losses carry forward. On sale, claimed depreciation is recaptured at up to 25%, and gains may owe capital-gains tax (a 1031 exchange can defer both). Figures are a year-1 estimate at your 24.0% rate — not tax advice; consult a CPA.
Condition & rehab AI · 1 photo
This beautifully built 2021 CHiP-certified home in The Summit community is in excellent condition with no visible repairs or maintenance needed. It offers a modern, open floor plan and is move-in ready.
Value-add opportunities
- Both Painting exterior and interior — Enhances curb appeal and interior aesthetics
- Both Landscaping improvements — Enhances curb appeal and adds value
- Both Smart home technology integration — Enhances home's modern appeal and adds value
Renovation cost estimate screening
Value-add ROI direction
- Both Painting exterior and interior — Enhances curb appeal and interior aesthetics ↑
- Both Landscaping improvements — Enhances curb appeal and adds value ↑
- Both Smart home technology integration — Enhances home's modern appeal and adds value ↑
ⓘ Cost ranges are severity-bucket heuristics (US national rule-of-thumb). Get contractor quotes + a written scope before underwriting a rehab budget.
Schools (NCES district)
- District
- Richland 02
- NCES district ID
- 4503390
- Math proficiency
- 35% ▼ -15.00%
- Reading proficiency
- 47% ▼ -5.00%
- Median HH income
- $59,684
- Composite
- 36.2/100
- National rank
- #4730
- State rank
- #29 of 80 in SC
Livability — Dentsville
- Score
- 71/100
- State rank
- #50
- US rank
- #6940
Category grades
Schools grade is shown separately in the Schools card above.
Census & demographics
- County
- Richland County · 389,530 people
- City population
- 52,835
- Metro
- Columbia, SC
- Population (ZIP)
- 51,861
- Household income
- $74,043
- Rent vs Own
- Severe rent burden
- 1939.0
Population outlook (Richland County) Hauer SSP2
- Today (2025)
- 459,667 people
- By 2030
- 487,524 · +6.1%
- By 2040
- 542,035 · +17.9%
- By 2050
- 595,371 · +29.5%
- By 2075
- 732,998 · +59.5%
- By 2100
- 820,415 · +78.5%
Race, ethnicity, and origin ACS 2023
- Neighborhood character
- Diverse neighborhood (Simpson 0.56)
- Race & ethnicity
- Black 62% White 24% Hispanic / Latino 8% Two or more races 6% Asian 3%
- Hispanic origin (detail)
- Mexican 2% Puerto Rican 2%
- Common ancestry
- Slovak 1% Lithuanian 1% Romanian 1%
- Foreign-born
- 7% · Canada, South Korea, Jamaica
- Languages at home
- 89% English-only · Spanish 6% Other Indo-European 1% Korean 1%
Political lean MEDSL · Richland
- 2024 margin
- Solid D (+34.6) · D 66.4% · R 31.8% · Other 1.8%
- 2008→2024 swing
- +5.7pp toward D · 2008: 28.9pp · 2024: 34.6pp
- All cycles
- 2024: D+34.6 2020: D+38.3 2016: D+32.9 2012: D+33.3 2008: D+28.9
Not yet ingested
- Civics
- —
Market trends
- HPI YoY
- ▼ -51.11%
- Current HPI
- 186.782
- Rent YoY
- ▲ 2.81%
- Metro
- Columbia, SC
- State GDP YoY
- ▲ 4.51%
- F500 in state
- 2
Industry mix (Fortune 500 HQ in SC)
| Industry | F500 HQs | Revenue |
|---|---|---|
| Packaging | 1 | $7B |
|
||
Price history
+35.8% since first listed3 events — show timeline
- 2026-05-22 Listed $285,000 Consolidated MLS
- 2021-04-08 Delisted — Consolidated MLS
- 2021-04-08 Listed $209,900 Consolidated MLS
Property tax history
+86.2%/yrLatest (2025): $2,415 · +3.6% YoY. Source: county tax records.
Cash-flow waterfall
monthlySold comps — $/sqft
last 12 mo · ≤1 miLoading sold comps…