 Multi-family
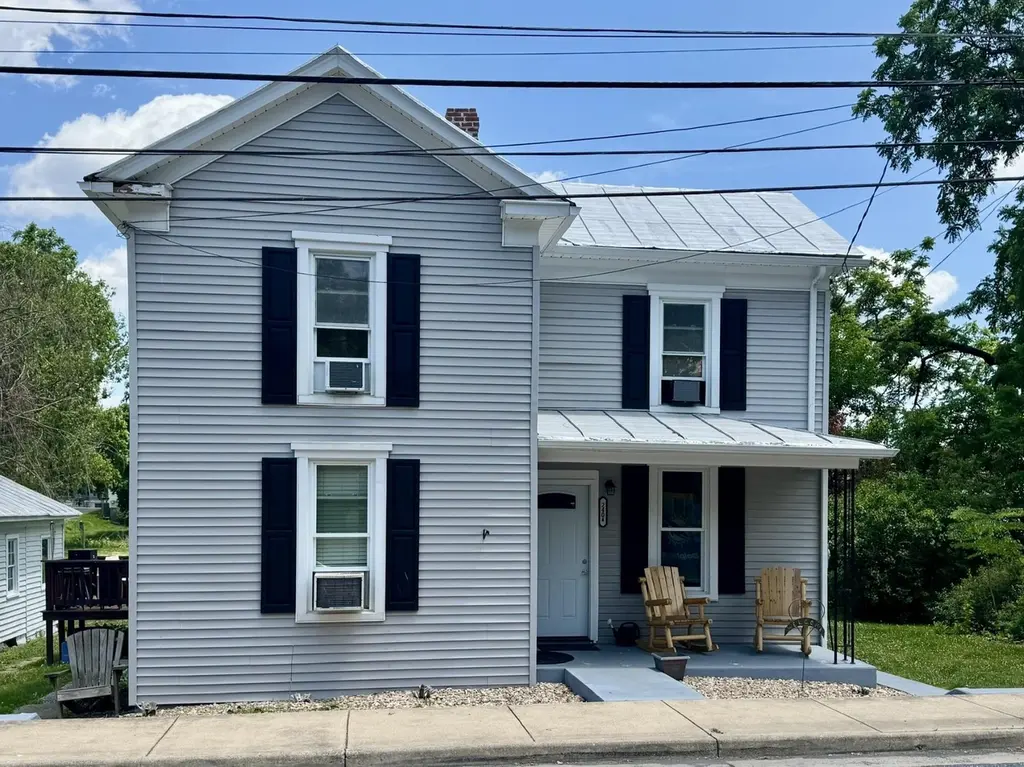
240 High St · Dayton, VA
Flood risk 7/10 · Major
- FEMA flood zone
- X (unshaded)
- Chance of flooding over 30 yrs
- 0.76%
- Est. flood insurance / yr
- $507 – $1,088
Fire risk 1/10 · Minimal
- Est. fire insurance / yr
- $666 – $1,236
Heat risk 5/10 · Moderate
- Hot days now (above 102°F)
- 7 days/yr
- Hot days in 30 yrs
- 18 days/yr
Wind risk 2/10 · Minimal
- Chance of severe wind over 30 yrs
- 1.0%
Air-quality risk 1/10 · Minimal
- Unhealthy air days now
- 0 days/yr
- Unhealthy air days in 30 yrs
- 0 days/yr
Risk factors via First Street. Map © Google.
Why this score? — see what drove the D grade
The composite is a weighted blend of 9 inputs, each scored 0–100. Each bar is that input's sub-score; the figure is the points it added to the 100-point composite (weight × sub-score).
- Cash flow +15.1/30.0
- ARV discount +7.5/15.0
- Schools +4.8/10.0
- DSCR +4.6/10.0
- Livability +3.4/5.0
- 1% rule +2.9/10.0
- Rent growth +2.5/5.0
- Condition / age +2.5/5.0
- Appreciation +0.0/10.0
$339,000
🖨 Deal sheet 📄 Offer letter ✓ Due diligence
Multi-family units
County records classify this as Multi-Family (2-4 Unit). Listing-text estimate: 1 unit. estimate disagrees with records
Listing remarks
Excellent investment opportunity in the town of Dayton. A one bedroom unit with one bath that has been fully renovated. And, a two-bedroom unit with 1 bath a deck, high ceilings, and some original hardwood floors. Tenants are month-to-month. Exceptional accessory building equipped with wood stove.
Key facts
- Fully renovated
- Wood stove
- Accessory building
Tags
Property features AI
Exterior
- Utilities: Public water; Public sewer; Cable available
- Home design: Detached multi-family property
- Construction: Vinyl siding; Stone foundation; Composition shingle roof
- Exterior features: Deck; Public road frontage
Interior
- Bedrooms: One 2-bedroom unit; One 1-bedroom unit
- Flooring: Hardwood; Luxury vinyl plank
- Bathrooms: Each unit has 1 bathroom
- Heating & cooling: Electric heating; Ductless cooling
- Interior features: Hardwood and luxury vinyl plank flooring; Exterior-entry basement
- Laundry & utility: Washer hookup; Dryer hookup
Neighborhood map
What this means for you Summary
Snapshot
- This is a 3-bed/2.0-bath multifamily listed at $339k.
Deal economics
- At list price, monthly cash flow is $45 ($537/yr) — positive.
- The deal already cash-flows at list — no discount required.
- To meet the 1% rule (rent ≥ 1% of price), the offer needs to be $269k (20.6% below list).
- Recommended offer: $269k (20.6% below list) — sets the bar for 1% rule.
Location & tenants
- Location reads 68/100 on livability (#275 in VA) — a middle-class / working-renter tenant base. Strengths: crime A+, housing A+, cost of living B+; Watch: amenities F, commute F, health & safety D-.
- Rockingham County Public School District (rural): math 47% / reading 64% proficiency, ranked #77 of 131 in VA (top 59%) — acceptable for families but not a draw, mixed tenant base, ~2y average lease.
- Zoned schools: Mountain View Elementary (math 37% / reading 52%, grade F, #827 of 1,108 statewide, top 77%, 406 students, 53% FRL); Wilbur S. Pence Middle (math 46% / reading 64%, grade B-, #189 of 342 statewide, top 56%, 668 students, 39% FRL); Turner Ashby High (math 78% / reading 82%, grade A, #60 of 319 statewide, top 19%, 994 students, 35% FRL).
- Market conditions: 16 active listings in the ZIP; 3 comparable units currently listed for rent nearby; rentals lingering (median 44d on market — plan ~5-8 weeks vacancy on turnover, expect pricing pressure); 100% of comp listings sitting > 30 days — soft ceiling on asking rent; 683 units permitted in Rockingham County in 2024 (0 in 5+ unit buildings).
Forward outlook
- Local home prices are declining (-3.0%/yr); year-one equity from $2k of loan paydown is wiped out by about $10k of value loss. Plan a longer hold.
- Rockingham County population projected at +6% by 2050 — modest demand growth; plan on rents tracking national, not racing it.
Negotiation context
- Only 11 days on market — expect competitive offers; lowballing is unlikely to land.
- Current owner paid $74k; list at $339k implies a 358% gain — meaningful room to come down on a strong offer.
Risks & watch-outs
- Watch-outs: flood insurance adds $66/mo; built in 1920 — expect roof / HVAC / electrical / plumbing capex.
- Climate carrying-cost: major flood risk; extreme-heat days projected 7→18/yr by 2055 (HVAC capex compounding) — expect insurance premiums to compound above CPI over the hold.
Questions for the listing agent
- Built in 1920 — when were the roof, HVAC, electrical panel, plumbing, and water heater last replaced?
- What's the actual annual flood-insurance premium (NFIP or private), and is the property in a SFHA with mandatory coverage?
- Is there a deadline driving the sale (1031 exchange, divorce, estate, relocation)? That informs how much negotiation room exists.
- Schools are B-rated — typically a magnet for longer-tenancy family renters. What's the average tenant stay here, and is there a school-zone premium baked into asking?
- The area grade is low — what's the realistic commute time and amenity access for the typical tenant pool here? Any planned neighborhood developments (good or bad) we should know about?
- What's the average days-on-market for RENTAL listings here right now (not sales)? A rising rental-DOM trend means longer vacancies and softer asking-rent achievability than the comps imply.
- What's the recent tenant-quality profile in this submarket — average credit score on applications, eviction rate, late-payment / NSF rate, and stable-employment percentage? A property-management company in the area should have these aggregated.
- How much new apartment / multifamily construction is in the pipeline within 1–3 miles? Heavy new supply (>2% of stock underway) typically softens rents 12–24 months out; light construction supports rent growth.
Investment metrics
- 1% rule
- 0.79% ✗
- Cap rate
- 6.69%
- Cash-on-cash
- 1.41%
- DSCR
- 1.06
- GRM
- 10.5
CMA / ARV
No comps found within radius.
Projected returns pro-forma
-3.0% appreciation · 3.0% rent growth · sell at horizon
- IRR
- -15.4%
- Equity multiple
- 0.45×
- Total profit
- $-52,205
- Equity at exit
- $50,546
- IRR
- -7.0%
- Equity multiple
- 0.55×
- Total profit
- $-42,281
- Equity at exit
- $29,311
Cash invested: $94,920 (down + closing). Projections, not guarantees.
Landlord ↔ Tenant lean methodology
- Overall (STATE)
- 55 Moderately Landlord-Leaning
- State Virginia
- 55 Moderately Landlord-Leaning · D+2
- County
- — inherits STATE
- City
- — inherits STATE
ZIP-level market 22821
- Home prices YoY
- -29.4%
- Active inventory
- 16
- Price-to-rent
- 22.1×
Monthly cashflow live
- Estimated rent
- $2,690 medium interval (Pro) →
- Mortgage (P&I)
- −$1,778
- Tax from tax record
- −$95 /mo · $1,139/yr
- Insurance
- −$141
- Flood insurance flood zone
- −$66 /mo · $798/yr
- HOA
- −$0
- Vacancy / Maint / Mgmt
- −$565
- Net cashflow
- $45
Break-even live
2-unit breakdown (identical units grouped — click to expand)
| Units | Beds | Baths | Est. rent |
|---|---|---|---|
| 1× unit | 1 | 1 | $1,276 |
| 1× unit | 2 | 1 | $1,414 |
| Total (2 units) | $2,690 | ||
UW: 25.0% down · 7.5% · 30yr · 1.5% tax · 5.0% vac · 8.0% maint · 8.0% mgmt
Financing live
Cash to close
- Down payment
- $84,750
- Closing costs
- $10,170
- Reserves months
- —
- Total cash needed
- —
Loan-product check · same deal, 3 products live
Conventional
25% down · 7.5% · 30yr
- Down + closing
- —
- Monthly P&I
- —
- Monthly cashflow
- —
- DSCR
- —
- Eligible?
- —
Personal DTI + credit; lowest rate.
DSCR
20% down · 8.5% · 30yr
- Down + closing
- —
- Monthly P&I
- —
- Monthly cashflow
- —
- DSCR
- —
- Eligible?
- —
No personal income docs; deal must DSCR.
Hard money
10% down · 12.0% · 12mo
- Down + closing
- —
- Monthly P&I
- —
- Monthly cashflow
- —
- DSCR
- —
- Eligible?
- —
Short-term bridge; refi at stabilization.
Rent comps 3 comps
| Address | Beds | Baths | Sqft | Rent | $/sqft | DOM | Units | Dist |
|---|---|---|---|---|---|---|---|---|
| 474 Diana Ct Rockingham, VA | 3.0 | 2.5 | 1549 | $2,300 | $1.48 | 43d | 1 | 1.33mi |
| 3368 Marble LOOP Harrisonburg, VA | 3.0 | 2.5 | 1710 | $1,795 | $1.05 | 43d | 1 | 1.38mi |
| 3407 Granite Rd , VA | 3.0 | 2.5 | 1220 | $2,250 | $1.84 | 43d | 1 | 1.41mi |
Listing history 10 events
-
2026-06-19days on market $339,000 Active 11 DOM
-
2026-06-18days on market $339,000 Active 10 DOM
-
2026-06-17days on market $339,000 Active 9 DOM
-
2026-06-16days on market $339,000 Active 8 DOM
-
2026-06-15days on market $339,000 Active 7 DOM
-
2026-06-14days on market $339,000 Active 5 DOM
-
2026-06-13days on market $339,000 Active 4 DOM
-
2026-06-10days on market $339,000 Active 2 DOM
-
2026-06-09remarks 298-char remark
-
2026-06-09$339,000 Active 1 DOM
ⓘ Source: listings_history table (triggers on properties + properties_extension) + one-shot
backfill from property_details.listing_events for pre-trigger history.
Tax reassessment forecast VA · Resets to sale price
- Current annual tax
- $1,139 · $95/mo
- Projected year-2 tax
- $2,780 · $232/mo
- Expected delta
- +$1,641/yr (+$137/mo · 144.1%)
ⓘ Screening estimate from a state-policy table — verify with the county assessor before closing.
Climate risk First Street
- Flood 7/10 Severe FEMA zone X (unshaded) · 76% chance over 30 yrs
- Wildfire 1/10 Low
- Heat 5/10 Major 7 d/yr ≥102°F today · 18 d/yr by 30 yrs out
- Wind 2/10 Low 100% chance of damaging wind over 30 yrs
- Air quality 1/10 Low 0 unhealthy d/yr today · 0 by 30 yrs out
Nearby sold comps map
Loading sold comps map…
Walkable amenities ~0.75 mi
Loading nearby amenities…
Taxation est. · year 1
- Rental income
- $32,280
- − Mortgage interest
- −$18,989
- − Property taxes
- −$1,139
- − Insurance
- −$2,492
- − Repairs & maintenance
- −$2,582
- − Management
- −$2,582
- − Depreciation
- −$9,862
- Taxable loss
- −$5,367
- Est. tax savings @ 24.0%
- +$1,288
- After-tax cash flow
- $1,825/yr
For passive investors: Depreciation is non-cash, so a rental often shows a tax loss while cash-flowing — sheltering income. Rental losses are passive: they offset passive income freely, and up to $25,000/yr can offset ordinary (W-2) income if you actively participate and your MAGI is under $100k (phasing out to $0 by $150k); unused losses carry forward. On sale, claimed depreciation is recaptured at up to 25%, and gains may owe capital-gains tax (a 1031 exchange can defer both). Figures are a year-1 estimate at your 24.0% rate — not tax advice; consult a CPA.
Schools (NCES district)
- District
- Rockingham County Public School District
- NCES district ID
- 5103390
- Math proficiency
- 47% ▼ -36.00%
- Reading proficiency
- 64% ▼ -12.00%
- Median HH income
- $53,178
- Composite
- 47.58/100
- National rank
- #2264
- State rank
- #77 of 131 in VA
Livability — Dayton
- Score
- 68/100
- State rank
- #275
- US rank
- #9847
Category grades
Schools grade is shown separately in the Schools card above.
Census & demographics
- Census place
- Dayton, VA
- Population (ZIP)
- 6,074
Population outlook (Rockingham County) Hauer SSP2
- Today (2025)
- 83,435 people
- By 2030
- 85,223 · +2.1%
- By 2040
- 87,667 · +5.1%
- By 2050
- 88,550 · +6.1%
- By 2075
- 90,331 · +8.3%
- By 2100
- 85,122 · +2.0%
Race, ethnicity, and origin ACS 2023
- Neighborhood character
- Predominantly White (87%)
- Race & ethnicity
- White 87% Hispanic / Latino 9% Two or more races 7% Black 2%
- Hispanic origin (detail)
- Mexican 3% Puerto Rican 3%
- Common ancestry
- Serbian 2% Lithuanian 2% Italian 2%
- Foreign-born
- 6% · Canada
- Languages at home
- 92% English-only · Spanish 6%
Political lean MEDSL · Rockingham
- 2024 margin
- Solid R (+37.0) · D 30.9% · R 68.0% · Other 1.1%
- 2008→2024 swing
- -1.0pp toward R · 2008: -36.0pp · 2024: -37.0pp
- All cycles
- 2024: R+37.0 2020: R+40.4 2016: R+43.5 2012: R+40.6 2008: R+36.0
Not yet ingested
- Civics
- —
Market trends
- HPI YoY
- ▼ -76.59%
- Current HPI
- 184.0463
- Rent YoY
- —
- Metro
- —
- State GDP YoY
- ▲ 2.40%
- F500 in state
- 50
Industry mix (Fortune 500 HQ in VA)
| Industry | F500 HQs | Revenue |
|---|---|---|
| Aerospace / Defense | 4 | $236B |
|
||
| Technology / Defense | 3 | $32B |
|
||
| Financial Services | 2 | $176B |
|
||
| Utilities | 2 | $27B |
|
||
| Insurance | 2 | $25B |
|
||
| Technology | 2 | $15B |
|
||
Price history
+358.1% since first listed2 events — show timeline
- 2026-06-08 Listed $339,000 HRAR
- 1999-10-01 Sold (Public Records) $74,000 Public Records
Property tax history
+3.3%/yrLatest (2025): $1,139 · +0.0% YoY. Source: county tax records.
Cash-flow waterfall
monthlySold comps — $/sqft
last 12 mo · ≤1 miLoading sold comps…