 Triplex
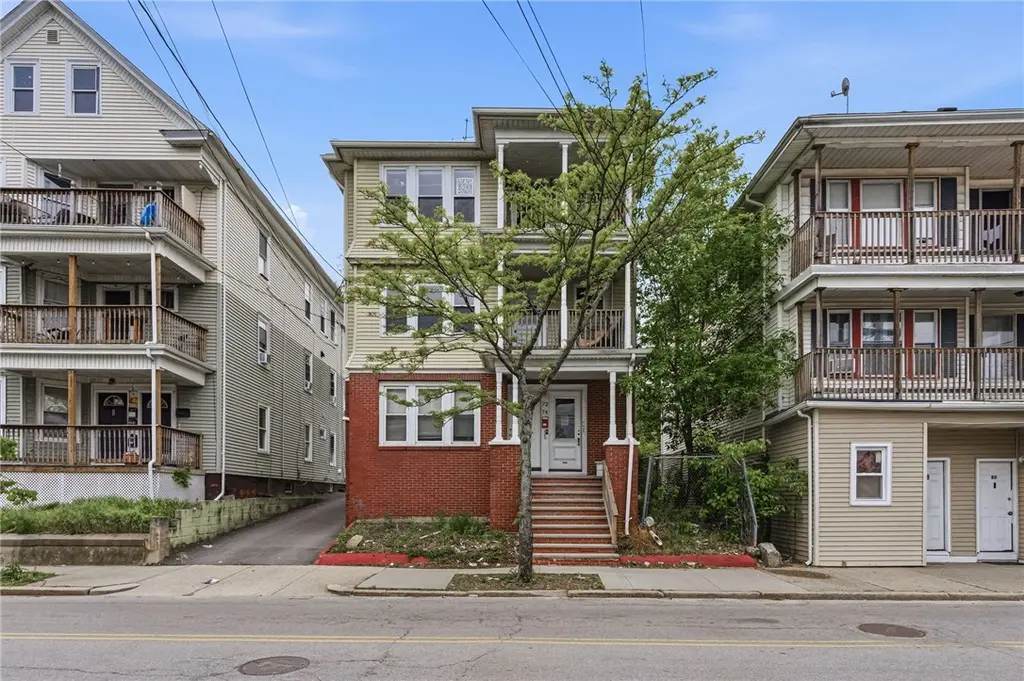
72 Academy Ave · Providence, RI
Flood risk 7/10 · Major
- FEMA flood zone
- X (unshaded)
- Chance of flooding over 30 yrs
- 0.76%
- Est. flood insurance / yr
- $473 – $860
Fire risk 1/10 · Minimal
- Est. fire insurance / yr
- $835 – $1,551
Heat risk 6/10 · Moderate
- Hot days now (above 96°F)
- 7 days/yr
- Hot days in 30 yrs
- 15 days/yr
Wind risk 6/10 · Moderate
- Chance of severe wind over 30 yrs
- 70.0%
Air-quality risk 2/10 · Minimal
- Unhealthy air days now
- 1 days/yr
- Unhealthy air days in 30 yrs
- 2 days/yr
Risk factors via First Street. Map © Google.
Why this score? — see what drove the B- grade
The composite is a weighted blend of 9 inputs, each scored 0–100. Each bar is that input's sub-score; the figure is the points it added to the 100-point composite (weight × sub-score).
- Cash flow +26.8/30.0
- ARV discount +12.3/15.0
- DSCR +9.2/10.0
- 1% rule +6.9/10.0
- Livability +4.2/5.0
- Rent growth +3.9/5.0
- Condition / age +2.5/5.0
- Schools +1.0/10.0
- Appreciation +0.0/10.0
$625,000
🖨 Deal sheet 📄 Offer letter ✓ Due diligence
Multi-family units
County records classify this as Multi-Family (2-4 Unit). Listing-text estimate: 3 units. confirmed
Listing remarks MLS
INVESTORS TAKE NOTICE!! OR MAKE THIS YOUR HOME. EITHER WAY A GREAT INVESTMENT! THIRD FLOOR FRESHLY PAINTED, REFINISHED FLOORS, REDONE BATH AND PANTRY. ALL SEPARATE UTILITIES. UPDATED ELECTRIC, INSULATED WINDOWS, NEWER HOT WATER TANKS, BOILERS AND FORCED AIR HEATING SYSTEMS ONLY 5 YEARS OLD. COMES WITH COIN OPERATED WASHER AND DRYER. CLOSE TO HIGHWAY, TRAIN, DOWNTOWN, SCHOOLS AND STORES. EVERYTHING YOU COULD WANT IS WAITING FOR YOU. VERY NICE PROPERTY!
Key facts
- Off street parking
- Tree lined streets
- 3,049 sq ft lot
Tags
Property features AI
Finance
- Other: Above-grade finished area reported
- Financial info: Property configured as a 3-unit multifamily (three 2-bedroom, 1-bath units); Unit rents listed: $1,500; $1,550; $1,500
Exterior
- Parking: No garage; Two off-street parking spaces
- Utilities: Sewer connected; Public water connected; Circuit breaker electrical service
- Home design: Single building containing three units; Multiple-story dwelling (total above-grade finished area listed)
- Construction: Brick and vinyl siding construction
- Exterior features: Brick and vinyl siding exterior; Sewer connected; Public water connected
Interior
- Kitchen: No specific kitchen appliance list provided
- Bedrooms: Three 2-bedroom units
- Flooring: Hardwood; Vinyl
- Bathrooms: Three full bathrooms (one per unit)
- Heating & cooling: Forced air heating; Gas heating
- Interior features: Hardwood and vinyl flooring; Full, unfinished basement with interior entry
- Laundry & utility: Gas water heater
Neighborhood map
What this means for you Summary
Snapshot
- This is a 3 × 2-bed/1.0-bath units multifamily listed at $625k.
Deal economics
- At list price, monthly cash flow is $2k ($20k/yr) — positive. Per door: $553/mo.
- The deal already cash-flows at list — no discount required.
- Meets the 1% rule at list price ($7k rent vs $625k).
- Recommended offer: $606k (3.0% below list) — sets the bar for market timing.
- Cap rate 9.6% vs local median 4.2% in Providence — top-decile yield for the area; either an underpriced asset or a hidden risk that comps aren't pricing in. Stress-test before assuming the spread holds.
Location & tenants
- Location reads 84/100 on livability (#2 in RI, #794 nationally) — a professional / high-income tenant draw. Strengths: amenities A+, commute A+, housing A+; Watch: employment C-, schools F.
- Providence (urban): math 8% / reading 16% proficiency, ranked #34 of 39 in RI (top 87%) — low school quality limits family demand, transient renter base, plan for 1-2y turnover; 79% free/reduced lunch — lower-income household profile, screen leases tightly.
- Market conditions: Rents rising fast (+5.5%/yr); 161 active listings in the ZIP; 776 units permitted in Providence County in 2024 (229 in 5+ unit buildings).
- At $7,432/mo this rent would consume 122% of the median local household income ($73k/yr) (locally 1561% of renters already pay >50% of income on rent) — very limited rent-growth headroom before tenants either downsize or default.
Forward outlook
- Local home prices are declining (-3.0%/yr); year-one equity from $4k of loan paydown is wiped out by about $19k of value loss. Plan a longer hold.
- Providence County population projected at +5% by 2050 — modest demand growth; plan on rents tracking national, not racing it.
- At projected returns (-3.0% appreciation + 5.5% rent growth), your $175k cash investment doubles in ~8 years — after that, you're playing with house money.
Negotiation context
- It's been on market 37 days — a 3% lower offer ($606k) is reasonable based on typical stale-listing flexibility.
- 6 sale attempts since 21y ago with the ask held roughly flat each time — persistent listings suggest the price (not the market) is what's stuck; bring a comps-based counter.
- Current owner paid $190k; list at $625k implies a 229% gain — meaningful room to come down on a strong offer.
Risks & watch-outs
- Watch-outs: flood insurance adds $56/mo; built in 1920 — expect roof / HVAC / electrical / plumbing capex.
- Climate carrying-cost: major flood risk; major wind risk, 70% chance of damaging wind over 30y; extreme-heat days projected 7→15/yr by 2055 (HVAC capex compounding) — expect insurance premiums to compound above CPI over the hold.
Questions for the listing agent
- It's been on market 37 days. Have you received any prior offers? Is the seller open to a 3% concession, seller financing, or rate buy-down credit?
- Can we see the unit-by-unit rent roll, current vacancy, and any below-market leases? What's the average tenancy length?
- What capital expenditures (roof, boiler, parking lot, exteriors) have been made in the last 5 years, and what's planned in the next 2?
- Built in 1920 — when were the roof, HVAC, electrical panel, plumbing, and water heater last replaced?
- What's the actual annual flood-insurance premium (NFIP or private), and is the property in a SFHA with mandatory coverage?
- Is there a deadline driving the sale (1031 exchange, divorce, estate, relocation)? That informs how much negotiation room exists.
- Schools are F-rated, which usually means shorter tenancies and higher turnover. Who's the typical renter profile here, and what's been the actual vacancy rate?
- What's the average days-on-market for RENTAL listings here right now (not sales)? A rising rental-DOM trend means longer vacancies and softer asking-rent achievability than the comps imply.
- What's the recent tenant-quality profile in this submarket — average credit score on applications, eviction rate, late-payment / NSF rate, and stable-employment percentage? A property-management company in the area should have these aggregated.
- How much new apartment / multifamily construction is in the pipeline within 1–3 miles? Heavy new supply (>2% of stock underway) typically softens rents 12–24 months out; light construction supports rent growth.
Investment metrics
- 1% rule
- 1.19% ✓
- Cap rate
- 9.59%
- Cash-on-cash
- 11.76%
- DSCR
- 1.52
- GRM
- 7.0
CMA / ARV
- ARV (median comp)
- $699,927
- List price
- $625,000
- Delta
- -10.70%
- Verdict
- UNDERPRICED
- Comps
- 20 within 2.0 mi
Projected returns pro-forma
-3.0% appreciation · 5.46% rent growth · sell at horizon
- IRR
- 3.4%
- Equity multiple
- 1.13×
- Total profit
- $23,290
- Equity at exit
- $93,190
- IRR
- 15.1%
- Equity multiple
- 2.36×
- Total profit
- $237,877
- Equity at exit
- $54,039
Cash invested: $175,000 (down + closing). Projections, not guarantees.
Landlord ↔ Tenant lean methodology
- Overall (STATE)
- 31 Tenant-Leaning
- State Rhode Island
- 31 Tenant-Leaning · D+8
- County
- — inherits STATE
- City
- — inherits STATE
ZIP-level market 02908
- Home prices YoY
- -27.1%
- Rents YoY
- 5.5%
- Active inventory
- 161
- Price-to-rent
- 21.0×
Monthly cashflow live
- Estimated rent
- $7,432 high interval (Pro) →
- Mortgage (P&I)
- −$3,278
- Tax from tax record
- −$619 /mo · $7,423/yr
- Insurance
- −$260
- Flood insurance flood zone
- −$56 /mo · $666/yr
- HOA
- −$0
- Vacancy / Maint / Mgmt
- −$1,561
- Net cashflow
- $1,659
Break-even live
3-unit breakdown (identical units grouped — click to expand)
| Units | Beds | Baths | Est. rent |
|---|---|---|---|
| 3× units | 2 | 1 | $7,431 |
| #1 | 2 | 1 | $2,477 |
| #2 | 2 | 1 | $2,477 |
| #3 | 2 | 1 | $2,477 |
| Total (3 units) | $7,432 | ||
UW: 25.0% down · 7.5% · 30yr · 1.5% tax · 5.0% vac · 8.0% maint · 8.0% mgmt
Financing live
Cash to close
- Down payment
- $156,250
- Closing costs
- $18,750
- Reserves months
- —
- Total cash needed
- —
Loan-product check · same deal, 3 products live
Conventional
25% down · 7.5% · 30yr
- Down + closing
- —
- Monthly P&I
- —
- Monthly cashflow
- —
- DSCR
- —
- Eligible?
- —
Personal DTI + credit; lowest rate.
DSCR
20% down · 8.5% · 30yr
- Down + closing
- —
- Monthly P&I
- —
- Monthly cashflow
- —
- DSCR
- —
- Eligible?
- —
No personal income docs; deal must DSCR.
Hard money
10% down · 12.0% · 12mo
- Down + closing
- —
- Monthly P&I
- —
- Monthly cashflow
- —
- DSCR
- —
- Eligible?
- —
Short-term bridge; refi at stabilization.
Listing history 32 events
-
2026-06-18days on market $625,000 Active 37 DOM
-
2026-06-17days on market $625,000 Active 36 DOM
-
2026-06-16days on market $625,000 Active 35 DOM
-
2026-06-15days on market $625,000 Active 34 DOM
-
2026-06-13days on market $625,000 Active 32 DOM
-
2026-06-09days on market $625,000 Active 28 DOM
-
2026-06-08days on market $625,000 Active 27 DOM
-
2026-06-07days on market $625,000 Active 26 DOM
-
2026-06-05days on market $625,000 Active 23 DOM
-
2026-06-03days on market $625,000 Active 22 DOM
-
2026-06-02days on market $625,000 Active 21 DOM
-
2026-06-01days on market $625,000 Active 20 DOM
-
2026-05-31days on market $625,000 Active 19 DOM
-
2026-05-12$650,000 Active 789-char remark
-
2024-11-04historical $1,550
-
2024-10-09$1,550
-
2018-04-03soldstatus $190,000 Sold 455-char remark
Show marketing remark (455 chars)
INVESTORS TAKE NOTICE!! OR MAKE THIS YOUR HOME. EITHER WAY A GREAT INVESTMENT! THIRD FLOOR FRESHLY PAINTED, REFINISHED FLOORS, REDONE BATH AND PANTRY. ALL SEPARATE UTILITIES. UPDATED ELECTRIC, INSULATED WINDOWS, NEWER HOT WATER TANKS, BOILERS AND FORCED AIR HEATING SYSTEMS ONLY 5 YEARS OLD. COMES WITH COIN OPERATED WASHER AND DRYER. CLOSE TO HIGHWAY, TRAIN, DOWNTOWN, SCHOOLS AND STORES. EVERYTHING YOU COULD WANT IS WAITING FOR YOU. VERY NICE PROPERTY!
-
2018-02-27soldstatus $190,000
-
2018-02-01historical Under Contract: Inspection Period 455-char remark
Show marketing remark (455 chars)
INVESTORS TAKE NOTICE!! OR MAKE THIS YOUR HOME. EITHER WAY A GREAT INVESTMENT! THIRD FLOOR FRESHLY PAINTED, REFINISHED FLOORS, REDONE BATH AND PANTRY. ALL SEPARATE UTILITIES. UPDATED ELECTRIC, INSULATED WINDOWS, NEWER HOT WATER TANKS, BOILERS AND FORCED AIR HEATING SYSTEMS ONLY 5 YEARS OLD. COMES WITH COIN OPERATED WASHER AND DRYER. CLOSE TO HIGHWAY, TRAIN, DOWNTOWN, SCHOOLS AND STORES. EVERYTHING YOU COULD WANT IS WAITING FOR YOU. VERY NICE PROPERTY!
-
2018-01-18$209,900 Active 455-char remark
Show marketing remark (455 chars)
INVESTORS TAKE NOTICE!! OR MAKE THIS YOUR HOME. EITHER WAY A GREAT INVESTMENT! THIRD FLOOR FRESHLY PAINTED, REFINISHED FLOORS, REDONE BATH AND PANTRY. ALL SEPARATE UTILITIES. UPDATED ELECTRIC, INSULATED WINDOWS, NEWER HOT WATER TANKS, BOILERS AND FORCED AIR HEATING SYSTEMS ONLY 5 YEARS OLD. COMES WITH COIN OPERATED WASHER AND DRYER. CLOSE TO HIGHWAY, TRAIN, DOWNTOWN, SCHOOLS AND STORES. EVERYTHING YOU COULD WANT IS WAITING FOR YOU. VERY NICE PROPERTY!
-
2013-12-19price $72,900
Show marketing remark (141 chars)
Large brick front 3 family with detached 2 car garage! Needs rehab, inspections for informational purposes only, sold as is! See attachments.
-
2013-06-06historical
-
2013-04-12$149,900
-
2009-07-29soldstatus $65,000
Show marketing remark (141 chars)
Large brick front 3 family with detached 2 car garage! Needs rehab, inspections for informational purposes only, sold as is! See attachments.
-
2009-03-13historical
Show marketing remark (141 chars)
Large brick front 3 family with detached 2 car garage! Needs rehab, inspections for informational purposes only, sold as is! See attachments.
-
2009-02-05$78,900
Show marketing remark (141 chars)
Large brick front 3 family with detached 2 car garage! Needs rehab, inspections for informational purposes only, sold as is! See attachments.
-
2008-10-27soldstatus $93,500
-
2006-06-02soldstatus $350,000
-
2006-01-24soldstatus $295,000
-
2005-09-16historical
-
2005-08-24$310,000
-
2004-10-13soldstatus $265,000
ⓘ Source: listings_history table (triggers on properties + properties_extension) + one-shot
backfill from property_details.listing_events for pre-trigger history.
Tax reassessment forecast RI · Partial reset (capped growth)
- Current annual tax
- $7,423 · $619/mo
- Projected year-2 tax
- $8,805 · $734/mo
- Expected delta
- +$1,382/yr (+$115/mo · 18.6%)
ⓘ Screening estimate from a state-policy table — verify with the county assessor before closing.
Climate risk First Street
- Flood 7/10 Severe FEMA zone X (unshaded) · 76% chance over 30 yrs
- Wildfire 1/10 Low
- Heat 6/10 Major 7 d/yr ≥96°F today · 15 d/yr by 30 yrs out
- Wind 6/10 Major 70% chance of damaging wind over 30 yrs
- Air quality 2/10 Low 1 unhealthy d/yr today · 2 by 30 yrs out
Nearby sold comps map
Loading sold comps map…
Walkable amenities ~0.75 mi
Loading nearby amenities…
Taxation est. · year 1
- Rental income
- $89,184
- − Mortgage interest
- −$35,010
- − Property taxes
- −$7,423
- − Insurance
- −$3,792
- − Repairs & maintenance
- −$7,135
- − Management
- −$7,135
- − Depreciation
- −$18,182
- Taxable income
- $10,509
- Est. tax owed @ 24.0%
- −$2,522
- After-tax cash flow
- $17,388/yr
For passive investors: Depreciation is non-cash, so a rental often shows a tax loss while cash-flowing — sheltering income. Rental losses are passive: they offset passive income freely, and up to $25,000/yr can offset ordinary (W-2) income if you actively participate and your MAGI is under $100k (phasing out to $0 by $150k); unused losses carry forward. On sale, claimed depreciation is recaptured at up to 25%, and gains may owe capital-gains tax (a 1031 exchange can defer both). Figures are a year-1 estimate at your 24.0% rate — not tax advice; consult a CPA.
Schools (NCES district)
- District
- Providence
- NCES district ID
- 4400900
- Math proficiency
- 8% ▼ -4.00%
- Reading proficiency
- 16% ▼ -2.00%
- Median HH income
- $38,197
- Composite
- 10.12/100
- National rank
- #9803
- State rank
- #34 of 39 in RI
Livability — Providence
- Score
- 84/100
- State rank
- #2
- US rank
- #794
Category grades
Schools grade is shown separately in the Schools card above.
Census & demographics
- Census place
- Providence, RI
- County
- Providence County · 548,917 people
- City population
- 212,734
- Metro
- Providence-Warwick, RI-MA
- Population (ZIP)
- 39,500
- Household income
- $73,081
- Rent vs Own
- Severe rent burden
- 1561.0
Population outlook (Providence County) Hauer SSP2
- Today (2025)
- 653,469 people
- By 2030
- 660,819 · +1.1%
- By 2040
- 672,747 · +3.0%
- By 2050
- 683,741 · +4.6%
- By 2075
- 720,435 · +10.2%
- By 2100
- 741,582 · +13.5%
Race, ethnicity, and origin ACS 2023
- Neighborhood character
- Diverse neighborhood (Simpson 0.68)
- Race & ethnicity
- Hispanic / Latino 43% White 33% Two or more races 22% Black 15% Asian 4%
- Hispanic origin (detail)
- Mexican 4% Puerto Rican 5% Dominican 16%
- Common ancestry
- Swiss 4% Hispanic 3% Russian 3%
- Foreign-born
- 33% · Canada, China, South Korea
- Languages at home
- 53% English-only · Spanish 36% French/Haitian/Cajun 4% Other Indo-European 2%
Political lean MEDSL · Providence
- 2024 margin
- D (+14.4) · D 56.1% · R 41.7% · Other 2.2%
- 2008→2024 swing
- -20.0pp toward R · 2008: 34.4pp · 2024: 14.4pp
- All cycles
- 2024: D+14.4 2020: D+22.9 2016: D+21.2 2012: D+34.9 2008: D+34.4
Not yet ingested
- Civics
- —
Market trends
- HPI YoY
- ▼ -151.12%
- Current HPI
- 407.0502
- Rent YoY
- ▲ 5.46%
- Metro
- Providence-Warwick, RI-MA
- State GDP YoY
- ▲ 2.25%
- F500 in state
- 10
Industry mix (Fortune 500 HQ in RI)
| Industry | F500 HQs | Revenue |
|---|---|---|
| Healthcare | 1 | $373B |
|
||
| Food Distribution | 1 | $31B |
|
||
| Aerospace / Defense | 1 | $14B |
|
||
| Financial Services | 1 | $8B |
|
||
| Consumer Goods | 1 | $4B |
|
||
Price history
+135.8% since first listed20 events — show timeline
- 2026-05-28 Price Changed $625,000 RIS
- 2026-05-12 Listed $650,000 RIS
- 2024-11-04 Rental Removed $1,550 RENTALBEAST
- 2024-10-09 Listed for Rent $1,550 RENTALBEAST
- 2018-04-03 Sold (MLS) $190,000 RIS
- 2018-02-27 Sold (Public Records) $190,000 Public Records
- 2018-02-01 Contingent — RIS
- 2018-01-18 Listed $209,900 RIS
- 2013-12-19 Price Changed $72,900 RIS
- 2013-06-06 Listing Removed — RIS
- 2013-04-12 Listed $149,900 RIS
- 2009-07-29 Sold (MLS) $65,000 RIS
- 2009-03-13 Listing Removed — RIS
- 2009-02-05 Listed $78,900 RIS
- 2008-10-27 Sold (Public Records) $93,500 Public Records
- 2006-06-02 Sold (Public Records) $350,000 Public Records
- 2006-01-24 Sold (Public Records) $295,000 Public Records
- 2005-09-16 Listing Removed — RIS
- 2005-08-24 Listed $310,000 RIS
- 2004-10-13 Sold (Public Records) $265,000 Public Records
Property tax history
+3.1%/yrLatest (2025): $7,423 · +15.0% YoY. Source: county tax records.
Cash-flow waterfall
monthlySold comps — $/sqft
last 12 mo · ≤1 miLoading sold comps…