 Duplex
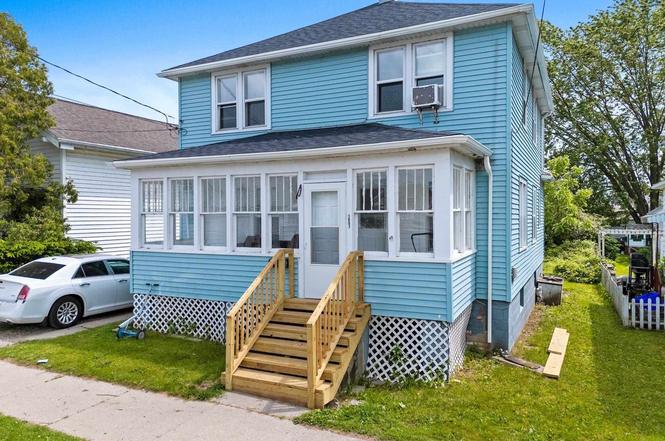
1807 21st St · Two Rivers, WI
Flood risk 1/10 · Minimal
- FEMA flood zone
- X (unshaded)
- Chance of flooding over 30 yrs
- 0.0%
- Est. flood insurance / yr
- $473 – $860
Fire risk 1/10 · Minimal
- Est. fire insurance / yr
- $636 – $1,182
Heat risk 1/10 · Minimal
- Hot days now (above 89°F)
- 7 days/yr
- Hot days in 30 yrs
- 14 days/yr
Wind risk 1/10 · Minimal
- Chance of severe wind over 30 yrs
- —
Air-quality risk 2/10 · Minimal
- Unhealthy air days now
- 1 days/yr
- Unhealthy air days in 30 yrs
- 2 days/yr
Risk factors via First Street. Map © Google.
Why this score? — see what drove the C grade
The composite is a weighted blend of 9 inputs, each scored 0–100. Each bar is that input's sub-score; the figure is the points it added to the 100-point composite (weight × sub-score).
- Cash flow +25.2/30.0
- DSCR +8.3/10.0
- ARV discount +7.5/15.0
- 1% rule +6.0/10.0
- Livability +3.6/5.0
- Rent growth +2.5/5.0
- Condition / age +2.5/5.0
- Schools +2.1/10.0
- Appreciation +0.0/10.0
$189,900
🖨 Deal sheet 📄 Offer letter ✓ Due diligence
Multi-family units
County records classify this as Multi-Family (2-4 Unit). Listing-text estimate: 2 units. confirmed
Listing remarks MLS
Charming & Updated Duplex in Two Rivers! This well-maintained upper/lower duplex offers a fantastic investment opportunity or owner-occupant potential. Featuring separate utility meters, tenants can conveniently handle their own utilities. A spacious shared basement provides ample storage and includes a washer and dryer for added convenience. Recent updates throughout the building include newer paint, flooring, furnace, windows, and appliances, ensuring a modern and move-in-ready space. Off-street parking for one car adds extra value. Don't miss this great opportunity in a prime location--schedule your showing today!
Key facts
- Balcony handrails
- Newer flooring
- Front stairs
Tags
Property features AI
Finance
- Other: Two-unit building (duplex)
Exterior
- Parking: Outside parking
- Utilities: Municipal water; Municipal sewer; Separate electric meters
- Home design: Multi-family property; 2-story / bi-level building; Estimated total living area between 1,501 and 1,750 sq ft
- Construction: Assessor/public record lists year built; Finished below-grade area: none
- Exterior features: Vinyl exterior; Lot under 1/2 acre (approx. 0.05 acre); Residential zoning
Interior
- Kitchen: Two stoves and two refrigerators included (one set per unit)
- Bedrooms: Each unit has 2 bedrooms (Unit 2 bedrooms: 12 x 13 and 12 x 10)
- Bathrooms: Each unit has 1 full bathroom
- Heating & cooling: Forced air heating; Natural gas heat
- Interior features: Cable/satellite available; Full stone basement
- Laundry & utility: Separate electric meters
Neighborhood map
What this means for you Summary
Snapshot
- This is a 2 × 2-bed/1.0-bath units multifamily listed at $190k.
Deal economics
- At list price, monthly cash flow is $425 ($5k/yr) — positive. Per door: $213/mo.
- The deal already cash-flows at list — no discount required.
- Meets the 1% rule at list price ($2k rent vs $190k).
- Cap rate 9.0% vs local median 3.9% in Two Rivers — top-decile yield for the area; either an underpriced asset or a hidden risk that comps aren't pricing in. Stress-test before assuming the spread holds.
Location & tenants
- Location reads 71/100 on livability (#280 in WI) — a middle-class / working-renter tenant base. Strengths: cost of living A+, housing A+, crime A; Watch: schools D-, amenities F, commute F.
- Two Rivers Public School District (town): math 20% / reading 28% proficiency, ranked #318 of 342 in WI (top 93%) — low school quality limits family demand, transient renter base, plan for 1-2y turnover.
- Market conditions: 66 active listings in the ZIP; 100 units permitted in Manitowoc County in 2024 (0 in 5+ unit buildings).
- This rent runs 41% of the median local income ($61k/yr) — at the standard rent-burdened threshold; future hikes will face affordability resistance.
Forward outlook
- Local home prices are declining (-3.0%/yr); year-one equity from $1k of loan paydown is wiped out by about $6k of value loss. Plan a longer hold.
- Manitowoc County population projected at -21% by 2050 — secular population decline; favor cash flow + early exit over multi-decade hold.
Negotiation context
- Only 1 days on market — expect competitive offers; lowballing is unlikely to land.
- 7 sale attempts since 13y ago with the ask held roughly flat each time — persistent listings suggest the price (not the market) is what's stuck; bring a comps-based counter.
- Current owner paid $135k; 41% above their basis — modest negotiation headroom, anchor on the comps not their cost.
Risks & watch-outs
- Watch-outs: built in 1905 — expect roof / HVAC / electrical / plumbing capex.
Questions for the listing agent
- Can we see the unit-by-unit rent roll, current vacancy, and any below-market leases? What's the average tenancy length?
- What capital expenditures (roof, boiler, parking lot, exteriors) have been made in the last 5 years, and what's planned in the next 2?
- Built in 1905 — when were the roof, HVAC, electrical panel, plumbing, and water heater last replaced?
- Is there a deadline driving the sale (1031 exchange, divorce, estate, relocation)? That informs how much negotiation room exists.
- Schools are D-rated, which usually means shorter tenancies and higher turnover. Who's the typical renter profile here, and what's been the actual vacancy rate?
- What's the average days-on-market for RENTAL listings here right now (not sales)? A rising rental-DOM trend means longer vacancies and softer asking-rent achievability than the comps imply.
- What's the recent tenant-quality profile in this submarket — average credit score on applications, eviction rate, late-payment / NSF rate, and stable-employment percentage? A property-management company in the area should have these aggregated.
- How much new apartment / multifamily construction is in the pipeline within 1–3 miles? Heavy new supply (>2% of stock underway) typically softens rents 12–24 months out; light construction supports rent growth.
Investment metrics
- 1% rule
- 1.10% ✓
- Cap rate
- 8.98%
- Cash-on-cash
- 9.60%
- DSCR
- 1.43
- GRM
- 7.5
CMA / ARV
- ARV (on-the-fly)
- $91,866
- Comps found
- 4
Show comp detail 4 sales within ~0.75 mi
| Address | Dist | Beds/Ba | Sqft | Sold | Price | $/sf | Match |
|---|---|---|---|---|---|---|---|
| 1910 E River St | 0.42mi | 4/2.0 | 1,600 (+6%) | 7mo | $64,000 | $40 | 64 |
| 2122 Washington St | 0.26mi | 4/2.0 | 1,638 (+9%) | 21mo | $100,000 | $61 | 56 |
| 1911 Monroe St | 0.16mi | 4/2.0 | 1,729 (+15%) | 18mo | $94,000 | $54 | 53 |
| 2213 14th St | 0.52mi | 4/2.0 | 1,728 (+15%) | 8mo | $175,000 | $101 | 45 |
Match score weights: distance 35% · size 25% · config 20% · recency 20%. Top-matched comps best support the ARV.
Projected returns pro-forma
-3.0% appreciation · 3.0% rent growth · sell at horizon
- IRR
- -1.8%
- Equity multiple
- 0.93×
- Total profit
- $-3,700
- Equity at exit
- $28,315
- IRR
- 7.8%
- Equity multiple
- 1.59×
- Total profit
- $31,589
- Equity at exit
- $16,419
Cash invested: $53,172 (down + closing). Projections, not guarantees.
Landlord ↔ Tenant lean methodology
- Overall (STATE)
- 73 Landlord-Friendly
- State Wisconsin
- 73 Landlord-Friendly · R+2
- County
- — inherits STATE
- City
- — inherits STATE
ZIP-level market 54241
- Home prices YoY
- -28.7%
- Active inventory
- 66
- Price-to-rent
- 15.1×
Monthly cashflow live
- Estimated rent
- $2,098 medium interval (Pro) →
- Mortgage (P&I)
- −$996
- Tax from tax record
- −$157 /mo · $1,885/yr
- Insurance
- −$79
- HOA
- −$0
- Vacancy / Maint / Mgmt
- −$441
- Net cashflow
- $425
Break-even live
2-unit breakdown (identical units grouped — click to expand)
| Units | Beds | Baths | Est. rent |
|---|---|---|---|
| 2× units | 2 | 1 | $2,098 |
| #1 | 2 | 1 | $1,049 |
| #2 | 2 | 1 | $1,049 |
| Total (2 units) | $2,098 | ||
UW: 25.0% down · 7.5% · 30yr · 1.5% tax · 5.0% vac · 8.0% maint · 8.0% mgmt
Financing live
Cash to close
- Down payment
- $47,475
- Closing costs
- $5,697
- Reserves months
- —
- Total cash needed
- —
Loan-product check · same deal, 3 products live
Conventional
25% down · 7.5% · 30yr
- Down + closing
- —
- Monthly P&I
- —
- Monthly cashflow
- —
- DSCR
- —
- Eligible?
- —
Personal DTI + credit; lowest rate.
DSCR
20% down · 8.5% · 30yr
- Down + closing
- —
- Monthly P&I
- —
- Monthly cashflow
- —
- DSCR
- —
- Eligible?
- —
No personal income docs; deal must DSCR.
Hard money
10% down · 12.0% · 12mo
- Down + closing
- —
- Monthly P&I
- —
- Monthly cashflow
- —
- DSCR
- —
- Eligible?
- —
Short-term bridge; refi at stabilization.
Listing history 2 events
-
2026-06-18remarks 524-char remark
-
2026-06-18$189,900 Active 1 DOM
ⓘ Source: listings_history table (triggers on properties + properties_extension) + one-shot
backfill from property_details.listing_events for pre-trigger history.
Tax reassessment forecast WI · Partial reset (capped growth)
- Current annual tax
- $1,885 · $157/mo
- Projected year-2 tax
- $2,699 · $225/mo
- Expected delta
- +$814/yr (+$68/mo · 43.2%)
ⓘ Screening estimate from a state-policy table — verify with the county assessor before closing.
Climate risk First Street
- Flood 1/10 Low FEMA zone X (unshaded) · 0% chance over 30 yrs
- Wildfire 1/10 Low
- Heat 1/10 Low 7 d/yr ≥89°F today · 14 d/yr by 30 yrs out
- Wind 1/10 Low
- Air quality 2/10 Low 1 unhealthy d/yr today · 2 by 30 yrs out
Nearby sold comps map
Loading sold comps map…
Walkable amenities ~0.75 mi
Loading nearby amenities…
Taxation est. · year 1
- Rental income
- $25,176
- − Mortgage interest
- −$10,637
- − Property taxes
- −$1,885
- − Insurance
- −$950
- − Repairs & maintenance
- −$2,014
- − Management
- −$2,014
- − Depreciation
- −$5,524
- Taxable income
- $2,151
- Est. tax owed @ 24.0%
- −$516
- After-tax cash flow
- $4,588/yr
For passive investors: Depreciation is non-cash, so a rental often shows a tax loss while cash-flowing — sheltering income. Rental losses are passive: they offset passive income freely, and up to $25,000/yr can offset ordinary (W-2) income if you actively participate and your MAGI is under $100k (phasing out to $0 by $150k); unused losses carry forward. On sale, claimed depreciation is recaptured at up to 25%, and gains may owe capital-gains tax (a 1031 exchange can defer both). Figures are a year-1 estimate at your 24.0% rate — not tax advice; consult a CPA.
Schools (NCES district)
- District
- Two Rivers Public School District
- NCES district ID
- 5515120
- Math proficiency
- 20% ▼ -11.00%
- Reading proficiency
- 28% ▼ -5.00%
- Median HH income
- $44,006
- Composite
- 20.63/100
- National rank
- #8545
- State rank
- #318 of 342 in WI
Livability — Two Rivers
- Score
- 71/100
- State rank
- #280
- US rank
- #7250
Category grades
Schools grade is shown separately in the Schools card above.
Census & demographics
- Census place
- Two Rivers, WI
- County
- Manitowoc County · 55,069 people
- City population
- 14,120
- Metro
- Manitowoc, WI
- Population (ZIP)
- 14,120
- Household income
- $61,014
- Rent vs Own
- Severe rent burden
- 199.0
Population outlook (Manitowoc County) Hauer SSP2
- Today (2025)
- 76,561 people
- By 2030
- 74,096 · -3.2%
- By 2040
- 67,752 · -11.5%
- By 2050
- 60,731 · -20.7%
- By 2075
- 48,723 · -36.4%
- By 2100
- 39,250 · -48.7%
Race, ethnicity, and origin ACS 2023
- Neighborhood character
- Predominantly White (89%)
- Race & ethnicity
- White 89% Two or more races 7% Hispanic / Latino 5%
- Common ancestry
- Romanian 12% Lithuanian 5% Portuguese 4%
- Foreign-born
- 3% · Canada
- Languages at home
- 96% English-only · Spanish 3%
Political lean MEDSL · Manitowoc
- 2024 margin
- Strong R (+23.4) · D 37.6% · R 61.0% · Other 1.4%
- 2008→2024 swing
- -30.9pp toward R · 2008: 7.5pp · 2024: -23.4pp
- All cycles
- 2024: R+23.4 2020: R+23.2 2016: R+21.7 2012: R+2.8 2008: D+7.5
Not yet ingested
- Civics
- —
Market trends
- HPI YoY
- ▼ -105.14%
- Current HPI
- 261.6254
- Rent YoY
- —
- Metro
- Manitowoc, WI
- State GDP YoY
- ▲ 2.10%
- F500 in state
- 20
Industry mix (Fortune 500 HQ in WI)
| Industry | F500 HQs | Revenue |
|---|---|---|
| Industrial Machinery | 4 | $23B |
|
||
| Industrial Technology | 2 | $36B |
|
||
| Insurance | 1 | $36B |
|
||
| Professional Services | 1 | $19B |
|
||
| Utilities | 1 | $9B |
|
||
| Consumer Goods | 1 | $3B |
|
||
Price history
+259.0% since first listed19 events — show timeline
- 2026-06-18 Listed $189,900 RANW
- 2025-04-21 Sold (Public Records) $135,000 Public Records
- 2025-04-18 Sold (MLS) $135,000 METROMLS
- 2025-03-23 Pending — METROMLS
- 2025-02-24 Listed $140,000 METROMLS
- 2024-08-08 Listing Removed — METROMLS
- 2024-07-06 Listed $129,900 METROMLS
- 2024-01-01 Rental Removed $850 APPFOLIO
- 2023-10-21 Listed for Rent $850 APPFOLIO
- 2023-10-16 Sold (Public Records) $110,500 Public Records
- 2022-12-05 Sold (MLS) $50,000 METROMLS
- 2022-11-17 Contingent — METROMLS
- 2022-11-14 Price Changed $74,900 METROMLS
- 2022-11-07 Price Changed $79,900 METROMLS
- 2022-11-07 Relisted — METROMLS
- 2022-10-23 Contingent — METROMLS
- 2022-10-18 Listed $89,900 METROMLS
- 2013-04-15 Listed $52,900 METROMLS
- 2013-04-15 Listing Removed — METROMLS
Property tax history
+4.0%/yrLatest (2025): $1,885 · +5.4% YoY. Source: county tax records.
Cash-flow waterfall
monthlySold comps — $/sqft
last 12 mo · ≤1 miLoading sold comps…