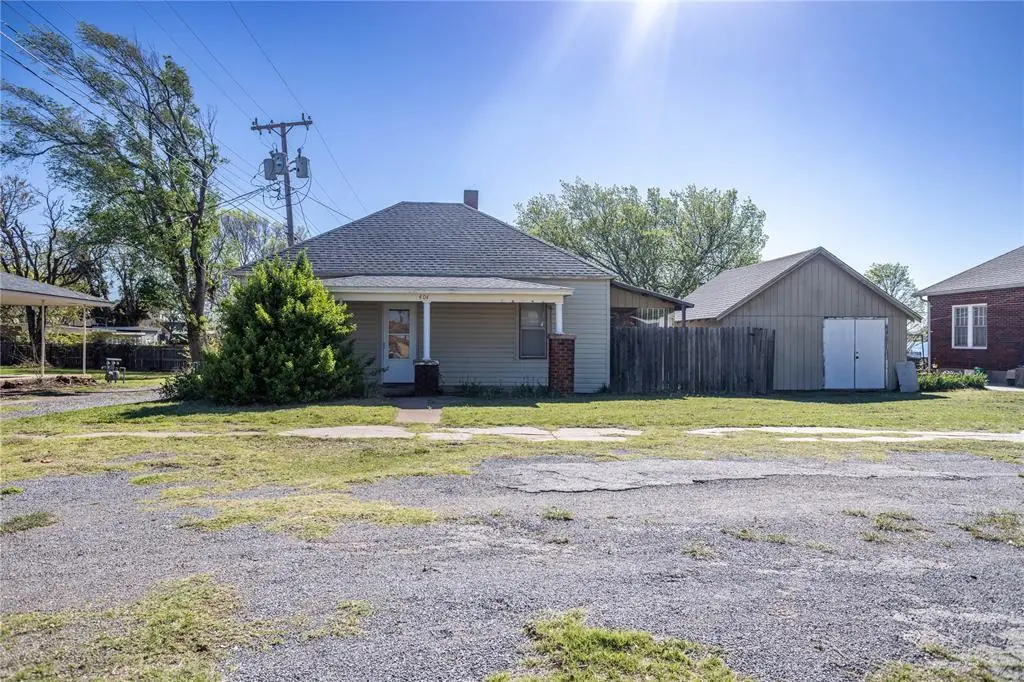
404 N State St · Weatherford, OK
Flood risk 1/10 · Minimal
- FEMA flood zone
- X (unshaded)
- Chance of flooding over 30 yrs
- 0.0%
- Est. flood insurance / yr
- $507 – $1,088
Fire risk 6/10 · Moderate
- Est. fire insurance / yr
- $2,463 – $4,575
Heat risk 6/10 · Moderate
- Hot days now (above 106°F)
- 7 days/yr
- Hot days in 30 yrs
- 20 days/yr
Wind risk 2/10 · Minimal
- Chance of severe wind over 30 yrs
- 2.0%
Air-quality risk 1/10 · Minimal
- Unhealthy air days now
- 0 days/yr
- Unhealthy air days in 30 yrs
- 0 days/yr
Risk factors via First Street. Map © Google.
Why this score? — see what drove the B- grade
The composite is a weighted blend of 9 inputs, each scored 0–100. Each bar is that input's sub-score; the figure is the points it added to the 100-point composite (weight × sub-score).
- Cash flow +26.9/30.0
- ARV discount +15.0/15.0
- DSCR +9.3/10.0
- 1% rule +7.2/10.0
- Livability +3.5/5.0
- Rent growth +2.5/5.0
- Schools +2.3/10.0
- Condition / age +1.0/5.0
- Appreciation +0.0/10.0
$67,000
🖨 Deal sheet 📄 Offer letter ✓ Due diligence
Listing remarks
Cute one-bedroom bungalow blocks away from SWOSU campus. Built in 1920, this bungalow offers charm. Covered front porch.
Key facts
- 4,500 sq ft lot
- Garage
- Built 1920
Property features AI
Finance
- HOA & community: No mandatory association dues
Exterior
- Parking: 1-car garage
- Utilities: Electricity available; Natural gas available; Public utilities
- Home design: Single family residence; One story; West-facing; Residential, existing property
- Construction: Frame construction; Composition roof (replaced/updated 2016); Post-tension foundation; Aluminum and wood frame windows
- Exterior features: Wood fencing; Interior lot
Interior
- Kitchen: Free‑standing range; Free‑standing oven; Gas oven; Refrigerator
- Bedrooms: 1 bedroom
- Flooring: Vinyl flooring; Wood flooring
- Bathrooms: 1 full bathroom
- Heating & cooling: Panel Ray heating; Window unit cooling
- Interior features: Covered porch; No fireplace
- Laundry & utility: Washer and dryer included
Neighborhood map
What this means for you Summary
Snapshot
- This is a 1-bed/1.0-bath single-family listed at $67k. Condition is rated poor.
Deal economics
- At list price, monthly cash flow is $185 ($2k/yr) — positive.
- The deal already cash-flows at list — no discount required.
- Meets the 1% rule at list price ($821 rent vs $67k).
- Recommended offer: $63k (6.0% below list) — sets the bar for market timing.
- Cap rate 9.6% vs local median 3.3% in Weatherford — top-decile yield for the area; either an underpriced asset or a hidden risk that comps aren't pricing in. Stress-test before assuming the spread holds.
Location & tenants
- Location reads 70/100 on livability (#44 in OK) — a middle-class / working-renter tenant base. Strengths: crime A+, cost of living A+, housing A+; Watch: employment C-, amenities F, commute F.
- Weatherford (town): math 28% / reading 26% proficiency, ranked #83 of 270 in OK (top 31%) — low school quality limits family demand, transient renter base, plan for 1-2y turnover.
- Zoned schools: Weatherford Hs (math 32% / reading 37%, grade F, #48 of 447 statewide, top 14%, 636 students, 0% FRL) — zoned schools average 0% FRL vs 40% district-wide (40 pts lower); this property's tenant base skews higher-income than the district average.
- Market conditions: 226 active listings in the ZIP; 28 units permitted in Custer County in 2024 (5 in 5+ unit buildings).
Forward outlook
- Local home prices are declining (-3.0%/yr); year-one equity from $463 of loan paydown is wiped out by about $2k of value loss. Plan a longer hold.
- Custer County population projected at +47% by 2050 — long-run rental-demand tailwind backs the buy-and-hold thesis.
- At projected returns (-3.0% appreciation + 3.0% rent growth), your $19k cash investment doubles in ~10 years — after that, you're playing with house money.
Negotiation context
- It's been on market 71 days — a 6% lower offer ($63k) is reasonable based on typical stale-listing flexibility.
Risks & watch-outs
- Watch-outs: built in 1920 — expect roof / HVAC / electrical / plumbing capex.
- Climate carrying-cost: major wildfire risk; extreme-heat days projected 7→20/yr by 2055 (HVAC capex compounding) — expect insurance premiums to compound above CPI over the hold.
Questions for the listing agent
- It's been on market 71 days. Have you received any prior offers? Is the seller open to a 6% concession, seller financing, or rate buy-down credit?
- Have any recent inspections been done? Can we get a copy of the seller's disclosures and any deferred-maintenance estimates?
- Built in 1920 — when were the roof, HVAC, electrical panel, plumbing, and water heater last replaced?
- Why hasn't it sold? Are there any deal-killer items the seller is aware of (foundation, flood, title, zoning, code violations)?
- Is there a deadline driving the sale (1031 exchange, divorce, estate, relocation)? That informs how much negotiation room exists.
- Schools are D-rated, which usually means shorter tenancies and higher turnover. Who's the typical renter profile here, and what's been the actual vacancy rate?
- What's the average days-on-market for RENTAL listings here right now (not sales)? A rising rental-DOM trend means longer vacancies and softer asking-rent achievability than the comps imply.
- What's the recent tenant-quality profile in this submarket — average credit score on applications, eviction rate, late-payment / NSF rate, and stable-employment percentage? A property-management company in the area should have these aggregated.
- How much new for-sale + rental construction is in the pipeline within 1–3 miles? Heavy new supply typically softens prices + rents 12–24 months out; constrained supply supports both.
Investment metrics
- 1% rule
- 1.22% ✓
- Cap rate
- 9.61%
- Cash-on-cash
- 11.85%
- DSCR
- 1.53
- GRM
- 6.8
CMA / ARV
- ARV (on-the-fly)
- $85,248
- Comps found
- 7
Show comp detail 7 sales within ~0.75 mi
| Address | Dist | Beds/Ba | Sqft | Sold | Price | $/sf | Match |
|---|---|---|---|---|---|---|---|
| 315 E Huber | 0.15mi | 2/1.0 (+1) | 780 (+2%) | 7mo | $40,000 | $51 | 80 |
| 306 E Franklin Ave | 0.20mi | 2/1.0 (+1) | 802 (+4%) | 18mo | $105,000 | $131 | 63 |
| 817 N Indiana St | 0.34mi | 2/1.0 (+1) | 748 (-3%) | 21mo | $89,000 | $119 | 57 |
| 614 W Franklin St | 0.54mi | 2/1.0 (+1) | 720 (-6%) | 6mo | $62,000 | $86 | 54 |
| 615 W Franklin St | 0.54mi | 2/1.0 (+1) | 728 (-5%) | 11mo | $90,000 | $124 | 52 |
| 215 N 7th St | 0.36mi | 2/1.0 (+1) | 880 (+15%) | 5mo | $97,500 | $111 | 50 |
| 120 N Caddo St | 0.24mi | 2/1.0 (+1) | 875 (+14%) | 24mo | $82,000 | $94 | 40 |
Match score weights: distance 35% · size 25% · config 20% · recency 20%. Top-matched comps best support the ARV.
Projected returns pro-forma
-3.0% appreciation · 3.0% rent growth · sell at horizon
- IRR
- 1.3%
- Equity multiple
- 1.05×
- Total profit
- $950
- Equity at exit
- $9,990
- IRR
- 11.0%
- Equity multiple
- 1.86×
- Total profit
- $16,064
- Equity at exit
- $5,793
Cash invested: $18,760 (down + closing). Projections, not guarantees.
Landlord ↔ Tenant lean methodology
- Overall (STATE)
- 83 Strongly Landlord-Friendly
- State Oklahoma
- 83 Strongly Landlord-Friendly · R+20
- County
- — inherits STATE
- City
- — inherits STATE
ZIP-level market 73096
- Home prices YoY
- -7.1%
- Active inventory
- 226
- Price-to-rent
- 6.8×
Monthly cashflow live
- Estimated rent
- $821 medium interval (Pro) →
- Mortgage (P&I)
- −$351
- Tax est. 1.5%
- −$84 /mo · $1,005/yr
- Insurance
- −$28
- HOA
- −$0
- Vacancy / Maint / Mgmt
- −$172
- Net cashflow
- $185
Break-even live
UW: 25.0% down · 7.5% · 30yr · 1.5% tax · 5.0% vac · 8.0% maint · 8.0% mgmt
Financing live
Cash to close
- Down payment
- $16,750
- Closing costs
- $2,010
- Reserves months
- —
- Total cash needed
- —
Loan-product check · same deal, 3 products live
Conventional
25% down · 7.5% · 30yr
- Down + closing
- —
- Monthly P&I
- —
- Monthly cashflow
- —
- DSCR
- —
- Eligible?
- —
Personal DTI + credit; lowest rate.
DSCR
20% down · 8.5% · 30yr
- Down + closing
- —
- Monthly P&I
- —
- Monthly cashflow
- —
- DSCR
- —
- Eligible?
- —
No personal income docs; deal must DSCR.
Hard money
10% down · 12.0% · 12mo
- Down + closing
- —
- Monthly P&I
- —
- Monthly cashflow
- —
- DSCR
- —
- Eligible?
- —
Short-term bridge; refi at stabilization.
Listing history 15 events
-
2026-06-18days on market $67,000 Active 71 DOM
-
2026-06-17days on market $67,000 Active 70 DOM
-
2026-06-16days on market $67,000 Active 69 DOM
-
2026-06-15days on market $67,000 Active 68 DOM
-
2026-06-13days on market $67,000 Active 66 DOM
-
2026-06-12days on market $67,000 Active 65 DOM
-
2026-06-09days on market $67,000 Active 62 DOM
-
2026-06-08days on market $67,000 Active 61 DOM
-
2026-06-08days on market $67,000 Active 60 DOM
-
2026-06-07days on market $67,000 Active 59 DOM
-
2026-06-04days on market $67,000 Active 56 DOM
-
2026-06-02days on market $67,000 Active 55 DOM
-
2026-06-01days on market $67,000 Active 54 DOM
-
2026-05-31days on market $67,000 Active 53 DOM
-
2026-04-07$67,000 Active
ⓘ Source: listings_history table (triggers on properties + properties_extension) + one-shot
backfill from property_details.listing_events for pre-trigger history.
Climate risk First Street
- Flood 1/10 Low FEMA zone X (unshaded) · 0% chance over 30 yrs
- Wildfire 6/10 Major
- Heat 6/10 Major 7 d/yr ≥106°F today · 20 d/yr by 30 yrs out
- Wind 2/10 Low 2% chance of damaging wind over 30 yrs
- Air quality 1/10 Low 0 unhealthy d/yr today · 0 by 30 yrs out
Nearby sold comps map
Loading sold comps map…
Walkable amenities ~0.75 mi
Loading nearby amenities…
Taxation est. · year 1
- Rental income
- $9,846
- − Mortgage interest
- −$3,753
- − Property taxes
- −$1,005
- − Insurance
- −$335
- − Repairs & maintenance
- −$788
- − Management
- −$788
- − Depreciation
- −$1,949
- Taxable income
- $1,229
- Est. tax owed @ 24.0%
- −$295
- After-tax cash flow
- $1,927/yr
For passive investors: Depreciation is non-cash, so a rental often shows a tax loss while cash-flowing — sheltering income. Rental losses are passive: they offset passive income freely, and up to $25,000/yr can offset ordinary (W-2) income if you actively participate and your MAGI is under $100k (phasing out to $0 by $150k); unused losses carry forward. On sale, claimed depreciation is recaptured at up to 25%, and gains may owe capital-gains tax (a 1031 exchange can defer both). Figures are a year-1 estimate at your 24.0% rate — not tax advice; consult a CPA.
Condition & rehab AI · 12 photos
This 1920 bungalow requires extensive repairs and updates to bring it up to modern standards. The extensive work will significantly increase its resale and rental value.
Repairs flagged
- Major kitchen cabinets — Severe wear and tear
- Major bathroom fixtures — Outdated and worn
- Major exterior siding — Worn and unkempt
- Major interior walls — Peeling paint and outdated decor
Value-add opportunities
- Resale New kitchen cabinets and countertops — Modern kitchen will attract more buyers
- Resale New bathroom fixtures and fixtures — Up-to-date bathroom will appeal to buyers
- Both New exterior siding and landscaping — Improved curb appeal will attract both buyers and renters
- Both Painting interior walls and adding fresh decor — Fresh look will attract buyers and renters
Renovation cost estimate screening
| Repair item | Severity | Est. cost |
|---|---|---|
| kitchen cabinets · Severe wear and tear | Major | $15,000–50,000 |
| bathroom fixtures · Outdated and worn | Major | $15,000–50,000 |
| exterior siding · Worn and unkempt | Major | $15,000–50,000 |
| interior walls · Peeling paint and outdated decor | Major | $15,000–50,000 |
| Total estimated repair cost · 4 items | $60,000–200,000 |
Value-add ROI direction
- Resale New kitchen cabinets and countertops — Modern kitchen will attract more buyers ↑
- Resale New bathroom fixtures and fixtures — Up-to-date bathroom will appeal to buyers ↑
- Both New exterior siding and landscaping — Improved curb appeal will attract both buyers and renters ↑
- Both Painting interior walls and adding fresh decor — Fresh look will attract buyers and renters ↑
ⓘ Cost ranges are severity-bucket heuristics (US national rule-of-thumb). Get contractor quotes + a written scope before underwriting a rehab budget.
Schools (NCES district)
- District
- Weatherford
- NCES district ID
- 4032070
- Math proficiency
- 28% ▼ -10.00%
- Reading proficiency
- 26% ▼ -15.00%
- Median HH income
- $45,799
- Composite
- 23.33/100
- National rank
- #7916
- State rank
- #83 of 270 in OK
Livability — Weatherford
- Score
- 70/100
- State rank
- #44
- US rank
- #7987
Category grades
Schools grade is shown separately in the Schools card above.
Census & demographics
- Census place
- Weatherford, OK
- Population (ZIP)
- 14,282
Population outlook (Custer County) Hauer SSP2
- Today (2025)
- 34,356 people
- By 2030
- 37,162 · +8.2%
- By 2040
- 43,354 · +26.2%
- By 2050
- 50,458 · +46.9%
- By 2075
- 71,075 · +106.9%
- By 2100
- 91,129 · +165.2%
Race, ethnicity, and origin ACS 2023
- Neighborhood character
- Predominantly White (72%)
- Race & ethnicity
- White 72% Two or more races 14% Hispanic / Latino 12% Native American 5% Black 2% Asian 2%
- Hispanic origin (detail)
- Mexican 11%
- Common ancestry
- Slovak 4% Italian 3% Serbian 2%
- Foreign-born
- 4% · Canada, China, Vietnam
- Languages at home
- 92% English-only · Spanish 7%
Political lean MEDSL · Custer
- 2024 margin
- Solid R (+53.2) · D 22.4% · R 75.7% · Other 1.9%
- 2008→2024 swing
- -3.9pp toward R · 2008: -49.3pp · 2024: -53.2pp
- All cycles
- 2024: R+53.2 2020: R+53.2 2016: R+54.3 2012: R+51.9 2008: R+49.3
Not yet ingested
- Civics
- —
Market trends
- HPI YoY
- ▼ -17.63%
- Current HPI
- 230.2732
- Rent YoY
- —
- Metro
- —
- State GDP YoY
- ▲ 1.55%
- F500 in state
- 6
Industry mix (Fortune 500 HQ in OK)
| Industry | F500 HQs | Revenue |
|---|---|---|
| Energy | 3 | $48B |
|
||
Price history
1 event — show timeline
- 2026-04-07 Listed $67,000 MLSOK
Cash-flow waterfall
monthlySold comps — $/sqft
last 12 mo · ≤1 miLoading sold comps…