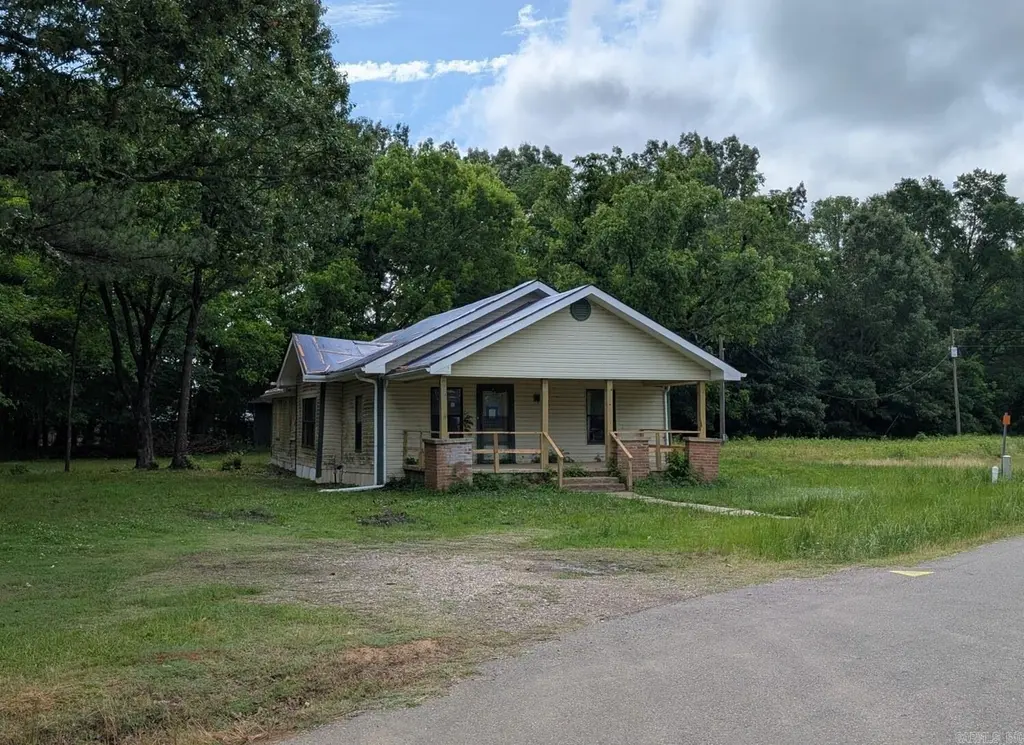
107 Silver St · Tollette, AR
Flood risk 1/10 · Minimal
- FEMA flood zone
- X (unshaded)
- Chance of flooding over 30 yrs
- 0.0%
- Est. flood insurance / yr
- $507 – $1,088
Fire risk 5/10 · Moderate
- Est. fire insurance / yr
- $1,499 – $2,785
Heat risk 6/10 · Moderate
- Hot days now (above 111°F)
- 7 days/yr
- Hot days in 30 yrs
- 20 days/yr
Wind risk 4/10 · Minor
- Chance of severe wind over 30 yrs
- 12.0%
Air-quality risk 2/10 · Minimal
- Unhealthy air days now
- 0 days/yr
- Unhealthy air days in 30 yrs
- 1 days/yr
Risk factors via First Street. Map © Google.
Why this score? — see what drove the D+ grade
The composite is a weighted blend of 9 inputs, each scored 0–100. Each bar is that input's sub-score; the figure is the points it added to the 100-point composite (weight × sub-score).
- Cash flow +15.0/30.0
- ARV discount +7.5/15.0
- Appreciation +5.6/10.0
- 1% rule +5.0/10.0
- DSCR +5.0/10.0
- Livability +2.9/5.0
- Rent growth +2.5/5.0
- Condition / age +2.5/5.0
- Schools +1.2/10.0
$26,500
🖨 Deal sheet 📄 Offer letter ✓ Due diligence
Listing remarks
Great investment opportunity on this roomy 3 bedroom with approx. 1456 square feet. Good size bedrooms, dining room and living area. Property sits on approx. .90 level acre. Very nice street appeal with large front porch. Please visit www. hubzu.com for additional information. All offers must be submitted through the HUBZU website. Agents please see showing and agent remarks for showing instructions.
Key facts
- 0.9 acre lot
- Built 1960
- Listed 18 days
Property features AI
Finance
- Other: Approximate lot size: 0.9 acre; Approximate living area: 1,456 (source: tax records)
Exterior
- Utilities: Public sewer; Public water; Municipal electric service (Entergy)
- Home design: Metal/vinyl siding exterior
- Construction: Crawl space foundation; Composition roof
- Exterior features: Level lot; Paved road access; Inside city limits
Interior
- Kitchen: Kitchen equipment listed as 'Other (See Remarks)'
- Flooring: Wood flooring; Vinyl flooring
- Bathrooms: 1 full bathroom
- Heating & cooling: Heating and cooling listed as 'Other (See Remarks)'
- Interior features: Wood and vinyl flooring; Formal living room; Kitchen equipment: See remarks
Neighborhood map
What this means for you Summary
Snapshot
- This is a 3-bed/1.0-bath single-family listed at $26k.
Deal economics
- At list price, monthly cash flow is $741 ($9k/yr) — positive.
- The deal already cash-flows at list — no discount required.
- Meets the 1% rule at list price ($1k rent vs $26k).
- Recommended offer: $26k (1.5% below list) — sets the bar for market timing.
Location & tenants
- Location reads 57/100 on livability (#346 in AR) — a working-class tenant base; expect higher turnover. Strengths: cost of living A+, housing A+; Watch: crime D, schools F, amenities F.
- Mineral Springs School District (rural): math 15% / reading 15% proficiency, ranked #222 of 238 in AR (top 93%) — low school quality limits family demand, transient renter base, plan for 1-2y turnover; 78% free/reduced lunch — lower-income household profile, screen leases tightly.
- Market conditions: 9 active listings in the ZIP; 1 units permitted in Howard County in 2024 (0 in 5+ unit buildings).
Forward outlook
- In year one you build about $479 of equity ($183 loan paydown + $296 appreciation (1.1% local appreciation)).
- Howard County population projected at -14% by 2050 — secular population decline; favor cash flow + early exit over multi-decade hold.
- At projected returns (1.1% appreciation + 3.0% rent growth), your $7k cash investment doubles in ~1 year — after that, you're playing with house money.
Negotiation context
- It's been on market 19 days — a 2% lower offer ($26k) is reasonable based on typical stale-listing flexibility.
Risks & watch-outs
- Climate carrying-cost: moderate wildfire risk; extreme-heat days projected 7→20/yr by 2055 (HVAC capex compounding) — expect insurance premiums to compound above CPI over the hold.
Questions for the listing agent
- Built in 1960 — when were the roof, HVAC, electrical panel, plumbing, and water heater last replaced?
- Is there a deadline driving the sale (1031 exchange, divorce, estate, relocation)? That informs how much negotiation room exists.
- Schools are F-rated, which usually means shorter tenancies and higher turnover. Who's the typical renter profile here, and what's been the actual vacancy rate?
- Crime grade is D in this area — have there been break-ins, vandalism, or insurance claims at this property in the last 3 years? What carrier currently insures it and at what premium?
- The area grade is low — what's the realistic commute time and amenity access for the typical tenant pool here? Any planned neighborhood developments (good or bad) we should know about?
- What's the average days-on-market for RENTAL listings here right now (not sales)? A rising rental-DOM trend means longer vacancies and softer asking-rent achievability than the comps imply.
- What's the recent tenant-quality profile in this submarket — average credit score on applications, eviction rate, late-payment / NSF rate, and stable-employment percentage? A property-management company in the area should have these aggregated.
- How much new for-sale + rental construction is in the pipeline within 1–3 miles? Heavy new supply typically softens prices + rents 12–24 months out; constrained supply supports both.
Investment metrics
- 1% rule
- 4.40% ✓
- Cap rate
- 39.85%
- Cash-on-cash
- 119.86%
- DSCR
- 6.33
- GRM
- 1.9
CMA / ARV
No comps found within radius.
Projected returns pro-forma
1.12% appreciation · 3.0% rent growth · sell at horizon
- IRR
- —
- Equity multiple
- 7.45×
- Total profit
- $47,867
- Equity at exit
- $9,211
- IRR
- —
- Equity multiple
- 15.51×
- Total profit
- $107,693
- Equity at exit
- $12,368
Cash invested: $7,420 (down + closing). Projections, not guarantees.
Landlord ↔ Tenant lean methodology
- Overall (STATE)
- 92 Strongly Landlord-Friendly
- State Arkansas
- 92 Strongly Landlord-Friendly · R+14
- County
- — inherits STATE
- City
- — inherits STATE
ZIP-level market 71851
- Home prices YoY
- 1.1%
- Active inventory
- 9
- Price-to-rent
- 1.9×
Monthly cashflow live
- Estimated rent
- $1,166 medium interval (Pro) →
- Mortgage (P&I)
- −$139
- Tax from tax record
- −$30 /mo · $361/yr
- Insurance
- −$11
- HOA
- −$0
- Vacancy / Maint / Mgmt
- −$245
- Net cashflow
- $741
Break-even live
UW: 25.0% down · 7.5% · 30yr · 1.5% tax · 5.0% vac · 8.0% maint · 8.0% mgmt
Financing live
Cash to close
- Down payment
- $6,625
- Closing costs
- $795
- Reserves months
- —
- Total cash needed
- —
Loan-product check · same deal, 3 products live
Conventional
25% down · 7.5% · 30yr
- Down + closing
- —
- Monthly P&I
- —
- Monthly cashflow
- —
- DSCR
- —
- Eligible?
- —
Personal DTI + credit; lowest rate.
DSCR
20% down · 8.5% · 30yr
- Down + closing
- —
- Monthly P&I
- —
- Monthly cashflow
- —
- DSCR
- —
- Eligible?
- —
No personal income docs; deal must DSCR.
Hard money
10% down · 12.0% · 12mo
- Down + closing
- —
- Monthly P&I
- —
- Monthly cashflow
- —
- DSCR
- —
- Eligible?
- —
Short-term bridge; refi at stabilization.
Listing history 9 events
-
2026-06-08days on market $26,500 Active 19 DOM
-
2026-06-07days on market $26,500 Active 18 DOM
-
2026-06-07days on market $26,500 Active 17 DOM
-
2026-06-04days on market $26,500 Active 14 DOM
-
2026-06-02days on market $26,500 Active 13 DOM
-
2026-06-01days on market $26,500 Active 12 DOM
-
2026-05-31days on market $26,500 Active 11 DOM
-
2026-05-31days on market $26,500 Active 10 DOM
-
2026-05-19$26,500 New Listing
ⓘ Source: listings_history table (triggers on properties + properties_extension) + one-shot
backfill from property_details.listing_events for pre-trigger history.
Tax reassessment forecast AR · Resets to sale price
- Current annual tax
- $361 · $30/mo
- Projected year-2 tax
- $361 · $30/mo
- Expected delta
- $0/yr ($0/mo · 0.0%)
ⓘ Screening estimate from a state-policy table — verify with the county assessor before closing.
Climate risk First Street
- Flood 1/10 Low FEMA zone X (unshaded) · 0% chance over 30 yrs
- Wildfire 5/10 Major
- Heat 6/10 Major 7 d/yr ≥111°F today · 20 d/yr by 30 yrs out
- Wind 4/10 Moderate 12% chance of damaging wind over 30 yrs
- Air quality 2/10 Low 0 unhealthy d/yr today · 1 by 30 yrs out
Nearby sold comps map
Loading sold comps map…
Walkable amenities ~0.75 mi
Loading nearby amenities…
Taxation est. · year 1
- Rental income
- $13,993
- − Mortgage interest
- −$1,484
- − Property taxes
- −$361
- − Insurance
- −$132
- − Repairs & maintenance
- −$1,119
- − Management
- −$1,119
- − Depreciation
- −$771
- Taxable income
- $9,005
- Est. tax owed @ 24.0%
- −$2,161
- After-tax cash flow
- $6,732/yr
For passive investors: Depreciation is non-cash, so a rental often shows a tax loss while cash-flowing — sheltering income. Rental losses are passive: they offset passive income freely, and up to $25,000/yr can offset ordinary (W-2) income if you actively participate and your MAGI is under $100k (phasing out to $0 by $150k); unused losses carry forward. On sale, claimed depreciation is recaptured at up to 25%, and gains may owe capital-gains tax (a 1031 exchange can defer both). Figures are a year-1 estimate at your 24.0% rate — not tax advice; consult a CPA.
Schools (NCES district)
- District
- Mineral Springs School District
- NCES district ID
- 0509780
- Math proficiency
- 15% ▼ -12.00%
- Reading proficiency
- 15% ▼ -7.00%
- Median HH income
- $35,351
- Composite
- 12.37/100
- National rank
- #9635
- State rank
- #222 of 238 in AR
Livability — Tollette
- Score
- 57/100
- State rank
- #346
- US rank
- #21803
Category grades
Schools grade is shown separately in the Schools card above.
Census & demographics
- Census place
- Tollette, AR
- Population (ZIP)
- 1,822
Population outlook (Howard County) Hauer SSP2
- Today (2025)
- 12,642 people
- By 2030
- 12,218 · -3.4%
- By 2040
- 11,470 · -9.3%
- By 2050
- 10,874 · -14.0%
- By 2075
- 10,517 · -16.8%
- By 2100
- 10,929 · -13.6%
Race, ethnicity, and origin ACS 2023
- Neighborhood character
- Diverse neighborhood (Simpson 0.63)
- Race & ethnicity
- Black 46% White 37% Hispanic / Latino 14% Two or more races 13%
- Hispanic origin (detail)
- Mexican 13%
- Common ancestry
- Iranian 1% Serbian 1% French 1%
- Foreign-born
- 11% · Canada, Jamaica
- Languages at home
- 84% English-only · Spanish 12% German/W. Germanic 4%
Political lean MEDSL · Howard
- 2024 margin
- Solid R (+46.7) · D 25.9% · R 72.6% · Other 1.5%
- 2008→2024 swing
- -21.7pp toward R · 2008: -25.0pp · 2024: -46.7pp
- All cycles
- 2024: R+46.7 2020: R+41.9 2016: R+39.0 2012: R+31.7 2008: R+25.0
Not yet ingested
- Civics
- —
Market trends
- HPI YoY
- ▲ 1.12%
- Current HPI
- 102.3152
- Rent YoY
- —
- Metro
- —
- State GDP YoY
- ▲ 3.80%
- F500 in state
- 10
Industry mix (Fortune 500 HQ in AR)
| Industry | F500 HQs | Revenue |
|---|---|---|
| Retail | 1 | $681B |
|
||
| Food / Agriculture | 1 | $53B |
|
||
| Retail / Energy | 1 | $22B |
|
||
| Transportation / Logistics | 1 | $12B |
|
||
| Energy | 1 | $4B |
|
||
Price history
1 event — show timeline
- 2026-05-19 Listed $26,500 CARMLS
Property tax history
+2.0%/yrLatest (2023): $361 · +0.0% YoY. Source: county tax records.
Cash-flow waterfall
monthlySold comps — $/sqft
last 12 mo · ≤1 miLoading sold comps…