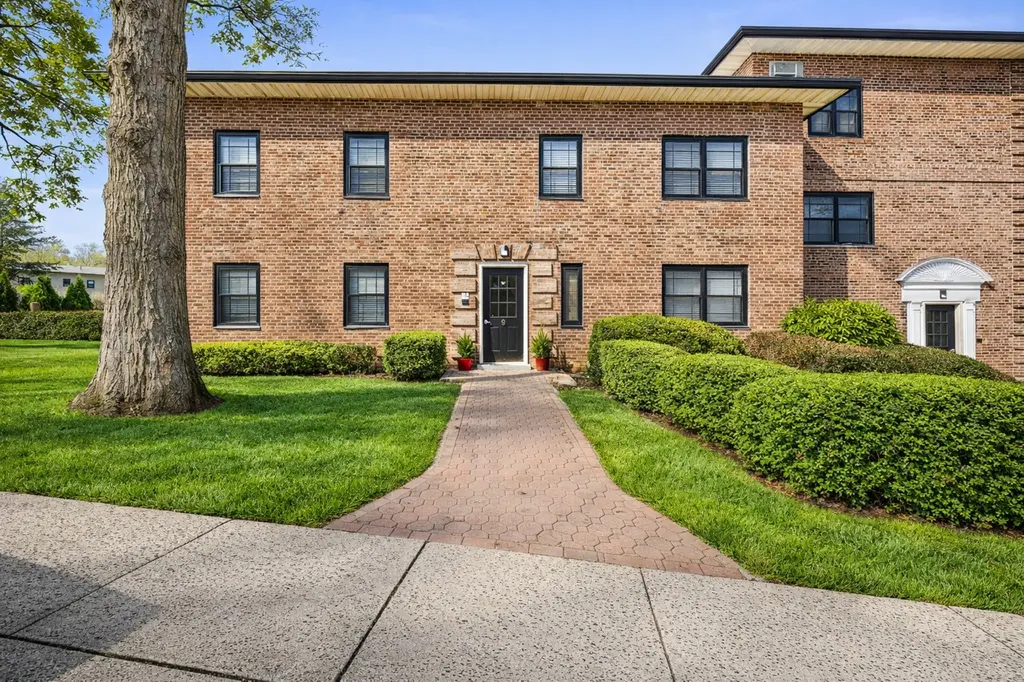
9 Manchester Rd Unit 2R · Eastchester, NY
Flood risk 1/10 · Minimal
- FEMA flood zone
- X (unshaded)
- Chance of flooding over 30 yrs
- 0.0%
- Est. flood insurance / yr
- $507 – $1,088
Fire risk 1/10 · Minimal
- Est. fire insurance / yr
- $691 – $1,283
Heat risk 6/10 · Moderate
- Hot days now (above 98°F)
- 7 days/yr
- Hot days in 30 yrs
- 15 days/yr
Wind risk 6/10 · Moderate
- Chance of severe wind over 30 yrs
- 27.0%
Air-quality risk 4/10 · Minor
- Unhealthy air days now
- 3 days/yr
- Unhealthy air days in 30 yrs
- 5 days/yr
Risk factors via First Street. Map © Google.
Why this score? — see what drove the D grade
The composite is a weighted blend of 9 inputs, each scored 0–100. Each bar is that input's sub-score; the figure is the points it added to the 100-point composite (weight × sub-score).
- Cash flow +12.0/30.0
- ARV discount +8.2/15.0
- Schools +7.2/10.0
- Condition / age +4.0/5.0
- Livability +3.9/5.0
- DSCR +3.5/10.0
- 1% rule +3.4/10.0
- Rent growth +2.5/5.0
- Appreciation +0.0/10.0
$320,000
🖨 Deal sheet 📄 Offer letter ✓ Due diligence
Listing remarks
Welcome to Interlaken Gardens! This beautifully gut-renovated one-bedroom, second-floor co-op is ideally situated on a quiet, tree-lined street within this highly desirable community. The home features tasteful, modern finishes throughout, offering a move-in-ready living experience in a prime location within the complex. Enjoy exclusive private beach and lake access, perfect for swimming, canoeing, kayaking, fishing, or simply unwinding by the water. Monthly maintenance includes all utilities, taxes, and basic cable, providing exceptional value and convenience (premium cable available at an additional cost). Commuters will appreciate the close proximity to bus and train options with an easy
Key facts
- Garage
- Built 1940
- Listed 35 days
Property features AI
Finance
- HOA & community: Community playground
Exterior
- Parking: One covered garage space; No carport; Parking availability listed as waitlist
- Utilities: Public sewer; Electricity connected; Natural gas connected; Sewer connected; Water connected
- Home design: Stock cooperative
- Construction: Construction materials listed as unknown
- Exterior features: No waterfront; Construction materials: unknown
Interior
- Kitchen: Refrigerator included
- Bedrooms: Bedrooms located on entry level
- Bathrooms: 1 full bathroom
- Heating & cooling: Hot water heating; Natural gas heating; Wall/window air conditioning units
- Interior features: Eat-in kitchen; No basement; Total of 3 rooms
Neighborhood map
What this means for you Summary
Snapshot
- This is a 1-bed/1.0-bath condo listed at $320k. Condition is rated good.
Deal economics
- At list price, monthly cash flow is $-79 ($-947/yr) — negative.
- To cash-flow at today's rent, offer at most $309k (3.6% below list).
- To meet the 1% rule (rent ≥ 1% of price), the offer needs to be $270k (15.6% below list).
- Recommended offer: $270k (15.6% below list) — sets the bar for 1% rule.
- Cap rate 6.0% vs local median 4.2% in Eastchester — top-decile yield for the area; either an underpriced asset or a hidden risk that comps aren't pricing in. Stress-test before assuming the spread holds.
Location & tenants
- Location reads 78/100 on livability (#159 in NY, #2,451 nationally) — a middle-class / working-renter tenant base. Strengths: crime A+, commute A+, employment A+; Watch: amenities D-, cost of living F, health & safety D-.
- Eastchester Union Free School District (suburban): math 79% / reading 80% proficiency, ranked #42 of 590 in NY (top 7%) — strong family-tenant draw, lease renewals of 3-5y typical; only 2% free/reduced lunch — higher-income household profile.
- Zoned schools: Anne Hutchinson School (math 77% / reading 77%, grade A, #244 of 2,108 statewide, top 13%, 432 students, 0% FRL); Eastchester Middle School (math 56% / reading 76%, grade A-, #118 of 729 statewide, top 16%, 694 students, 0% FRL); Eastchester Senior High School (math 100% / reading 84%, grade A+, #171 of 1,100 statewide, top 18%, 976 students, 0% FRL) — zoned schools at 0% FRL track the district average.
- Market conditions: 54 active listings in the ZIP; 12 comparable units currently listed for rent nearby; rentals at typical pace (median 22d on market — plan ~3-4 weeks tenant-placement turnaround); 42% of comp listings sitting > 30 days — soft ceiling on asking rent; 954 units permitted in Westchester County in 2024 (649 in 5+ unit buildings).
Forward outlook
- Local home prices are declining (-3.0%/yr); year-one equity from $2k of loan paydown is wiped out by about $10k of value loss. Plan a longer hold.
- Westchester County population projected at +10% by 2050 — modest demand growth; plan on rents tracking national, not racing it.
Negotiation context
- It's been on market 36 days — a 3% lower offer ($310k) is reasonable based on typical stale-listing flexibility.
Risks & watch-outs
- Watch-outs: built in 1940 — expect roof / HVAC / electrical / plumbing capex.
- Climate carrying-cost: major wind risk, 27% chance of damaging wind over 30y; extreme-heat days projected 7→15/yr by 2055 (HVAC capex compounding) — expect insurance premiums to compound above CPI over the hold.
Questions for the listing agent
- What do current leases actually rent for vs. the listed asking? Can we see a recent rent roll and the last 12 months of T-12 income?
- It's been on market 36 days. Have you received any prior offers? Is the seller open to a 16% concession, seller financing, or rate buy-down credit?
- Built in 1940 — when were the roof, HVAC, electrical panel, plumbing, and water heater last replaced?
- Any open or pending special assessments — roof, HVAC, plumbing, elevator, façade? What's the per-unit balance and payoff schedule, and is the seller paying it off at close or rolling it to the buyer?
- Is there a deadline driving the sale (1031 exchange, divorce, estate, relocation)? That informs how much negotiation room exists.
- Schools are A-rated — typically a magnet for longer-tenancy family renters. What's the average tenant stay here, and is there a school-zone premium baked into asking?
- The area grade is low — what's the realistic commute time and amenity access for the typical tenant pool here? Any planned neighborhood developments (good or bad) we should know about?
- What's the average days-on-market for RENTAL listings here right now (not sales)? A rising rental-DOM trend means longer vacancies and softer asking-rent achievability than the comps imply.
- What's the recent tenant-quality profile in this submarket — average credit score on applications, eviction rate, late-payment / NSF rate, and stable-employment percentage? A property-management company in the area should have these aggregated.
- How much new apartment / multifamily construction is in the pipeline within 1–3 miles? Heavy new supply (>2% of stock underway) typically softens rents 12–24 months out; light construction supports rent growth.
Investment metrics
- 1% rule
- 0.84% ✗
- Cap rate
- 6.00%
- Cash-on-cash
- -1.06%
- DSCR
- 0.95
- GRM
- 9.9
CMA / ARV
- ARV (median comp)
- $324,718
- List price
- $320,000
- Delta
- -1.45%
- Verdict
- FAIR
- Comps
- 20 within 1.0 mi
Projected returns pro-forma
-3.0% appreciation · 3.0% rent growth · sell at horizon
- IRR
- -18.0%
- Equity multiple
- 0.37×
- Total profit
- $-56,840
- Equity at exit
- $47,713
- IRR
- -10.2%
- Equity multiple
- 0.38×
- Total profit
- $-55,802
- Equity at exit
- $27,668
Cash invested: $89,600 (down + closing). Projections, not guarantees.
Landlord ↔ Tenant lean methodology
- Overall (STATE)
- 15 Strongly Tenant-Friendly
- State New York
- 15 Strongly Tenant-Friendly · D+10
- County
- — inherits STATE
- City
- — inherits STATE
ZIP-level market 10709
- Home prices YoY
- -21.7%
- Active inventory
- 54
- Price-to-rent
- 9.9×
Monthly cashflow live
- Estimated rent
- $2,699 high interval (Pro) →
- Mortgage (P&I)
- −$1,678
- Tax est. 1.5%
- −$400 /mo · $4,800/yr
- Insurance
- −$133
- HOA
- −$0
- Vacancy / Maint / Mgmt
- −$567
- Net cashflow
- $-79
Break-even live
UW: 25.0% down · 7.5% · 30yr · 1.5% tax · 5.0% vac · 8.0% maint · 8.0% mgmt
Financing live
Cash to close
- Down payment
- $80,000
- Closing costs
- $9,600
- Reserves months
- —
- Total cash needed
- —
Loan-product check · same deal, 3 products live
Conventional
25% down · 7.5% · 30yr
- Down + closing
- —
- Monthly P&I
- —
- Monthly cashflow
- —
- DSCR
- —
- Eligible?
- —
Personal DTI + credit; lowest rate.
DSCR
20% down · 8.5% · 30yr
- Down + closing
- —
- Monthly P&I
- —
- Monthly cashflow
- —
- DSCR
- —
- Eligible?
- —
No personal income docs; deal must DSCR.
Hard money
10% down · 12.0% · 12mo
- Down + closing
- —
- Monthly P&I
- —
- Monthly cashflow
- —
- DSCR
- —
- Eligible?
- —
Short-term bridge; refi at stabilization.
Rent comps 12 comps
| Address | Beds | Baths | Sqft | Rent | $/sqft | DOM | Units | Dist |
|---|---|---|---|---|---|---|---|---|
| Fisher Ave Eastchester, NY | 1.0 | 1.0 | 731 | $2,500 | $3.42 | 43d | 1 | 0.58mi |
| 2 Park Ave Unit 1B Eastchester, NY | 1.0 | 1.0 | 740 | $2,500 | $3.38 | 43d | 1 | 0.58mi |
| Glen Rd Unit H Eastchester, NY | 1.0 | 1.0 | 612 | $2,200 | $3.59 | 43d | 1 | 0.65mi |
| 212 Alpine Pl Tuckahoe, NY | 1.0 | 1.0 | 700 | $2,700 | $3.86 | 20d | 1 | 0.80mi |
| 300 Columbus Ave Tuckahoe, NY | — | 1.0 | 766 | $3,100 | $4.05 | 18d | 5 | 0.85mi |
| 1270 North Ave Unit 2L New Rochelle, NY | — | 1.0 | 650 | $2,400 | $3.69 | 15d | 1 | 0.92mi |
| 40 Jackson Ave Eastchester, NY | 1.0 | 1.0 | 725 | $2,950 | $4.07 | 14d | 1 | 0.96mi |
| 2 Consulate Dr Unit 1J Tuckahoe, NY | 1.0 | 1.0 | 750 | $2,700 | $3.60 | 12d | 1 | 1.04mi |
| 50 Columbus Ave Unit 817 Tuckahoe, NY | 1.0 | 1.0 | 750 | $3,000 | $4.00 | 22d | 1 | 1.16mi |
| 7 Dunwoodie St Unit 1S Scarsdale, NY | 1.0 | 1.0 | 542 | $2,500 | $4.61 | 43d | 1 | 1.35mi |
| 152 Summerfield St Unit 1 Left Scarsdale, NY | 2.0 | 1.0 | 668 | $2,850 | $4.27 | 43d | 1 | 1.40mi |
| 21 Scarsdale Rd Yonkers, NY | 2.0 | 1.0 | 835 | $3,795 | $4.54 | 1d | 21 | 1.40mi |
HOA detail condo
- Monthly dues
- $0 · $0/yr
- Likely covers
- watercable
- Assessments
- None detected in remarks — confirm with the listing agent.
Listing history 16 events
-
2026-06-18days on market $320,000 Active 36 DOM
-
2026-06-17days on market $320,000 Active 35 DOM
-
2026-06-16days on market $320,000 Active 34 DOM
-
2026-06-15days on market $320,000 Active 33 DOM
-
2026-06-13days on market $320,000 Active 31 DOM
-
2026-06-09days on market $320,000 Active 27 DOM
-
2026-06-08days on market $320,000 Active 26 DOM
-
2026-06-07days on market $320,000 Active 25 DOM
-
2026-06-04days on market $320,000 Active 22 DOM
-
2026-06-03days on market $320,000 Active 21 DOM
-
2026-06-02days on market $320,000 Active 20 DOM
-
2026-06-02price $320,000 Active 19 DOM
-
2026-06-01days on market $330,000 Active 19 DOM
-
2026-05-31days on market $330,000 Active 18 DOM
-
2026-05-14$330,000 Active 946-char remark
-
2026-05-08historical $330,000 946-char remark
ⓘ Source: listings_history table (triggers on properties + properties_extension) + one-shot
backfill from property_details.listing_events for pre-trigger history.
Climate risk First Street
- Flood 1/10 Low FEMA zone X (unshaded) · 0% chance over 30 yrs
- Wildfire 1/10 Low
- Heat 6/10 Major 7 d/yr ≥98°F today · 15 d/yr by 30 yrs out
- Wind 6/10 Major 27% chance of damaging wind over 30 yrs
- Air quality 4/10 Moderate 3 unhealthy d/yr today · 5 by 30 yrs out
Nearby sold comps map
Loading sold comps map…
Walkable amenities ~0.75 mi
Loading nearby amenities…
Taxation est. · year 1
- Rental income
- $32,393
- − Mortgage interest
- −$17,925
- − Property taxes
- −$4,800
- − Insurance
- −$1,600
- − Repairs & maintenance
- −$2,591
- − Management
- −$2,591
- − Depreciation
- −$9,309
- Taxable loss
- −$6,424
- Est. tax savings @ 24.0%
- +$1,542
- After-tax cash flow
- $595/yr
For passive investors: Depreciation is non-cash, so a rental often shows a tax loss while cash-flowing — sheltering income. Rental losses are passive: they offset passive income freely, and up to $25,000/yr can offset ordinary (W-2) income if you actively participate and your MAGI is under $100k (phasing out to $0 by $150k); unused losses carry forward. On sale, claimed depreciation is recaptured at up to 25%, and gains may owe capital-gains tax (a 1031 exchange can defer both). Figures are a year-1 estimate at your 24.0% rate — not tax advice; consult a CPA.
Condition & rehab AI · 13 photos
This gut-renovated one-bedroom condo is move-in ready with modern finishes and a prime location. Enhancements to landscaping and exterior painting would further boost its appeal.
Value-add opportunities
- Both Landscaping improvements — Enhanced curb appeal can attract more buyers and renters.
- Both Painting exterior walls — Fresh paint can improve the home's appearance and value.
Renovation cost estimate screening
Value-add ROI direction
- Both Landscaping improvements — Enhanced curb appeal can attract more buyers and renters. ↑
- Both Painting exterior walls — Fresh paint can improve the home's appearance and value. ↑
ⓘ Cost ranges are severity-bucket heuristics (US national rule-of-thumb). Get contractor quotes + a written scope before underwriting a rehab budget.
Schools (NCES district)
- District
- Eastchester Union Free School District
- NCES district ID
- 3610080
- Math proficiency
- 79% ▲ 1.00%
- Reading proficiency
- 80% ▲ 9.00%
- Median HH income
- $96,944
- Composite
- 71.74/100
- National rank
- #216
- State rank
- #42 of 590 in NY
Livability — Eastchester
- Score
- 78/100
- State rank
- #159
- US rank
- #2451
Category grades
Schools grade is shown separately in the Schools card above.
Census & demographics
- Census place
- Eastchester, NY
- City population
- 10,274
- Population (ZIP)
- 10,274
Population outlook (Westchester County) Hauer SSP2
- Today (2025)
- 1,028,035 people
- By 2030
- 1,051,636 · +2.3%
- By 2040
- 1,098,520 · +6.9%
- By 2050
- 1,136,044 · +10.5%
- By 2075
- 1,196,925 · +16.4%
- By 2100
- 1,175,147 · +14.3%
Race, ethnicity, and origin ACS 2023
- Neighborhood character
- Predominantly White (81%)
- Race & ethnicity
- White 81% Asian 9% Hispanic / Latino 8% Two or more races 7%
- Hispanic origin (detail)
- Puerto Rican 4% Dominican 1%
- Common ancestry
- Scotch-Irish 3% Russian 2% Slovak 2%
- Foreign-born
- 17% · Canada, China, Vietnam
- Languages at home
- 77% English-only · Other Indo-European 9% Spanish 4% Other Asian/Pacific 3%
Political lean MEDSL · Westchester
- 2024 margin
- Strong D (+26.3) · D 63.1% · R 36.9%
- 2008→2024 swing
- -1.3pp toward R · 2008: 27.6pp · 2024: 26.3pp
- All cycles
- 2024: D+26.3 2020: D+36.3 2016: D+32.8 2012: D+22.2 2008: D+27.6
Not yet ingested
- Civics
- —
Market trends
- HPI YoY
- ▼ -75.63%
- Current HPI
- 273.1667
- Rent YoY
- —
- Metro
- —
- State GDP YoY
- ▲ 2.60%
- F500 in state
- 92
Industry mix (Fortune 500 HQ in NY)
| Industry | F500 HQs | Revenue |
|---|---|---|
| Financial Services | 10 | $950B |
|
||
| Consumer Goods | 9 | $162B |
|
||
| Insurance | 4 | $225B |
|
||
| Telecommunications | 2 | $144B |
|
||
| Pharmaceuticals | 2 | $112B |
|
||
| Media / Entertainment | 2 | $69B |
|
||
Price history
-3.0% since first listed3 events — show timeline
- 2026-06-01 Price Changed $320,000 OneKey® MLS as Distributed by MLS Grid
- 2026-05-14 Listed $330,000 OneKey® MLS as Distributed by MLS Grid
- 2026-05-08 Coming Soon $330,000 OneKey® MLS as Distributed by MLS Grid
Cash-flow waterfall
monthlySold comps — $/sqft
last 12 mo · ≤1 miLoading sold comps…