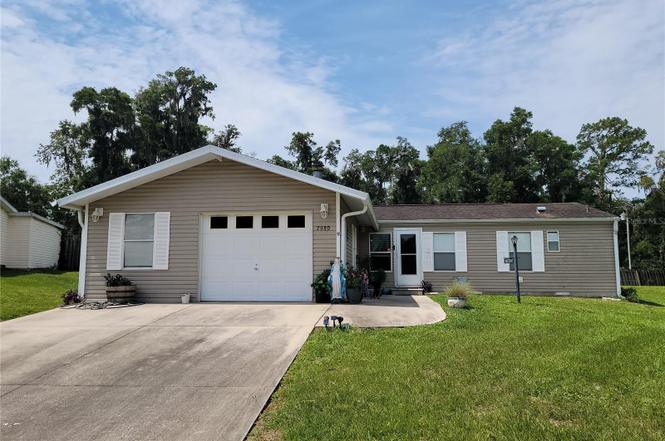
7980 SW 7th Pl · Ocala, FL
Flood risk 6/10 · Moderate
- FEMA flood zone
- X (unshaded)
- Chance of flooding over 30 yrs
- 0.71%
- Est. flood insurance / yr
- $507 – $1,088
Fire risk 5/10 · Moderate
- Est. fire insurance / yr
- $947 – $1,759
Heat risk 8/10 · Major
- Hot days now (above 107°F)
- 7 days/yr
- Hot days in 30 yrs
- 22 days/yr
Wind risk 9/10 · Severe
- Chance of severe wind over 30 yrs
- 99.0%
Air-quality risk 3/10 · Minor
- Unhealthy air days now
- 3 days/yr
- Unhealthy air days in 30 yrs
- 3 days/yr
Risk factors via First Street. Map © Google.
Why this score? — see what drove the B- grade
The composite is a weighted blend of 9 inputs, each scored 0–100. Each bar is that input's sub-score; the figure is the points it added to the 100-point composite (weight × sub-score).
- Cash flow +30.0/30.0
- 1% rule +10.0/10.0
- DSCR +10.0/10.0
- ARV discount +7.5/15.0
- Schools +3.6/10.0
- Livability +3.5/5.0
- Rent growth +2.5/5.0
- Condition / age +2.5/5.0
- Appreciation +0.0/10.0
$119,900
🖨 Deal sheet (PDF) 📄 Offer letter ✓ Due diligence
Listing remarks MLS
What a great community in Southwest Ocala! Near everything, but very peaceful. This home has a garage, which is unusual for Falls of Ocala. The 3rd bedroom was made into a den, but can easily be converted back to a bedroom by simply adding some french doors. The kitchen has it's own eating area that really has a lovely view! The living room is large and has a nice wood burning fireplace. Master bathroom is just gorgeous with it's black granite counters and very nice sized step in shower. But the screened lanai is wonderful! You see the horse farm across the street while enjoying the breeze on this lanai. Community has a clubhouse, activities and a grand pool. There is also an area where you can store your RV or camper. First come first served on the slots. A great home in a great community. Roof 2012, HVAC 2009 REALTORS please read the remarks for submitting an offer. As Is contract please. Cash and conventional offers only.
Key facts
- Versatile den
- Screened lanai
- New roof
Tags
Property features AI
Finance
- Other: Monthly HOA amount: $200 (total annual $2,400)
- Financial info: Lease restrictions apply
- HOA & community: HOA required with monthly fee ($200); HOA amenities include clubhouse, pool, shuffleboard court; Association approval required; Senior community; Pets allowed (cats and dogs, with number limit); Association fee includes maintenance of grounds, water and sewer
Exterior
- Parking: Attached oversized garage with garage door opener (approx. 20x22, 1 garage space)
- Utilities: Public water; Public sewer; Electricity connected; Cable connected; Phone available
- Home design: Manufactured double-wide home; One story; Northeast facing; Residential, planned unit development (PUD)
- Construction: Vinyl siding; Shingle roof; Pillar/Post/Pier foundation; Built as manufactured housing
- Exterior features: Rear screened porch; Sliding doors; Rain gutters; Cleared lot; Mature landscaping; Paved road access; Board and wire fencing
Interior
- Kitchen: Dishwasher; Range; Range hood; Refrigerator; Freezer; Eat-in kitchen
- Bedrooms: 3 bedrooms
- Flooring: Laminate flooring; Tile flooring
- Bathrooms: 2 full bathrooms
- Heating & cooling: Electric heating; Central air conditioning
- Interior features: Ceiling fans; Eat-in kitchen; Living room/dining room combo; Open floorplan; Split bedroom layout; Thermostat; Blinds and window treatments; Wood-burning fireplace
- Laundry & utility: Washer and dryer included; Laundry area in kitchen; Electric water heater
Neighborhood map
What this means for you Summary
Snapshot
- This is a 3-bed/2.0-bath manufactured listed at $120k.
Deal economics
- At list price, monthly cash flow is $708 ($9k/yr) — positive.
- The deal already cash-flows at list — no discount required.
- Meets the 1% rule at list price ($2k rent vs $120k).
- Cap rate 13.4% vs local median 4.2% in Ocala — top-decile yield for the area; either an underpriced asset or a hidden risk that comps aren't pricing in. Stress-test before assuming the spread holds.
Location & tenants
- Location reads 69/100 on livability (#476 in FL) — a middle-class / working-renter tenant base. Strengths: cost of living A+, housing A+, health & safety A+; Watch: crime F, amenities F, commute F.
- Marion (rural): math 42% / reading 43% proficiency, ranked #61 of 73 in FL (top 84%) — families likely to look elsewhere, expect single-tenant / working-renter base with shorter leases; 61% free/reduced lunch — lower-income household profile, screen leases tightly.
- Market conditions: Rents flat; 295 active listings in the ZIP; 3 comparable units currently listed for rent nearby; rentals at typical pace (median 22d on market — plan ~3-4 weeks tenant-placement turnaround); 7,071 units permitted in Marion County in 2024 (534 in 5+ unit buildings).
- This rent runs 40% of the median local income ($65k/yr) — at the standard rent-burdened threshold; future hikes will face affordability resistance.
Forward outlook
- Local home prices are declining (-3.0%/yr); year-one equity from $829 of loan paydown is wiped out by about $4k of value loss. Plan a longer hold.
- Marion County population projected at +13% by 2050 — modest demand growth; plan on rents tracking national, not racing it.
- At projected returns (-3.0% appreciation + 0.1% rent growth), your $34k cash investment doubles in ~6 years — after that, you're playing with house money.
Negotiation context
- Only 4 days on market — expect competitive offers; lowballing is unlikely to land.
- 9 sale attempts since 21y ago with the ask held roughly flat each time — persistent listings suggest the price (not the market) is what's stuck; bring a comps-based counter.
Risks & watch-outs
- Climate carrying-cost: major flood risk; severe wind risk, 99% chance of damaging wind over 30y; moderate wildfire risk; extreme-heat days projected 7→22/yr by 2055 (HVAC capex compounding) — expect insurance premiums to compound above CPI over the hold.
Questions for the listing agent
- What does the HOA fee cover, when was the last increase, and are there any pending special assessments or reserve-fund shortfalls?
- Is there a deadline driving the sale (1031 exchange, divorce, estate, relocation)? That informs how much negotiation room exists.
- Crime grade is F in this area — have there been break-ins, vandalism, or insurance claims at this property in the last 3 years? What carrier currently insures it and at what premium?
- What's the average days-on-market for RENTAL listings here right now (not sales)? A rising rental-DOM trend means longer vacancies and softer asking-rent achievability than the comps imply.
- What's the recent tenant-quality profile in this submarket — average credit score on applications, eviction rate, late-payment / NSF rate, and stable-employment percentage? A property-management company in the area should have these aggregated.
- How much new for-sale + rental construction is in the pipeline within 1–3 miles? Heavy new supply typically softens prices + rents 12–24 months out; constrained supply supports both.
Investment metrics
- 1% rule
- 1.81% ✓
- Cap rate
- 13.38%
- Cash-on-cash
- 25.32%
- DSCR
- 2.13
- GRM
- 4.6
CMA / ARV
No comps found within radius.
Projected returns pro-forma
-3.0% appreciation · 0.12% rent growth · sell at horizon
- IRR
- 15.2%
- Equity multiple
- 1.59×
- Total profit
- $19,708
- Equity at exit
- $17,877
- IRR
- 21.4%
- Equity multiple
- 2.55×
- Total profit
- $52,114
- Equity at exit
- $10,367
Cash invested: $33,572 (down + closing). Projections, not guarantees.
Landlord ↔ Tenant lean methodology
- Overall (STATE)
- 87 Strongly Landlord-Friendly
- State Florida
- 87 Strongly Landlord-Friendly · R+3
- County
- — inherits STATE
- City
- — inherits STATE
ZIP-level market 34474
- Home prices YoY
- -28.4%
- Rents YoY
- 0.1%
- Active inventory
- 295
- Price-to-rent
- 4.6×
Monthly cashflow live
- Estimated rent
- $2,175 medium interval (Pro) →
- Mortgage (P&I)
- −$629
- Tax from tax record
- −$131 /mo · $1,573/yr
- Insurance
- −$50
- HOA
- −$200
- Vacancy / Maint / Mgmt
- −$457
- Net cashflow
- $708
Break-even live
Sensitivity live
| Price | -10% $776 | -5% $742 | +0% $708 | +5% $674 | +10% $641 |
|---|---|---|---|---|---|
| Rent | -10% $537 | -5% $623 | +0% $708 | +5% $794 | +10% $880 |
| Rate | -1.0pp $769 | -0.5pp $739 | base $708 | +0.5pp $677 | +1.0pp $646 |
UW: 25.0% down · 7.5% · 30yr · 1.5% tax · 5.0% vac · 8.0% maint · 8.0% mgmt
Financing live
Cash to close
- Down payment
- $29,975
- Closing costs
- $3,597
- Reserves months
- —
- Total cash needed
- —
Loan-product check · same deal, 3 products live
Conventional
25% down · 7.5% · 30yr
- Down + closing
- —
- Monthly P&I
- —
- Monthly cashflow
- —
- DSCR
- —
- Eligible?
- —
Personal DTI + credit; lowest rate.
DSCR
20% down · 8.5% · 30yr
- Down + closing
- —
- Monthly P&I
- —
- Monthly cashflow
- —
- DSCR
- —
- Eligible?
- —
No personal income docs; deal must DSCR.
Hard money
10% down · 12.0% · 12mo
- Down + closing
- —
- Monthly P&I
- —
- Monthly cashflow
- —
- DSCR
- —
- Eligible?
- —
Short-term bridge; refi at stabilization.
Rent comps 3 comps
| Address | Beds | Baths | Sqft | Rent | $/sqft | DOM | Units | Dist |
|---|---|---|---|---|---|---|---|---|
| 7640 SW 14th St Ocala, FL | 3.0 | 2.0 | 1173 | $1,699 | $1.45 | 22d | 1 | 0.56mi |
| 238 NW 76th Ter Ocala, FL | 3.0 | 2.0 | 1000 | $1,750 | $1.75 | 22d | 1 | 0.68mi |
| 7710 NW 14th St Ocala, FL | 3.0 | 3.0 | 1521 | $4,500 | $2.96 | 22d | 1 | 1.39mi |
HOA detail
- Monthly dues
- $200 · $2,400/yr
- Likely covers
- pool
Listing history 6 events
-
2026-06-18status $119,900 Pending 4 DOM
-
2026-06-17days on market $119,900 Active 4 DOM
-
2026-06-16days on market $119,900 Active 3 DOM
-
2026-06-15days on market $119,900 Active 2 DOM
-
2026-06-14remarks 699-char remark
-
2026-06-14$119,900 Active 1 DOM
ⓘ Source: listings_history table (triggers on properties + properties_extension) + one-shot
backfill from property_details.listing_events for pre-trigger history.
Tax reassessment forecast FL · Resets to sale price
- Current annual tax
- $1,573 · $131/mo
- Projected year-2 tax
- $1,573 · $131/mo
- Expected delta
- $0/yr ($0/mo · 0.0%)
ⓘ Screening estimate from a state-policy table — verify with the county assessor before closing.
Climate risk First Street
- Flood 6/10 Major FEMA zone X (unshaded) · 71% chance over 30 yrs
- Wildfire 5/10 Major
- Heat 8/10 Severe 7 d/yr ≥107°F today · 22 d/yr by 30 yrs out
- Wind 9/10 Extreme 99% chance of damaging wind over 30 yrs
- Air quality 3/10 Moderate 3 unhealthy d/yr today · 3 by 30 yrs out
Nearby sold comps map
Loading sold comps map…
Walkable amenities ~0.75 mi
Loading nearby amenities…
Taxation est. · year 1
- Rental income
- $26,100
- − Mortgage interest
- −$6,716
- − Property taxes
- −$1,573
- − Insurance
- −$600
- − Repairs & maintenance
- −$2,088
- − Management
- −$2,088
- − HOA
- −$2,400
- − Depreciation
- −$3,488
- Taxable income
- $7,147
- Est. tax owed @ 24.0%
- −$1,715
- After-tax cash flow
- $6,786/yr
For passive investors: Depreciation is non-cash, so a rental often shows a tax loss while cash-flowing — sheltering income. Rental losses are passive: they offset passive income freely, and up to $25,000/yr can offset ordinary (W-2) income if you actively participate and your MAGI is under $100k (phasing out to $0 by $150k); unused losses carry forward. On sale, claimed depreciation is recaptured at up to 25%, and gains may owe capital-gains tax (a 1031 exchange can defer both). Figures are a year-1 estimate at your 24.0% rate — not tax advice; consult a CPA.
Schools (NCES district)
- District
- Marion
- NCES district ID
- 1201260
- Math proficiency
- 42% ▼ -7.00%
- Reading proficiency
- 43% ▼ -4.00%
- Median HH income
- $40,015
- Composite
- 35.61/100
- National rank
- #4890
- State rank
- #61 of 73 in FL
Livability — Ocala
- Score
- 69/100
- State rank
- #476
- US rank
- #8461
Category grades
Schools grade is shown separately in the Schools card above.
Census & demographics
- County
- Marion County · 315,796 people
- City population
- 263,375
- Metro
- Ocala, FL
- Population (ZIP)
- 20,258
- Household income
- $65,291
- Rent vs Own
- Severe rent burden
- 1062.0
Population outlook (Marion County) Hauer SSP2
- Today (2025)
- 365,905 people
- By 2030
- 376,768 · +3.0%
- By 2040
- 396,555 · +8.4%
- By 2050
- 412,723 · +12.8%
- By 2075
- 446,090 · +21.9%
- By 2100
- 436,193 · +19.2%
Race, ethnicity, and origin ACS 2023
- Neighborhood character
- Diverse neighborhood (Simpson 0.64)
- Race & ethnicity
- White 52% Hispanic / Latino 25% Black 13% Two or more races 8% Asian 8%
- Hispanic origin (detail)
- Mexican 2% Puerto Rican 10%
- Common ancestry
- Lithuanian 2% Romanian 2% Slovak 1%
- Foreign-born
- 21% · Canada, Jamaica, Vietnam
- Languages at home
- 71% English-only · Spanish 22% Other Indo-European 4% Vietnamese 1%
Political lean MEDSL · Marion
- 2024 margin
- Solid R (+31.6) · D 33.8% · R 65.5%
- 2008→2024 swing
- -20.0pp toward R · 2008: -11.6pp · 2024: -31.6pp
- All cycles
- 2024: R+31.6 2020: R+25.9 2016: R+26.2 2012: R+16.2 2008: R+11.6
Not yet ingested
- Civics
- —
Market trends
- HPI YoY
- ▼ -78.16%
- Current HPI
- 196.5607
- Rent YoY
- ▲ 0.12%
- Metro
- Ocala, FL
- State GDP YoY
- ▲ 3.28%
- F500 in state
- 36
Industry mix (Fortune 500 HQ in FL)
| Industry | F500 HQs | Revenue |
|---|---|---|
| Industrial Technology | 2 | $29B |
|
||
| Insurance | 2 | $17B |
|
||
| Retail | 1 | $60B |
|
||
| Technology Distribution | 1 | $58B |
|
||
| Homebuilding | 1 | $35B |
|
||
| Technology Manufacturing | 1 | $35B |
|
||
Price history
-80.0% since first listed22 events — show timeline
- 2026-06-13 Listed $119,900 Stellar MLS as Distributed by MLS Grid
- 2021-06-01 Sold (Public Records) $120,000 Public Records
- 2021-05-28 Sold (MLS) $120,000 Stellar MLS as Distributed by MLS Grid
- 2021-03-30 Pending — Stellar MLS as Distributed by MLS Grid
- 2021-03-30 Relisted — Stellar MLS as Distributed by MLS Grid
- 2021-03-27 Pending — Stellar MLS as Distributed by MLS Grid
- 2021-03-18 Relisted — Stellar MLS as Distributed by MLS Grid
- 2021-02-22 Pending — Stellar MLS as Distributed by MLS Grid
- 2021-01-27 Listed $120,000 Stellar MLS as Distributed by MLS Grid
- 2017-03-28 Sold (MLS) $78,000 Stellar MLS as Distributed by MLS Grid
- 2017-03-21 Sold (Public Records) $78,000 Public Records
- 2016-11-18 Listed $81,900 Stellar MLS as Distributed by MLS Grid
- 2016-07-29 Listing Removed — Stellar MLS as Distributed by MLS Grid
- 2016-04-28 Listed $79,900 Stellar MLS as Distributed by MLS Grid
- 2006-12-07 Listing Removed — Stellar MLS as Distributed by MLS Grid
- 2006-09-09 Listing Removed — Stellar MLS as Distributed by MLS Grid
- 2006-09-07 Listed $135,900 Stellar MLS as Distributed by MLS Grid
- 2006-09-06 Listing Removed — Stellar MLS as Distributed by MLS Grid
- 2006-03-07 Listed $119,900 Stellar MLS as Distributed by MLS Grid
- 2005-09-14 Sold (Public Records) $27,500 Public Records
- 2005-09-06 Listed $135,900 Stellar MLS as Distributed by MLS Grid
- 2003-12-17 Sold (Public Records) $600,100 Public Records
Property tax history
+5.7%/yrLatest (2025): $1,573 · +17.7% YoY. Source: county tax records.
Cash-flow waterfall
monthlySold comps — $/sqft
last 12 mo · ≤1 miLoading sold comps…