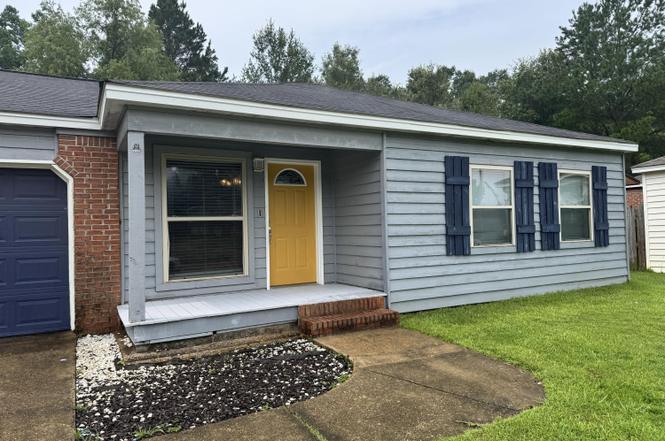
1916 S Twin Pine Dr · Pearl, MS
Flood risk 1/10 · Minimal
- FEMA flood zone
- X (unshaded)
- Chance of flooding over 30 yrs
- 0.0%
- Est. flood insurance / yr
- $507 – $1,088
Fire risk 1/10 · Minimal
- Est. fire insurance / yr
- $1,241 – $2,305
Heat risk 7/10 · Major
- Hot days now (above 108°F)
- 7 days/yr
- Hot days in 30 yrs
- 20 days/yr
Wind risk 8/10 · Major
- Chance of severe wind over 30 yrs
- 80.0%
Air-quality risk 2/10 · Minimal
- Unhealthy air days now
- 0 days/yr
- Unhealthy air days in 30 yrs
- 1 days/yr
Risk factors via First Street. Map © Google.
Why this score? — see what drove the D grade
The composite is a weighted blend of 9 inputs, each scored 0–100. Each bar is that input's sub-score; the figure is the points it added to the 100-point composite (weight × sub-score).
- Cash flow +15.6/30.0
- DSCR +4.8/10.0
- ARV discount +4.5/15.0
- Rent growth +4.1/5.0
- 1% rule +3.7/10.0
- Livability +3.7/5.0
- Schools +3.6/10.0
- Condition / age +2.5/5.0
- Appreciation +0.0/10.0
$205,000
🖨 Deal sheet (PDF) 📄 Offer letter ✓ Due diligence
Listing remarks MLS
Super cute 3 bedroom, 2 bath home with garage. Private yard that backs up to wooded area. HVAC is one year old. The seller has taken great care of this one and it is move in ready!!! Located minutes from interstate and all Pearl has to offer in shopping, dining, and more.
Key facts
- Private yard
- Wooded area
- Move in ready
Tags
Property features AI
Exterior
- Parking: Attached garage with 2 spaces
- Utilities: Public water; Public sewer; Electricity connected; Cable available; Sewer connected; Water connected
- Home design: Single-family house; One story; Move-in ready
- Construction: Vinyl and brick exterior; Asphalt roof; Slab foundation; Built in public-record year
- Exterior features: Front porch; Patio; Exterior lighting; Rain gutters
Interior
- Kitchen: Dishwasher; Disposal; Electric cooktop; Electric range
- Flooring: Carpet; Wood
- Bathrooms: 2 full bathrooms
- Heating & cooling: Central heating (electric); Central air conditioning (electric)
- Interior features: Ceiling fans; Crown molding; Double vanity; Eat-in kitchen; Pantry; Soaking tub; Storage; Vinyl windows; Fireplace in the living room
- Laundry & utility: Indoor laundry; Electric water heater
Neighborhood map
What this means for you Summary
Snapshot
- This is a 3-bed/1.0-bath single-family listed at $205k.
Deal economics
- At list price, monthly cash flow is $85 ($1k/yr) — positive.
- The deal already cash-flows at list — no discount required.
- To meet the 1% rule (rent ≥ 1% of price), the offer needs to be $178k (13.3% below list).
- Recommended offer: $178k (13.3% below list) — sets the bar for 1% rule.
- Cap rate 6.8% vs local median 5.5% in Pearl — meaningfully above typical; check what's discounted (condition, days-on-market, listing class) to confirm the premium yield is real.
Location & tenants
- Location reads 73/100 on livability (#19 in MS) — a middle-class / working-renter tenant base. Strengths: cost of living A+, housing A+, health & safety A+; Watch: amenities F, commute F, employment D-.
- Pearl Public School District (suburban): math 44% / reading 42% proficiency, ranked #32 of 130 in MS (top 25%) — families likely to look elsewhere, expect single-tenant / working-renter base with shorter leases.
- Zoned schools: Pearl Lower Elementary School (782 students, 100% FRL); Pearl Junior High School (math 46% / reading 40%, grade D-, #47 of 179 statewide, top 26%, 1,001 students, 100% FRL); Pearl High School (math 46% / reading 49%, grade D, #28 of 197 statewide, top 14%, 1,262 students, 100% FRL) — zoned schools average 100% FRL vs 57% district-wide (42 pts higher); higher-poverty schools than district average — tighter screening recommended.
- Market conditions: Rents rising fast (+6.3%/yr); 277 active listings in the ZIP; 2 comparable units currently listed for rent nearby; 343 units permitted in Rankin County in 2024 (0 in 5+ unit buildings).
- This rent runs 33% of the median local income ($65k/yr) — at the standard rent-burdened threshold; future hikes will face affordability resistance.
Forward outlook
- Local home prices are declining (-3.0%/yr); year-one equity from $1k of loan paydown is wiped out by about $6k of value loss. Plan a longer hold.
- Rankin County population projected at +17% by 2050 — long-run rental-demand tailwind backs the buy-and-hold thesis.
Negotiation context
- Only 2 days on market — expect competitive offers; lowballing is unlikely to land.
- 5 sale attempts since 13y ago with the ask held roughly flat each time — persistent listings suggest the price (not the market) is what's stuck; bring a comps-based counter.
Risks & watch-outs
- Climate carrying-cost: severe wind risk, 80% chance of damaging wind over 30y; extreme-heat days projected 7→20/yr by 2055 (HVAC capex compounding) — expect insurance premiums to compound above CPI over the hold.
Questions for the listing agent
- Is there a deadline driving the sale (1031 exchange, divorce, estate, relocation)? That informs how much negotiation room exists.
- Schools are D-rated, which usually means shorter tenancies and higher turnover. Who's the typical renter profile here, and what's been the actual vacancy rate?
- The area grade is low — what's the realistic commute time and amenity access for the typical tenant pool here? Any planned neighborhood developments (good or bad) we should know about?
- What's the average days-on-market for RENTAL listings here right now (not sales)? A rising rental-DOM trend means longer vacancies and softer asking-rent achievability than the comps imply.
- What's the recent tenant-quality profile in this submarket — average credit score on applications, eviction rate, late-payment / NSF rate, and stable-employment percentage? A property-management company in the area should have these aggregated.
- How much new for-sale + rental construction is in the pipeline within 1–3 miles? Heavy new supply typically softens prices + rents 12–24 months out; constrained supply supports both.
Investment metrics
- 1% rule
- 0.87% ✗
- Cap rate
- 6.79%
- Cash-on-cash
- 1.79%
- DSCR
- 1.08
- GRM
- 9.6
CMA / ARV
- ARV (on-the-fly)
- $192,038
- Comps found
- 12
Show comp detail 12 sales within ~0.75 mi
| Address | Dist | Beds/Ba | Sqft | Sold | Price | $/sf | Match |
|---|---|---|---|---|---|---|---|
| 201 Richard Cv | 0.04mi | 3/2.0 | 1,282 (+3%) | 6mo | $180,000 | $140 | 84 |
| 742 Grandmont St | 0.33mi | 3/2.0 | 1,264 (+1%) | 6mo | $160,000 | $127 | 73 |
| 1826 Twin Pine Dr | 0.14mi | 3/2.0 | 1,234 (-1%) | 19mo | $169,900 | $138 | 72 |
| 1939 Twin Pine Dr | 0.09mi | 3/2.0 | 1,137 (-9%) | 9mo | $175,000 | $154 | 69 |
| 1941 Twin Pine Dr | 0.09mi | 3/2.0 | 1,182 (-5%) | 22mo | $195,000 | $165 | 65 |
| 1966 Gloria Dr | 0.35mi | 3/1.0 | 1,122 (-10%) | 4mo | $147,500 | $131 | 63 |
| 733 Clearmont Dr | 0.18mi | 3/2.0 | 1,134 (-9%) | 11mo | $175,000 | $154 | 63 |
| 741 Sandy Ln | 0.28mi | 3/1.0 | 1,080 (-13%) | 6mo | $168,000 | $156 | 59 |
| 749 Sandy Ln | 0.30mi | 3/1.0 | 1,116 (-10%) | 14mo | $175,000 | $157 | 57 |
| 1906 Gloria Dr | 0.30mi | 3/1.5 | 1,119 (-10%) | 18mo | $179,900 | $161 | 52 |
| 770 Clearmont Dr | 0.35mi | 2/1.5 (-1) | 1,119 (-10%) | 22mo | $115,000 | $103 | 41 |
| 111 Magnolia Way | 0.69mi | 3/2.0 | 1,430 (+15%) | 20mo | $232,900 | $163 | 23 |
Match score weights: distance 35% · size 25% · config 20% · recency 20%. Top-matched comps best support the ARV.
Projected returns pro-forma
-3.0% appreciation · 6.34% rent growth · sell at horizon
- IRR
- -10.0%
- Equity multiple
- 0.62×
- Total profit
- $-21,632
- Equity at exit
- $30,566
- IRR
- 3.2%
- Equity multiple
- 1.26×
- Total profit
- $15,185
- Equity at exit
- $17,725
Cash invested: $57,400 (down + closing). Projections, not guarantees.
Landlord ↔ Tenant lean methodology
- Overall (STATE)
- 90 Strongly Landlord-Friendly
- State Mississippi
- 90 Strongly Landlord-Friendly · R+11
- County
- — inherits STATE
- City
- — inherits STATE
ZIP-level market 39208
- Home prices YoY
- -20.3%
- Rents YoY
- 6.3%
- Active inventory
- 277
- Price-to-rent
- 9.6×
Monthly cashflow live
- Estimated rent
- $1,778 medium interval (Pro) →
- Mortgage (P&I)
- −$1,075
- Tax from tax record
- −$159 /mo · $1,907/yr
- Insurance
- −$85
- HOA
- −$0
- Vacancy / Maint / Mgmt
- −$373
- Net cashflow
- $85
Break-even live
Sensitivity live
| Price | -10% $202 | -5% $143 | +0% $85 | +5% $27 | +10% $-31 |
|---|---|---|---|---|---|
| Rent | -10% $-55 | -5% $15 | +0% $85 | +5% $156 | +10% $226 |
| Rate | -1.0pp $189 | -0.5pp $138 | base $85 | +0.5pp $32 | +1.0pp $-22 |
UW: 25.0% down · 7.5% · 30yr · 1.5% tax · 5.0% vac · 8.0% maint · 8.0% mgmt
Financing live
Cash to close
- Down payment
- $51,250
- Closing costs
- $6,150
- Reserves months
- —
- Total cash needed
- —
Loan-product check · same deal, 3 products live
Conventional
25% down · 7.5% · 30yr
- Down + closing
- —
- Monthly P&I
- —
- Monthly cashflow
- —
- DSCR
- —
- Eligible?
- —
Personal DTI + credit; lowest rate.
DSCR
20% down · 8.5% · 30yr
- Down + closing
- —
- Monthly P&I
- —
- Monthly cashflow
- —
- DSCR
- —
- Eligible?
- —
No personal income docs; deal must DSCR.
Hard money
10% down · 12.0% · 12mo
- Down + closing
- —
- Monthly P&I
- —
- Monthly cashflow
- —
- DSCR
- —
- Eligible?
- —
Short-term bridge; refi at stabilization.
Rent comps 2 comps
| Address | Beds | Baths | Sqft | Rent | $/sqft | DOM | Units | Dist |
|---|---|---|---|---|---|---|---|---|
| 200 Colony Park Dr Pearl, MS | 1.0–3.0 | 1.0–2.0 | 1152 | $1,790 | $1.55 | 15d | 18 | 0.47mi |
| 2144 Napoleon Ave Pearl, MS | 3.0 | 2.0 | 1265 | $1,550 | $1.23 | 45d | 1 | 0.81mi |
Listing history 2 events
-
2026-06-22remarks 308-char remark
-
2026-06-22$205,000 Active 2 DOM
ⓘ Source: listings_history table (triggers on properties + properties_extension) + one-shot
backfill from property_details.listing_events for pre-trigger history.
Tax reassessment forecast MS · Resets to sale price
- Current annual tax
- $1,907 · $159/mo
- Projected year-2 tax
- $1,907 · $159/mo
- Expected delta
- $0/yr ($0/mo · -0.0%)
ⓘ Screening estimate from a state-policy table — verify with the county assessor before closing.
Climate risk First Street
- Flood 1/10 Low FEMA zone X (unshaded) · 0% chance over 30 yrs
- Wildfire 1/10 Low
- Heat 7/10 Severe 7 d/yr ≥108°F today · 20 d/yr by 30 yrs out
- Wind 8/10 Severe 80% chance of damaging wind over 30 yrs
- Air quality 2/10 Low 0 unhealthy d/yr today · 1 by 30 yrs out
Nearby sold comps map
Loading sold comps map…
Walkable amenities ~0.75 mi
Loading nearby amenities…
Taxation est. · year 1
- Rental income
- $21,340
- − Mortgage interest
- −$11,483
- − Property taxes
- −$1,907
- − Insurance
- −$1,025
- − Repairs & maintenance
- −$1,707
- − Management
- −$1,707
- − Depreciation
- −$5,964
- Taxable loss
- −$2,454
- Est. tax savings @ 24.0%
- +$589
- After-tax cash flow
- $1,614/yr
For passive investors: Depreciation is non-cash, so a rental often shows a tax loss while cash-flowing — sheltering income. Rental losses are passive: they offset passive income freely, and up to $25,000/yr can offset ordinary (W-2) income if you actively participate and your MAGI is under $100k (phasing out to $0 by $150k); unused losses carry forward. On sale, claimed depreciation is recaptured at up to 25%, and gains may owe capital-gains tax (a 1031 exchange can defer both). Figures are a year-1 estimate at your 24.0% rate — not tax advice; consult a CPA.
Schools (NCES district)
- District
- Pearl Public School District
- NCES district ID
- 2803520
- Math proficiency
- 44% ▼ -9.00%
- Reading proficiency
- 42% ▼ -9.00%
- Median HH income
- $42,525
- Composite
- 36.29/100
- National rank
- #4699
- State rank
- #32 of 130 in MS
Livability — Pearl
- Score
- 73/100
- State rank
- #19
- US rank
- #5662
Category grades
Schools grade is shown separately in the Schools card above.
Census & demographics
- Census place
- Pearl, MS
- County
- Rankin County · 123,614 people
- City population
- 34,442
- Metro
- Jackson, MS
- Population (ZIP)
- 34,442
- Household income
- $65,480
- Rent vs Own
- Severe rent burden
- 1235.0
Population outlook (Rankin County) Hauer SSP2
- Today (2025)
- 164,317 people
- By 2030
- 171,013 · +4.1%
- By 2040
- 182,723 · +11.2%
- By 2050
- 192,376 · +17.1%
- By 2075
- 209,535 · +27.5%
- By 2100
- 209,534 · +27.5%
Race, ethnicity, and origin ACS 2023
- Neighborhood character
- Majority White (60%)
- Race & ethnicity
- White 60% Black 31% Hispanic / Latino 5% Two or more races 3% Asian 2%
- Common ancestry
- Italian 5% Slovak 1% Serbian 1%
- Foreign-born
- 3% · Canada, China
- Languages at home
- 93% English-only · Spanish 4% Other Indo-European 1% Other Asian/Pacific 1%
Political lean MEDSL · Rankin
- 2024 margin
- Solid R (+47.1) · D 25.9% · R 73.0% · Other 1.0%
- 2008→2024 swing
- +6.4pp toward D · 2008: -53.5pp · 2024: -47.1pp
- All cycles
- 2024: R+47.1 2020: R+45.4 2016: R+52.9 2012: R+51.9 2008: R+53.5
Not yet ingested
- Civics
- —
Market trends
- HPI YoY
- ▼ -49.11%
- Current HPI
- 193.0609
- Rent YoY
- ▲ 6.34%
- Metro
- Jackson, MS
- State GDP YoY
- —
- F500 in state
- 0
Price history
+195.0% since first listed10 events — show timeline
- 2026-06-19 Listed $205,000 MLSU
- 2026-06-13 Listed for Rent $1,800 Avail
- 2024-02-23 Sold (MLS) — MLSU
- 2024-01-24 Pending — MLSU
- 2024-01-19 Listed $175,000 MLSU
- 2014-05-01 Sold (MLS) — MLSU
- 2014-01-21 Listed $104,000 MLSU
- 2013-12-23 Sold (MLS) — MLSU
- 2013-10-16 Listed $69,500 MLSU
- 2005-08-16 Sold (Public Records) — Public Records
Property tax history
+0.9%/yrLatest (2025): $1,907 · +83.8% YoY. Source: county tax records.
Cash-flow waterfall
monthlySold comps — $/sqft
last 12 mo · ≤1 miLoading sold comps…