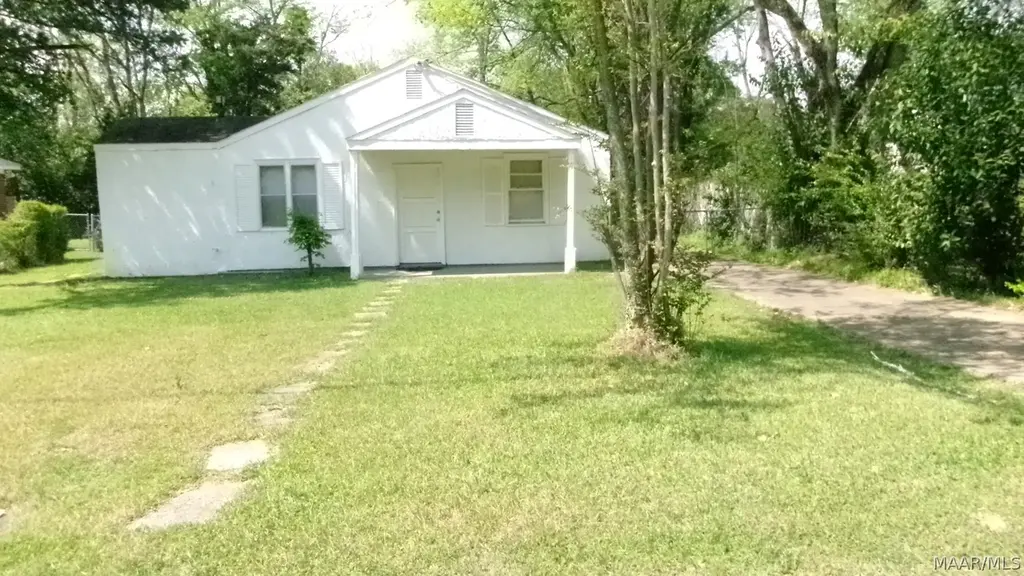
378 W Delano Ave · Montgomery, AL
Flood risk 1/10 · Minimal
- FEMA flood zone
- X (unshaded)
- Chance of flooding over 30 yrs
- 0.0%
- Est. flood insurance / yr
- $507 – $1,088
Fire risk 3/10 · Minor
- Est. fire insurance / yr
- $916 – $1,700
Heat risk 7/10 · Major
- Hot days now (above 108°F)
- 7 days/yr
- Hot days in 30 yrs
- 20 days/yr
Wind risk 8/10 · Major
- Chance of severe wind over 30 yrs
- 80.0%
Air-quality risk 2/10 · Minimal
- Unhealthy air days now
- 1 days/yr
- Unhealthy air days in 30 yrs
- 1 days/yr
Risk factors via First Street. Map © Google.
Why this score? — see what drove the C grade
The composite is a weighted blend of 9 inputs, each scored 0–100. Each bar is that input's sub-score; the figure is the points it added to the 100-point composite (weight × sub-score).
- Cash flow +30.0/30.0
- 1% rule +10.0/10.0
- DSCR +10.0/10.0
- Livability +3.2/5.0
- Rent growth +2.5/5.0
- Condition / age +2.5/5.0
- Schools +1.7/10.0
- ARV discount +0.0/15.0
- Appreciation +0.0/10.0
$57,900
🖨 Deal sheet (PDF) 📄 Offer letter ✓ Due diligence
Listing remarks MLS
Great Investment opportunity, for Buyers or Investors This 3 Bedroom 1 Bath Home offer new Carpet, Freshly Painted walls. ready for the New Buyer or Tenant whichever comes first, no time to wait. Call to reserve your spot. Nice patio on back to relax. Roof only several years old. Move in condition.
Key facts
- New carpet
- Nice patio
- 8,276 sq ft lot
Tags
Neighborhood map
What this means for you Summary
Snapshot
- This is a 3-bed/1.0-bath single-family listed at $58k.
Deal economics
- At list price, monthly cash flow is $553 ($7k/yr) — positive.
- The deal already cash-flows at list — no discount required.
- Meets the 1% rule at list price ($1k rent vs $58k).
- Recommended offer: $54k (6.0% below list) — sets the bar for market timing.
Location & tenants
- Location reads 65/100 on livability (#138 in AL) — a middle-class / working-renter tenant base. Strengths: cost of living A+, housing A+; Watch: employment D, crime F, amenities D-.
- Montgomery County (urban): math 9% / reading 31% proficiency, ranked #106 of 129 in AL (top 82%) — low school quality limits family demand, transient renter base, plan for 1-2y turnover; 70% free/reduced lunch — lower-income household profile, screen leases tightly.
- Zoned schools: Davis Elementary School (math 2% / reading 12%, grade F, #601 of 627 statewide, top 98%, 509 students, 97% FRL, charter); Bellingrath Middle School (math 0% / reading 12%, grade F, #252 of 257 statewide, top 98%, 607 students, 96% FRL, charter); Lanier Senior High School (math 2% / reading 12%, grade F, #265 of 305 statewide, top 89%, 798 students, 94% FRL) — zoned schools average 95% FRL vs 70% district-wide (25 pts higher); higher-poverty schools than district average — tighter screening recommended.
- Zoned-school proficiency averages 7% at this address vs 20% district-wide (-13 pts) — the specific schools serving this property underperform the Montgomery County average; the district grade overstates school quality for this exact location.
- Market conditions: 79 active listings in the ZIP; 19 comparable units currently listed for rent nearby; rentals at typical pace (median 23d on market — plan ~3-4 weeks tenant-placement turnaround); 47% of comp listings sitting > 30 days — soft ceiling on asking rent; lower-income renter base — watch delinquency; 460 units permitted in Montgomery County in 2024 (37 in 5+ unit buildings).
Forward outlook
- Local home prices are declining (-3.0%/yr); year-one equity from $400 of loan paydown is wiped out by about $2k of value loss. Plan a longer hold.
- Montgomery County population projected to shrink 8% by 2050 — rents likely to lag national; underwrite the cash flow, not the appreciation.
- At projected returns (-3.0% appreciation + 3.0% rent growth), your $16k cash investment doubles in ~3 years — after that, you're playing with house money.
Negotiation context
- It's been on market 86 days — a 6% lower offer ($54k) is reasonable based on typical stale-listing flexibility.
- 9 sale attempts since 23y ago with the ask held roughly flat each time — persistent listings suggest the price (not the market) is what's stuck; bring a comps-based counter.
- Current owner paid $5k; list at $58k implies a 1119% gain — meaningful room to come down on a strong offer.
Risks & watch-outs
- Watch-outs: built in 1950 — expect roof / HVAC / electrical / plumbing capex.
- Climate carrying-cost: severe wind risk, 80% chance of damaging wind over 30y; extreme-heat days projected 7→20/yr by 2055 (HVAC capex compounding) — expect insurance premiums to compound above CPI over the hold.
Questions for the listing agent
- It's been on market 86 days. Have you received any prior offers? Is the seller open to a 6% concession, seller financing, or rate buy-down credit?
- Built in 1950 — when were the roof, HVAC, electrical panel, plumbing, and water heater last replaced?
- Why hasn't it sold? Are there any deal-killer items the seller is aware of (foundation, flood, title, zoning, code violations)?
- Is there a deadline driving the sale (1031 exchange, divorce, estate, relocation)? That informs how much negotiation room exists.
- Crime grade is F in this area — have there been break-ins, vandalism, or insurance claims at this property in the last 3 years? What carrier currently insures it and at what premium?
- What's the average days-on-market for RENTAL listings here right now (not sales)? A rising rental-DOM trend means longer vacancies and softer asking-rent achievability than the comps imply.
- What's the recent tenant-quality profile in this submarket — average credit score on applications, eviction rate, late-payment / NSF rate, and stable-employment percentage? A property-management company in the area should have these aggregated.
- How much new for-sale + rental construction is in the pipeline within 1–3 miles? Heavy new supply typically softens prices + rents 12–24 months out; constrained supply supports both.
Investment metrics
- 1% rule
- 1.96% ✓
- Cap rate
- 17.75%
- Cash-on-cash
- 40.93%
- DSCR
- 2.82
- GRM
- 4.3
CMA / ARV
- ARV (median comp)
- $41,657
- List price
- $57,900
- Delta
- 38.99%
- Verdict
- OVERPRICED
- Comps
- 20 within 1.0 mi
Show comp detail 9 sales within ~0.75 mi
| Address | Dist | Beds/Ba | Sqft | Sold | Price | $/sf | Match |
|---|---|---|---|---|---|---|---|
| 3734 Gaston Ave | 0.29mi | 3/1.0 | 872 (-5%) | 8mo | $47,000 | $54 | 72 |
| 4053 Rosa L Parks Ave | 0.13mi | 3/1.0 | 1,053 (+15%) | 1mo | $83,000 | $79 | 69 |
| 501 Japonica St | 0.20mi | 3/1.0 | 1,053 (+15%) | 3mo | $62,500 | $59 | 63 |
| 3975 Edgar D Nixon Ave | 0.21mi | 3/1.0 | 1,013 (+10%) | 12mo | $42,000 | $41 | 63 |
| 713 W Patton Ave | 0.20mi | 4/1.0 (+1) | 1,044 (+14%) | 9mo | $65,000 | $62 | 55 |
| 4054 Ardmore Dr | 0.45mi | 3/1.0 | 1,014 (+10%) | 8mo | $80,000 | $79 | 55 |
| 223 Canna Dr | 0.34mi | 2/1.0 (-1) | 1,045 (+14%) | 2mo | $19,500 | $19 | 54 |
| 3804 Southmont Dr | 0.65mi | 3/1.0 | 1,025 (+12%) | 2mo | $40,000 | $39 | 49 |
| 4001 Ardmore Dr | 0.42mi | 3/1.0 | 1,025 (+12%) | 23mo | $56,000 | $55 | 41 |
Match score weights: distance 35% · size 25% · config 20% · recency 20%. Top-matched comps best support the ARV.
Projected returns pro-forma
-3.0% appreciation · 3.0% rent growth · sell at horizon
- IRR
- 37.4%
- Equity multiple
- 2.59×
- Total profit
- $25,822
- Equity at exit
- $8,633
- IRR
- 44.0%
- Equity multiple
- 5.18×
- Total profit
- $67,766
- Equity at exit
- $5,006
Cash invested: $16,212 (down + closing). Projections, not guarantees.
Landlord ↔ Tenant lean methodology
- Overall (STATE)
- 90 Strongly Landlord-Friendly
- State Alabama
- 90 Strongly Landlord-Friendly · R+15
- County
- — inherits STATE
- City
- — inherits STATE
ZIP-level market 36105
- Home prices YoY
- -32.6%
- Active inventory
- 79
- Price-to-rent
- 4.3×
Monthly cashflow live
- Estimated rent
- $1,134 high interval (Pro) →
- Mortgage (P&I)
- −$304
- Tax from tax record
- −$15 /mo · $182/yr
- Insurance
- −$24
- HOA
- −$0
- Vacancy / Maint / Mgmt
- −$238
- Net cashflow
- $553
Break-even live
Sensitivity live
| Price | -10% $586 | -5% $569 | +0% $553 | +5% $537 | +10% $520 |
|---|---|---|---|---|---|
| Rent | -10% $463 | -5% $508 | +0% $553 | +5% $598 | +10% $643 |
| Rate | -1.0pp $582 | -0.5pp $568 | base $553 | +0.5pp $538 | +1.0pp $523 |
UW: 25.0% down · 7.5% · 30yr · 1.5% tax · 5.0% vac · 8.0% maint · 8.0% mgmt
Financing live
Cash to close
- Down payment
- $14,475
- Closing costs
- $1,737
- Reserves months
- —
- Total cash needed
- —
Loan-product check · same deal, 3 products live
Conventional
25% down · 7.5% · 30yr
- Down + closing
- —
- Monthly P&I
- —
- Monthly cashflow
- —
- DSCR
- —
- Eligible?
- —
Personal DTI + credit; lowest rate.
DSCR
20% down · 8.5% · 30yr
- Down + closing
- —
- Monthly P&I
- —
- Monthly cashflow
- —
- DSCR
- —
- Eligible?
- —
No personal income docs; deal must DSCR.
Hard money
10% down · 12.0% · 12mo
- Down + closing
- —
- Monthly P&I
- —
- Monthly cashflow
- —
- DSCR
- —
- Eligible?
- —
Short-term bridge; refi at stabilization.
Rent comps 19 comps
| Address | Beds | Baths | Sqft | Rent | $/sqft | DOM | Units | Dist |
|---|---|---|---|---|---|---|---|---|
| 763 Belvedere Dr Montgomery, AL | 3.0 | 1.0 | 1044 | $1,000 | $0.96 | 45d | 1 | 0.28mi |
| 370 Collinwood Ave Montgomery, AL | 3.0 | 1.0 | 1080 | $1,000 | $0.93 | 22d | 1 | 0.39mi |
| 718 W Edgemont Ave Unit B Montgomery, AL | 2.0 | 1.0 | 875 | $800 | $0.91 | 22d | 1 | 0.70mi |
| 718 W Edgemont Ave Unit A Montgomery, AL | 3.0 | 1.0 | 875 | $875 | $1.00 | 45d | 1 | 0.70mi |
| 3394 Southmont Dr Unit 2 Montgomery, AL | 2.0 | 1.0 | 810 | $1,475 | $1.82 | 45d | 1 | 0.89mi |
| 3394 Southmont Dr Unit 3 Montgomery, AL | 2.0 | 1.0 | 810 | $1,050 | $1.30 | 45d | 1 | 0.89mi |
| 4724 S Court St Montgomery, AL | 2.0 | 1.0 | 800 | $485 | $0.61 | 15d | 1 | 1.04mi |
| 253 John Morris Ave Montgomery, AL | 3.0 | 1.0 | 912 | $950 | $1.04 | 22d | 1 | 1.09mi |
| 3751 Wesley Dr Apt A Montgomery, AL | 2.0 | 1.0 | 1034 | $550 | $0.53 | 45d | 1 | 1.15mi |
| 3737 Wesley Dr Montgomery, AL | 3.0 | 2.0 | 1050 | $1,280 | $1.22 | 45d | 1 | 1.16mi |
| 3735 Wesley Dr Montgomery, AL | 3.0 | 1.0 | 1000 | $1,200 | $1.20 | 22d | 1 | 1.17mi |
| 3733 Wesley Dr Montgomery, AL | 3.0 | 1.0 | 1000 | $1,200 | $1.20 | 22d | 1 | 1.17mi |
| 3709 Wesley Dr Montgomery, AL | 3.0 | 1.0 | 1000 | $1,200 | $1.20 | 22d | 1 | 1.17mi |
| 3723 Wesley Dr Montgomery, AL | 3.0 | 1.0 | 1000 | $1,200 | $1.20 | 22d | 1 | 1.17mi |
| 3701 Wesley Dr Unit 3723 Montgomery, AL | 3.0 | 1.0 | 1000 | $1,200 | $1.20 | 22d | 1 | 1.19mi |
| 3701 Wesley Dr Unit 3737 Montgomery, AL | 3.0 | 2.0 | 1050 | $1,280 | $1.22 | 45d | 1 | 1.19mi |
| 3701 Wesley Dr Unit 3733 Montgomery, AL | 3.0 | 1.0 | 1000 | $1,280 | $1.28 | 45d | 1 | 1.19mi |
| 105 Arlington Rd Unit B Montgomery, AL | 2.0 | 1.0 | 1100 | $925 | $0.84 | 45d | 1 | 1.20mi |
| 3445 Le Bron Rd Montgomery, AL | 4.0 | 1.0 | 1100 | $1,050 | $0.95 | 22d | 1 | 1.25mi |
Listing history 34 events
-
2026-06-21days on market $57,900 Active 86 DOM
-
2026-06-18days on market $57,900 Active 83 DOM
-
2026-06-17days on market $57,900 Active 82 DOM
-
2026-06-16days on market $57,900 Active 81 DOM
-
2026-06-15days on market $57,900 Active 80 DOM
-
2026-06-14days on market $57,900 Active 78 DOM
-
2026-06-13days on market $57,900 Active 77 DOM
-
2026-06-10days on market $57,900 Active 75 DOM
-
2026-06-09days on market $57,900 Active 74 DOM
-
2026-06-08days on market $57,900 Active 73 DOM
-
2026-06-07days on market $57,900 Active 72 DOM
-
2026-06-03days on market $57,900 Active 68 DOM
-
2026-06-02days on market $57,900 Active 67 DOM
-
2026-06-01days on market $57,900 Active 66 DOM
-
2026-05-31days on market $57,900 Active 65 DOM
-
2026-05-30days on market $57,900 Active 64 DOM
-
2026-05-06status Active 391-char remark
Show marketing remark (391 chars)
Great Investment opportunity, for Buyers or Investors This 3 Bedroom 1 Bath Home offer new Carpet, Freshly Painted walls. ready for the New Buyer or Tenant whichever comes first, no time to wait. Call to reserve your spot. Nice patio on back to relax. Roof only several years old. Move in‌‌‌‌‌‌‌‌‌‌‌‌ condition.
-
2026-04-28historical Contingent 391-char remark
Show marketing remark (391 chars)
Great Investment opportunity, for Buyers or Investors This 3 Bedroom 1 Bath Home offer new Carpet, Freshly Painted walls. ready for the New Buyer or Tenant whichever comes first, no time to wait. Call to reserve your spot. Nice patio on back to relax. Roof only several years old. Move in‌‌‌‌‌‌‌‌‌‌‌‌ condition.
-
2026-03-27$57,900 Active 391-char remark
Show marketing remark (391 chars)
Great Investment opportunity, for Buyers or Investors This 3 Bedroom 1 Bath Home offer new Carpet, Freshly Painted walls. ready for the New Buyer or Tenant whichever comes first, no time to wait. Call to reserve your spot. Nice patio on back to relax. Roof only several years old. Move in‌‌‌‌‌‌‌‌‌‌‌‌ condition.
-
2025-12-20price $61,900
-
2025-10-18$62,900 Active
-
2025-06-08price $61,900
-
2025-04-11$62,900 Active
-
2025-03-01price $60,900
-
2025-01-16price $61,900
-
2024-11-15status Active
-
2024-10-23status Pending
-
2024-08-17$62,900 Active
-
2024-06-22status Active
-
2024-05-20status Pending
-
2024-04-11historical Contingent
-
2024-03-09$62,900 Active
-
2003-08-14soldstatus $4,750
-
2003-04-30$5,800
ⓘ Source: listings_history table (triggers on properties + properties_extension) + one-shot
backfill from property_details.listing_events for pre-trigger history.
Tax reassessment forecast AL · Resets to sale price
- Current annual tax
- $182 · $15/mo
- Projected year-2 tax
- $237 · $20/mo
- Expected delta
- +$55/yr (+$5/mo · 30.2%)
ⓘ Screening estimate from a state-policy table — verify with the county assessor before closing.
Climate risk First Street
- Flood 1/10 Low FEMA zone X (unshaded) · 0% chance over 30 yrs
- Wildfire 3/10 Moderate
- Heat 7/10 Severe 7 d/yr ≥108°F today · 20 d/yr by 30 yrs out
- Wind 8/10 Severe 80% chance of damaging wind over 30 yrs
- Air quality 2/10 Low 1 unhealthy d/yr today · 1 by 30 yrs out
Nearby sold comps map
Loading sold comps map…
Walkable amenities ~0.75 mi
Loading nearby amenities…
Taxation est. · year 1
- Rental income
- $13,610
- − Mortgage interest
- −$3,243
- − Property taxes
- −$182
- − Insurance
- −$290
- − Repairs & maintenance
- −$1,089
- − Management
- −$1,089
- − Depreciation
- −$1,684
- Taxable income
- $6,033
- Est. tax owed @ 24.0%
- −$1,448
- After-tax cash flow
- $5,188/yr
For passive investors: Depreciation is non-cash, so a rental often shows a tax loss while cash-flowing — sheltering income. Rental losses are passive: they offset passive income freely, and up to $25,000/yr can offset ordinary (W-2) income if you actively participate and your MAGI is under $100k (phasing out to $0 by $150k); unused losses carry forward. On sale, claimed depreciation is recaptured at up to 25%, and gains may owe capital-gains tax (a 1031 exchange can defer both). Figures are a year-1 estimate at your 24.0% rate — not tax advice; consult a CPA.
Schools (NCES district)
- District
- Montgomery County
- NCES district ID
- 0102430
- Math proficiency
- 9% ▼ -21.00%
- Reading proficiency
- 31% ▼ -1.00%
- Median HH income
- $43,902
- Composite
- 17.24/100
- National rank
- #9093
- State rank
- #106 of 129 in AL
Livability — Montgomery
- Score
- 65/100
- State rank
- #138
- US rank
- #13416
Category grades
Schools grade is shown separately in the Schools card above.
Census & demographics
- Census place
- Montgomery, AL
- County
- Montgomery County · 190,016 people
- City population
- 175,913
- Metro
- Montgomery, AL
- Population (ZIP)
- 9,207
- Household income
- $41,486
- Rent vs Own
- Severe rent burden
- 679.0
Population outlook (Montgomery County) Hauer SSP2
- Today (2025)
- 224,008 people
- By 2030
- 221,460 · -1.1%
- By 2040
- 214,179 · -4.4%
- By 2050
- 204,912 · -8.5%
- By 2075
- 177,821 · -20.6%
- By 2100
- 145,134 · -35.2%
Race, ethnicity, and origin ACS 2023
- Neighborhood character
- Predominantly Black (83%)
- Race & ethnicity
- Black 83% White 12% Hispanic / Latino 4% Two or more races 3%
- Common ancestry
- Italian 1%
- Foreign-born
- 3% · Canada, South Korea
- Languages at home
- 95% English-only · Spanish 4%
Political lean MEDSL · Montgomery
- 2024 margin
- Solid D (+30.7) · D 64.8% · R 34.1% · Other 1.1%
- 2008→2024 swing
- +11.5pp toward D · 2008: 19.2pp · 2024: 30.7pp
- All cycles
- 2024: D+30.7 2020: D+31.5 2016: D+26.2 2012: D+24.3 2008: D+19.2
Not yet ingested
- Civics
- —
Market trends
- HPI YoY
- ▼ -31.17%
- Current HPI
- 64.4673
- Rent YoY
- —
- Metro
- Montgomery, AL
- State GDP YoY
- ▲ 2.94%
- F500 in state
- 4
Industry mix (Fortune 500 HQ in AL)
| Industry | F500 HQs | Revenue |
|---|---|---|
| Financial Services | 1 | $8B |
|
||
| Healthcare | 1 | $5B |
|
||
Price history
+898.3% since first listed18 events — show timeline
- 2026-05-06 Relisted — MAAR
- 2026-04-28 Contingent — MAAR
- 2026-03-27 Listed $57,900 MAAR
- 2025-12-20 Price Changed $61,900 MAAR
- 2025-10-18 Listed $62,900 MAAR
- 2025-06-08 Price Changed $61,900 MAAR
- 2025-04-11 Listed $62,900 MAAR
- 2025-03-01 Price Changed $60,900 MAAR
- 2025-01-16 Price Changed $61,900 MAAR
- 2024-11-15 Relisted — MAAR
- 2024-10-23 Pending — MAAR
- 2024-08-17 Listed $62,900 MAAR
- 2024-06-22 Relisted — MAAR
- 2024-05-20 Pending — MAAR
- 2024-04-11 Contingent — MAAR
- 2024-03-09 Listed $62,900 MAAR
- 2003-08-14 Sold (MLS) $4,750 MAAR
- 2003-04-30 Listed $5,800 MAAR
Property tax history
+0.6%/yrLatest (2025): $182 · +6.8% YoY. Source: county tax records.
Cash-flow waterfall
monthlySold comps — $/sqft
last 12 mo · ≤1 miLoading sold comps…