 Multi-family
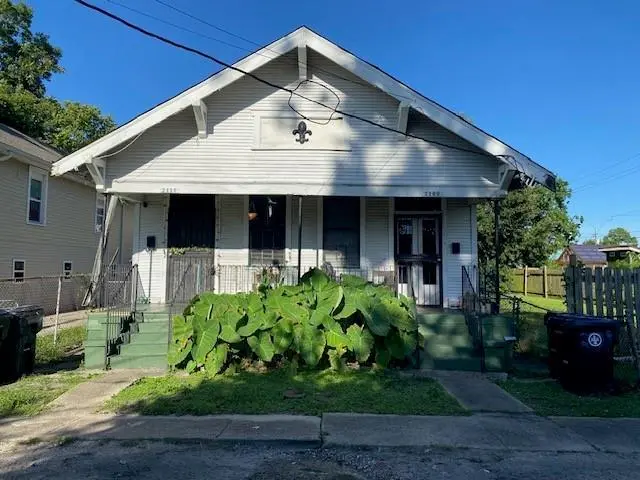
2109 11 Mandeville St · New Orleans, LA
Flood risk 8/10 · Major
- FEMA flood zone
- X (shaded)
- Chance of flooding over 30 yrs
- 0.6%
- Est. flood insurance / yr
- $507 – $1,088
Fire risk 1/10 · Minimal
- Est. fire insurance / yr
- $1,269 – $2,357
Heat risk 10/10 · Severe
- Hot days now (above 108°F)
- 7 days/yr
- Hot days in 30 yrs
- 22 days/yr
Wind risk 10/10 · Severe
- Chance of severe wind over 30 yrs
- 99.0%
Air-quality risk 4/10 · Minor
- Unhealthy air days now
- 4 days/yr
- Unhealthy air days in 30 yrs
- 4 days/yr
Risk factors via First Street. Map © Google.
Why this score? — see what drove the B- grade
The composite is a weighted blend of 9 inputs, each scored 0–100. Each bar is that input's sub-score; the figure is the points it added to the 100-point composite (weight × sub-score).
- Cash flow +30.0/30.0
- DSCR +10.0/10.0
- 1% rule +9.7/10.0
- ARV discount +8.0/15.0
- Livability +4.0/5.0
- Rent growth +3.1/5.0
- Condition / age +2.5/5.0
- Schools +1.6/10.0
- Appreciation +0.0/10.0
$195,000
🖨 Deal sheet 📄 Offer letter ✓ Due diligence
Multi-family units
County records classify this as Multi-Family (2-4 Unit). Listing-text estimate: 1 unit. estimate disagrees with records
Listing remarks MLS
Discover the authentic charm of New Orleans living in this classic shotgun double located at 2109-2111 Mandeville St. This income-producing property (or ideal owner-occupant unit with rental income) features two 2-bed, 1-bath units on each side, each boasting that unmistakable New Orleans character. The traditional, flowing shotgun layout is complemented by high ceilings and an abundance of natural light. Each kitchen provides plenty of cabinet space for all your cooking needs. A major highlight is the expansive backyard, a rare and coveted feature in the city, great for gardening, entertaining, or simply enjoying the beautiful New Orleans weather. Whether you're looking for a solid investment or a place to call home with a built-in mortgage helper, this historic double is brimming with potential. Don't miss this opportunity to own a piece of The Big Easy's architectural heritage!
Key facts
- Expansive backyard
- High ceilings
- 3,841 sq ft lot
Tags
Neighborhood map
What this means for you Summary
Snapshot
- This is a 4-bed/2.0-bath multifamily listed at $195k.
Deal economics
- At list price, monthly cash flow is $931 ($11k/yr) — positive.
- The deal already cash-flows at list — no discount required.
- Meets the 1% rule at list price ($3k rent vs $195k).
- Recommended offer: $172k (12.0% below list) — sets the bar for market timing.
- Cap rate 12.4% vs local median 4.4% in New Orleans — top-decile yield for the area; either an underpriced asset or a hidden risk that comps aren't pricing in. Stress-test before assuming the spread holds.
Location & tenants
- Location reads 81/100 on livability (#3 in LA, #1,383 nationally) — a professional / high-income tenant draw. Strengths: amenities A+, commute A+, health & safety A+; Watch: crime C-, employment D.
- Orleans Parish (urban): math 11% / reading 27% proficiency, ranked #69 of 98 in LA (top 70%) — low school quality limits family demand, transient renter base, plan for 1-2y turnover; 68% free/reduced lunch — lower-income household profile, screen leases tightly.
- Market conditions: Rents rising (+2.5%/yr); 581 active listings in the ZIP; 40 comparable units currently listed for rent nearby; rentals at typical pace (median 24d on market — plan ~3-4 weeks tenant-placement turnaround); 710 units permitted in Orleans Parish in 2024 (244 in 5+ unit buildings).
- At $2,863/mo this rent would consume 75% of the median local household income ($46k/yr) (locally 1988% of renters already pay >50% of income on rent) — very limited rent-growth headroom before tenants either downsize or default.
Forward outlook
- Local home prices are declining (-3.0%/yr); year-one equity from $1k of loan paydown is wiped out by about $6k of value loss. Plan a longer hold.
- Orleans County population projected at +61% by 2050 — long-run rental-demand tailwind backs the buy-and-hold thesis.
- At projected returns (-3.0% appreciation + 2.5% rent growth), your $55k cash investment doubles in ~7 years — after that, you're playing with house money.
Negotiation context
- It's been on market 256 days — a 12% lower offer ($172k) is reasonable based on typical stale-listing flexibility.
- 4 sale attempts since 3y ago with the ask held roughly flat each time — persistent listings suggest the price (not the market) is what's stuck; bring a comps-based counter.
Risks & watch-outs
- Watch-outs: flood insurance adds $66/mo; built in 1930 — expect roof / HVAC / electrical / plumbing capex.
- Climate carrying-cost: severe flood risk; severe wind risk, 99% chance of damaging wind over 30y; extreme-heat days projected 7→22/yr by 2055 (HVAC capex compounding) — expect insurance premiums to compound above CPI over the hold.
Questions for the listing agent
- It's been on market 256 days. Have you received any prior offers? Is the seller open to a 12% concession, seller financing, or rate buy-down credit?
- Built in 1930 — when were the roof, HVAC, electrical panel, plumbing, and water heater last replaced?
- What's the actual annual flood-insurance premium (NFIP or private), and is the property in a SFHA with mandatory coverage?
- Why hasn't it sold? Are there any deal-killer items the seller is aware of (foundation, flood, title, zoning, code violations)?
- Is there a deadline driving the sale (1031 exchange, divorce, estate, relocation)? That informs how much negotiation room exists.
- What's the average days-on-market for RENTAL listings here right now (not sales)? A rising rental-DOM trend means longer vacancies and softer asking-rent achievability than the comps imply.
- What's the recent tenant-quality profile in this submarket — average credit score on applications, eviction rate, late-payment / NSF rate, and stable-employment percentage? A property-management company in the area should have these aggregated.
- How much new apartment / multifamily construction is in the pipeline within 1–3 miles? Heavy new supply (>2% of stock underway) typically softens rents 12–24 months out; light construction supports rent growth.
Investment metrics
- 1% rule
- 1.47% ✓
- Cap rate
- 12.43%
- Cash-on-cash
- 21.93%
- DSCR
- 1.98
- GRM
- 5.7
CMA / ARV
- ARV (median comp)
- $197,097
- List price
- $195,000
- Delta
- -1.06%
- Verdict
- FAIR
- Comps
- 20 within 1.0 mi
Show comp detail 12 sales within ~0.75 mi
| Address | Dist | Beds/Ba | Sqft | Sold | Price | $/sf | Match |
|---|---|---|---|---|---|---|---|
| 2211 13 Mandeville St | 0.07mi | 4/2.0 | 1,644 (+0%) | 2mo | $195,000 | $119 | 94 |
| 1727 29 Marigny St | 0.26mi | 4/2.0 | 1,716 (+5%) | 1mo | $285,000 | $166 | 79 |
| 2105 07 Arts St | 0.27mi | 4/3.0 | 1,598 (-2%) | 3mo | $265,000 | $166 | 77 |
| 1834 36 Marigny St | 0.20mi | 4/2.0 | 1,508 (-8%) | 2mo | $215,000 | $143 | 76 |
| 2038 Elysian Fields Ave | 0.19mi | 4/3.0 | 1,704 (+4%) | 7mo | $240,000 | $141 | 74 |
| 2467/2469 N Tonti St | 0.22mi | 4/2.0 | 1,475 (-10%) | 2mo | $175,000 | $119 | 71 |
| 2132 Touro St | 0.32mi | 4/2.0 | 1,550 (-5%) | 6mo | $169,000 | $109 | 71 |
| 2517 N Miro St | 0.30mi | 4/2.0 | 1,857 (+13%) | 7mo | $50,000 | $27 | 58 |
| 2134 Annette St | 0.53mi | 4/4.0 | 1,816 (+11%) | 3mo | $210,000 | $116 | 47 |
| 1332 Port St | 0.65mi | 3/2.0 (-1) | 1,475 (-10%) | 6mo | $181,000 | $123 | 43 |
| 1345 Saint Anthony St | 0.72mi | 5/2.5 (+1) | 1,776 (+8%) | 7mo | $60,000 | $34 | 40 |
| 1923-25 Pauger St | 0.71mi | 4/2.0 | 1,879 (+15%) | 4mo | $70,000 | $37 | 39 |
Match score weights: distance 35% · size 25% · config 20% · recency 20%. Top-matched comps best support the ARV.
Projected returns pro-forma
-3.0% appreciation · 2.49% rent growth · sell at horizon
- IRR
- 12.2%
- Equity multiple
- 1.48×
- Total profit
- $26,286
- Equity at exit
- $29,075
- IRR
- 20.7%
- Equity multiple
- 2.71×
- Total profit
- $93,462
- Equity at exit
- $16,860
Cash invested: $54,600 (down + closing). Projections, not guarantees.
Landlord ↔ Tenant lean methodology
- Overall (STATE)
- 90 Strongly Landlord-Friendly
- State Louisiana
- 90 Strongly Landlord-Friendly · R+12
- County
- — inherits STATE
- City
- — inherits STATE
ZIP-level market 70117
- Rents YoY
- 2.5%
- Active inventory
- 581
- Price-to-rent
- 11.4×
Monthly cashflow live
- Estimated rent
- $2,863 high interval (Pro) →
- Mortgage (P&I)
- −$1,023
- Tax from tax record
- −$160 /mo · $1,922/yr
- Insurance
- −$81
- Flood insurance flood zone
- −$66 /mo · $798/yr
- HOA
- −$0
- Vacancy / Maint / Mgmt
- −$601
- Net cashflow
- $931
Break-even live
2-unit breakdown (identical units grouped — click to expand)
| Units | Beds | Baths | Est. rent |
|---|---|---|---|
| 2× units | 2 | 1 | $2,864 |
| #1 | 2 | 1 | $1,432 |
| #2 | 2 | 1 | $1,432 |
| Total (2 units) | $2,863 | ||
UW: 25.0% down · 7.5% · 30yr · 1.5% tax · 5.0% vac · 8.0% maint · 8.0% mgmt
Financing live
Cash to close
- Down payment
- $48,750
- Closing costs
- $5,850
- Reserves months
- —
- Total cash needed
- —
Loan-product check · same deal, 3 products live
Conventional
25% down · 7.5% · 30yr
- Down + closing
- —
- Monthly P&I
- —
- Monthly cashflow
- —
- DSCR
- —
- Eligible?
- —
Personal DTI + credit; lowest rate.
DSCR
20% down · 8.5% · 30yr
- Down + closing
- —
- Monthly P&I
- —
- Monthly cashflow
- —
- DSCR
- —
- Eligible?
- —
No personal income docs; deal must DSCR.
Hard money
10% down · 12.0% · 12mo
- Down + closing
- —
- Monthly P&I
- —
- Monthly cashflow
- —
- DSCR
- —
- Eligible?
- —
Short-term bridge; refi at stabilization.
Rent comps 40 comps
| Address | Beds | Baths | Sqft | Rent | $/sqft | DOM | Units | Dist |
|---|---|---|---|---|---|---|---|---|
| 2115 Mandeville St New Orleans, LA | 3.0 | 2.0 | 1400 | $1,650 | $1.18 | 24d | 1 | 0.02mi |
| 2107 Elysian Fields Ave New Orleans, LA | 4.0 | 2.0 | 1794 | $1,650 | $0.92 | 3d | 1 | 0.14mi |
| 2115 Elysian Fields Ave Unit 2115 New Orleans, LA | 3.0 | 1.0 | 1100 | $1,450 | $1.32 | 24d | 1 | 0.14mi |
| 2220 N Prieur St New Orleans, LA | 3.0 | 2.0 | 1334 | $2,000 | $1.50 | 24d | 1 | 0.20mi |
| 1710 Marigny St New Orleans, LA | 3.0 | 2.0 | 1120 | $1,750 | $1.56 | 24d | 1 | 0.29mi |
| 2515 N Galvez St New Orleans, LA | 4.0 | 2.0 | 1200 | $1,200 | $1.00 | 10d | 1 | 0.29mi |
| 2515 N Galvez St Unit 2515 New Orleans, LA | 4.0 | 2.0 | 1200 | $1,900 | $1.58 | 24d | 1 | 0.29mi |
| 2522 N Galvez St New Orleans, LA | 3.0 | 2.0 | 1105 | $1,675 | $1.52 | 24d | 1 | 0.30mi |
| 2524 N Galvez St New Orleans, LA | 3.0 | 2.5 | 1102 | $1,800 | $1.63 | 17d | 1 | 0.30mi |
| 2556 N Tonti St New Orleans, LA | 3.0 | 2.0 | 1100 | $1,850 | $1.68 | 16d | 1 | 0.31mi |
| 1837 Touro St New Orleans, LA | 3.0 | 1.0 | 1994 | $2,000 | $1.00 | 24d | 1 | 0.33mi |
| 2920 Pauger St New Orleans, LA | 4.0 | 2.0 | 1882 | $1,995 | $1.06 | 24d | 1 | 0.40mi |
| 1938 N Johnson St Unit 38 New Orleans, LA | 3.0 | 2.0 | 1844 | $2,400 | $1.30 | 24d | 1 | 0.46mi |
| 1936 N Johnson St Unit 36 New Orleans, LA | 3.0 | 2.0 | 1844 | $2,400 | $1.30 | 24d | 1 | 0.46mi |
| 3228 Pauger St New Orleans, LA | 5.0 | 2.0 | 1600 | $2,100 | $1.31 | 24d | 1 | 0.50mi |
| 1923 N Robertson St New Orleans, LA | 3.0 | 2.0 | 1051 | $1,950 | $1.86 | 3d | 1 | 0.54mi |
| 2338 Annette St Unit 1 New Orleans, LA | 3.0 | 1.0 | 1150 | $1,400 | $1.22 | 20d | 1 | 0.56mi |
| 1831 N Miro St New Orleans, LA | 3.0 | 2.0 | 1882 | $2,500 | $1.33 | 44d | 1 | 0.68mi |
| 2152 Abundance St Unit 2152 New Orleans, LA | 3.0 | 2.0 | 1100 | $1,599 | $1.45 | 3d | 1 | 0.71mi |
| 2817 Annette St New Orleans, LA | 3.0 | 1.0 | 1100 | $1,350 | $1.23 | 24d | 1 | 0.72mi |
| 1933 Industry St New Orleans, LA | 3.0 | 2.0 | 1400 | $1,595 | $1.14 | 16d | 1 | 0.77mi |
| 2317 N Rampart St Unit 1272378P New Orleans, LA | 3.0–6.0 | 2.0–4.0 | 1581 | $4,154 | $2.63 | 3d | 2 | 0.78mi |
| 2114 Feliciana St Unit A New Orleans, LA | 3.0 | 2.0 | 1134 | $1,500 | $1.32 | 16d | 1 | 0.78mi |
| 2114 Feliciana St Unit A New Orleans, LA | 3.0 | 2.0 | 1134 | $1,500 | $1.32 | 24d | 1 | 0.78mi |
| 2338 40 Annette St New Orleans, LA | 3.0 | 1.0 | 1150 | $1,385 | $1.20 | 20d | 1 | 0.83mi |
| 2331 Feliciana St New Orleans, LA | 3.0 | 2.0 | 1250 | $1,850 | $1.48 | 24d | 1 | 0.85mi |
| 2322 Burgundy St Unit C New Orleans, LA | 3.0 | 2.0 | 1250 | $2,200 | $1.76 | 24d | 1 | 0.87mi |
| 1735 N Tonti St New Orleans, LA | 3.0 | 1.0 | 1197 | $1,650 | $1.38 | 24d | 1 | 0.90mi |
| 2310 George Nick Connor Dr New Orleans, LA | 3.0 | 2.0 | 1050 | $1,600 | $1.52 | 24d | 1 | 0.90mi |
| 1231 Feliciana St New Orleans, LA | 3.0 | 2.5 | 1869 | $2,750 | $1.47 | 44d | 1 | 0.92mi |
| 1472 N Claiborne Ave New Orleans, LA | 3.0 | 1.0 | 1312 | $1,900 | $1.45 | 16d | 1 | 0.92mi |
| 1245 Kerlerec St New Orleans, LA | 3.0 | 2.0 | 1500 | $2,500 | $1.67 | 44d | 1 | 0.94mi |
| 1038 Montegut St New Orleans, LA | 3.0 | 2.5 | 2250 | $4,200 | $1.87 | 44d | 1 | 0.94mi |
| 1038 Montegut St New Orleans, LA | 3.0 | 2.5 | 2250 | $4,200 | $1.87 | 24d | 1 | 0.94mi |
| 1839 Louisa St New Orleans, LA | 3.0 | 2.0 | 1500 | $2,095 | $1.40 | 16d | 1 | 0.94mi |
| 1247 Kerlerec St New Orleans, LA | 3.0 | 2.0 | 1500 | $2,500 | $1.67 | 44d | 1 | 0.94mi |
| 1835 Louisa St New Orleans, LA | 3.0 | 2.5 | 1800 | $2,350 | $1.31 | 3d | 1 | 0.95mi |
| 1217 Kerlerec St Unit B New Orleans, LA | 3.0 | 1.0 | 1300 | $2,100 | $1.62 | 3d | 1 | 0.95mi |
| 3327 Elysian Fields Ave New Orleans, LA | 3.0 | 1.0 | 1200 | $1,300 | $1.08 | 24d | 1 | 0.95mi |
| 1822 Piety St New Orleans, LA | 3.0 | 1.5 | 1200 | $1,500 | $1.25 | 16d | 1 | 0.97mi |
Listing history 26 events
-
2026-06-18days on market $195,000 Active 256 DOM
-
2026-06-17days on market $195,000 Active 255 DOM
-
2026-06-16days on market $195,000 Active 254 DOM
-
2026-06-15days on market $195,000 Active 253 DOM
-
2026-06-13days on market $195,000 Active 251 DOM
-
2026-06-10days on market $195,000 Active 248 DOM
-
2026-06-09days on market $195,000 Active 247 DOM
-
2026-06-08days on market $195,000 Active 246 DOM
-
2026-06-07days on market $195,000 Active 245 DOM
-
2026-06-05days on market $195,000 Active 242 DOM
-
2026-06-03days on market $195,000 Active 241 DOM
-
2026-06-02days on market $195,000 Active 240 DOM
-
2026-06-01days on market $195,000 Active 239 DOM
-
2026-05-31days on market $195,000 Active 238 DOM
-
2025-10-05$195,000 Active 893-char remark
Show marketing remark (893 chars)
Discover the authentic charm of New Orleans living in this classic shotgun double located at 2109-2111 Mandeville St. This income-producing property (or ideal owner-occupant unit with rental income) features two 2-bed, 1-bath units on each side, each boasting that unmistakable New Orleans character. The traditional, flowing shotgun layout is complemented by high ceilings and an abundance of natural light. Each kitchen provides plenty of cabinet space for all your cooking needs. A major highlight is the expansive backyard, a rare and coveted feature in the city, great for gardening, entertaining, or simply enjoying the beautiful New Orleans weather. Whether you're looking for a solid investment or a place to call home with a built-in mortgage helper, this historic double is brimming with potential. Don't miss this opportunity to own a piece of The Big Easy's architectural heritage!
-
2024-09-10historical $950
-
2024-09-06price $950
-
2024-09-05$818
-
2024-09-04historical $950
-
2024-09-02$950
-
2023-08-29historical $950
-
2023-08-11price $950
-
2023-07-31price $1,000
-
2023-07-27$1,100
-
2023-07-19historical $1,200
-
2023-07-06historical
ⓘ Source: listings_history table (triggers on properties + properties_extension) + one-shot
backfill from property_details.listing_events for pre-trigger history.
Tax reassessment forecast LA · Resets to sale price
- Current annual tax
- $1,922 · $160/mo
- Projected year-2 tax
- $1,922 · $160/mo
- Expected delta
- $0/yr ($0/mo · 0.0%)
ⓘ Screening estimate from a state-policy table — verify with the county assessor before closing.
Climate risk First Street
- Flood 8/10 Severe FEMA zone X (shaded) · 60% chance over 30 yrs
- Wildfire 1/10 Low
- Heat 10/10 Extreme 7 d/yr ≥108°F today · 22 d/yr by 30 yrs out
- Wind 10/10 Extreme 99% chance of damaging wind over 30 yrs
- Air quality 4/10 Moderate 4 unhealthy d/yr today · 4 by 30 yrs out
Nearby sold comps map
Loading sold comps map…
Walkable amenities ~0.75 mi
Loading nearby amenities…
Taxation est. · year 1
- Rental income
- $34,356
- − Mortgage interest
- −$10,923
- − Property taxes
- −$1,922
- − Insurance
- −$1,772
- − Repairs & maintenance
- −$2,748
- − Management
- −$2,748
- − Depreciation
- −$5,673
- Taxable income
- $8,569
- Est. tax owed @ 24.0%
- −$2,056
- After-tax cash flow
- $9,119/yr
For passive investors: Depreciation is non-cash, so a rental often shows a tax loss while cash-flowing — sheltering income. Rental losses are passive: they offset passive income freely, and up to $25,000/yr can offset ordinary (W-2) income if you actively participate and your MAGI is under $100k (phasing out to $0 by $150k); unused losses carry forward. On sale, claimed depreciation is recaptured at up to 25%, and gains may owe capital-gains tax (a 1031 exchange can defer both). Figures are a year-1 estimate at your 24.0% rate — not tax advice; consult a CPA.
Schools (NCES district)
- District
- Orleans Parish
- NCES district ID
- 2201170
- Math proficiency
- 11% ▼ -52.00%
- Reading proficiency
- 27% ▼ -46.00%
- Median HH income
- $37,011
- Composite
- 15.78/100
- National rank
- #9271
- State rank
- #69 of 98 in LA
Livability — New Orleans
- Score
- 81/100
- State rank
- #3
- US rank
- #1383
Category grades
Schools grade is shown separately in the Schools card above.
Census & demographics
- Census place
- New Orleans, LA
- County
- Orleans Parish · 338,817 people
- City population
- 338,817
- Metro
- New Orleans-Metairie, LA
- Population (ZIP)
- 25,652
- Household income
- $45,764
- Rent vs Own
- Severe rent burden
- 1988.0
Population outlook (Orleans County) Hauer SSP2
- Today (2025)
- 513,025 people
- By 2030
- 575,781 · +12.2%
- By 2040
- 700,174 · +36.5%
- By 2050
- 826,541 · +61.1%
- By 2075
- 1,123,374 · +119.0%
- By 2100
- 1,355,609 · +164.2%
Race, ethnicity, and origin ACS 2023
- Neighborhood character
- Majority Black (60%)
- Race & ethnicity
- Black 60% White 30% Two or more races 6% Hispanic / Latino 5%
- Common ancestry
- Lithuanian 5% Italian 1% Romanian 1%
- Foreign-born
- 5% · Canada, South Korea
- Languages at home
- 93% English-only · Spanish 3% Other Indo-European 1% French/Haitian/Cajun 1%
Political lean MEDSL · Orleans
- 2024 margin
- Solid D (+67.0) · D 82.2% · R 15.2% · Other 2.7%
- 2008→2024 swing
- +6.7pp toward D · 2008: 60.3pp · 2024: 67.0pp
- All cycles
- 2024: D+67.0 2020: D+68.2 2016: D+66.2 2012: D+62.5 2008: D+60.3
Not yet ingested
- Civics
- —
Market trends
- HPI YoY
- ▼ -177.22%
- Current HPI
- 184.6061
- Rent YoY
- ▲ 2.49%
- Metro
- New Orleans-Metairie, LA
- State GDP YoY
- ▲ 3.29%
- F500 in state
- 10
Industry mix (Fortune 500 HQ in LA)
| Industry | F500 HQs | Revenue |
|---|---|---|
| Telecommunications | 2 | $23B |
|
||
| Utilities | 1 | $12B |
|
||
| Wholesale / Distribution | 1 | $5B |
|
||
| Advertising | 1 | $2B |
|
||
Price history
+16150.0% since first listed12 events — show timeline
- 2025-10-05 Listed $195,000 GSREIN
- 2024-09-10 Rental Removed $950 TURBOTENANT
- 2024-09-06 Price Changed $950 TURBOTENANT
- 2024-09-05 Listed for Rent $818 TURBOTENANT
- 2024-09-04 Rental Removed $950 TURBOTENANT
- 2024-09-02 Listed for Rent $950 TURBOTENANT
- 2023-08-29 Rental Removed $950 APPFOLIO
- 2023-08-11 Price Changed $950 APPFOLIO
- 2023-07-31 Price Changed $1,000 APPFOLIO
- 2023-07-27 Listed for Rent $1,100 APPFOLIO
- 2023-07-19 Rental Removed $1,200 APPFOLIO
- 2023-07-06 Rental Removed — TURBOTENANT
Property tax history
+23.9%/yrLatest (2026): $1,922 · +1.1% YoY. Source: county tax records.
Cash-flow waterfall
monthlySold comps — $/sqft
last 12 mo · ≤1 miLoading sold comps…