2284 W Rainier Rd · Othello, WA
Flood risk 1/10 · Minimal
- FEMA flood zone
- X (unshaded)
- Chance of flooding over 30 yrs
- 0.0%
- Est. flood insurance / yr
- $507 – $1,088
Fire risk 8/10 · Major
- Est. fire insurance / yr
- $604 – $1,122
Heat risk 4/10 · Minor
- Hot days now (above 97°F)
- 7 days/yr
- Hot days in 30 yrs
- 14 days/yr
Wind risk 1/10 · Minimal
- Chance of severe wind over 30 yrs
- —
Air-quality risk 9/10 · Severe
- Unhealthy air days now
- 18 days/yr
- Unhealthy air days in 30 yrs
- 18 days/yr
Risk factors via First Street. Map © Google.
Why this score? — see what drove the C+ grade
The composite is a weighted blend of 9 inputs, each scored 0–100. Each bar is that input's sub-score; the figure is the points it added to the 100-point composite (weight × sub-score).
- Cash flow +27.3/30.0
- DSCR +9.5/10.0
- ARV discount +7.5/15.0
- 1% rule +6.9/10.0
- Livability +3.4/5.0
- Schools +3.2/10.0
- Rent growth +2.5/5.0
- Condition / age +2.5/5.0
- Appreciation +0.0/10.0
$135,000
🖨 Deal sheet 📄 Offer letter ✓ Due diligence
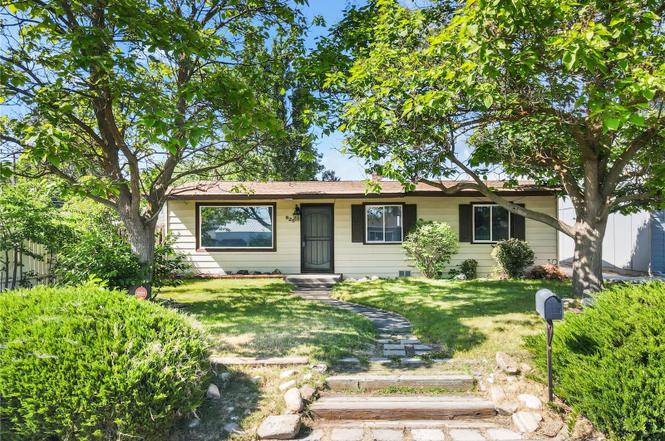
Listing remarks
This property offers space, flexibility, and a strong upside for potential. It features a skyline double wide manufactured home and a detached shop ideal for storage, hobbies, or a workspace needs. The home requires renovation, making this a great property for investors or buyers ready to build equity. Served by a shared well and irrigation water, the lot provides ample room for RV parking, gardening, outdoor projects, or future improvements. Enjoy a quiet setting just outside of town with convenient access to local amenities.
Key facts
- Quiet setting
- Detached shop
- Irrigation water
Tags
Neighborhood map
What this means for you Summary
Snapshot
- This is a 2-bed/2.0-bath manufactured listed at $135k.
Deal economics
- At list price, monthly cash flow is $389 ($5k/yr) — positive.
- The deal already cash-flows at list — no discount required.
- Meets the 1% rule at list price ($2k rent vs $135k).
- Cap rate 9.8% vs local median 2.7% in Othello — top-decile yield for the area; either an underpriced asset or a hidden risk that comps aren't pricing in. Stress-test before assuming the spread holds.
Location & tenants
- Location reads 67/100 on livability (#312 in WA) — a middle-class / working-renter tenant base. Strengths: cost of living A+, housing A+, health & safety A+; Watch: crime D, amenities F, commute F.
- Othello School District (town): math 33% / reading 35% proficiency, ranked #257 of 291 in WA (top 88%) — families likely to look elsewhere, expect single-tenant / working-renter base with shorter leases; 68% free/reduced lunch — lower-income household profile, screen leases tightly.
- Zoned schools: Othello High School (1,333 students, 82% FRL).
- Market conditions: 87 active listings in the ZIP; 49 units permitted in Adams County in 2024 (0 in 5+ unit buildings).
Forward outlook
- Local home prices are declining (-3.0%/yr); year-one equity from $933 of loan paydown is wiped out by about $4k of value loss. Plan a longer hold.
- Adams County population projected at +8% by 2050 — modest demand growth; plan on rents tracking national, not racing it.
- At projected returns (-3.0% appreciation + 3.0% rent growth), your $38k cash investment doubles in ~10 years — after that, you're playing with house money.
Negotiation context
- Only 3 days on market — expect competitive offers; lowballing is unlikely to land.
Risks & watch-outs
- Climate carrying-cost: severe wildfire risk — expect insurance premiums to compound above CPI over the hold.
Questions for the listing agent
- Built in 1969 — when were the roof, HVAC, electrical panel, plumbing, and water heater last replaced?
- Is there a deadline driving the sale (1031 exchange, divorce, estate, relocation)? That informs how much negotiation room exists.
- Schools are D-rated, which usually means shorter tenancies and higher turnover. Who's the typical renter profile here, and what's been the actual vacancy rate?
- Crime grade is D in this area — have there been break-ins, vandalism, or insurance claims at this property in the last 3 years? What carrier currently insures it and at what premium?
- What's the average days-on-market for RENTAL listings here right now (not sales)? A rising rental-DOM trend means longer vacancies and softer asking-rent achievability than the comps imply.
- What's the recent tenant-quality profile in this submarket — average credit score on applications, eviction rate, late-payment / NSF rate, and stable-employment percentage? A property-management company in the area should have these aggregated.
- How much new for-sale + rental construction is in the pipeline within 1–3 miles? Heavy new supply typically softens prices + rents 12–24 months out; constrained supply supports both.
Investment metrics
- 1% rule
- 1.19% ✓
- Cap rate
- 9.75%
- Cash-on-cash
- 12.36%
- DSCR
- 1.55
- GRM
- 7.0
CMA / ARV
No comps found within radius.
Projected returns pro-forma
-3.0% appreciation · 3.0% rent growth · sell at horizon
- IRR
- 2.0%
- Equity multiple
- 1.08×
- Total profit
- $2,916
- Equity at exit
- $20,129
- IRR
- 11.6%
- Equity multiple
- 1.91×
- Total profit
- $34,446
- Equity at exit
- $11,672
Cash invested: $37,800 (down + closing). Projections, not guarantees.
Landlord ↔ Tenant lean methodology
- Overall (STATE)
- 28 Tenant-Leaning
- State Washington
- 28 Tenant-Leaning · D+8
- County
- — inherits STATE
- City
- — inherits STATE
ZIP-level market 99344
- Active inventory
- 87
- Price-to-rent
- 7.0×
Monthly cashflow live
- Estimated rent
- $1,611 medium interval (Pro) →
- Mortgage (P&I)
- −$708
- Tax from tax record
- −$119 /mo · $1,430/yr
- Insurance
- −$56
- HOA
- −$0
- Vacancy / Maint / Mgmt
- −$338
- Net cashflow
- $389
Break-even live
UW: 25.0% down · 7.5% · 30yr · 1.5% tax · 5.0% vac · 8.0% maint · 8.0% mgmt
Financing live
Cash to close
- Down payment
- $33,750
- Closing costs
- $4,050
- Reserves months
- —
- Total cash needed
- —
Loan-product check · same deal, 3 products live
Conventional
25% down · 7.5% · 30yr
- Down + closing
- —
- Monthly P&I
- —
- Monthly cashflow
- —
- DSCR
- —
- Eligible?
- —
Personal DTI + credit; lowest rate.
DSCR
20% down · 8.5% · 30yr
- Down + closing
- —
- Monthly P&I
- —
- Monthly cashflow
- —
- DSCR
- —
- Eligible?
- —
No personal income docs; deal must DSCR.
Hard money
10% down · 12.0% · 12mo
- Down + closing
- —
- Monthly P&I
- —
- Monthly cashflow
- —
- DSCR
- —
- Eligible?
- —
Short-term bridge; refi at stabilization.
Listing history 2 events
-
2026-02-22status Pending
-
2026-02-19$135,000 Active
ⓘ Source: listings_history table (triggers on properties + properties_extension) + one-shot
backfill from property_details.listing_events for pre-trigger history.
Tax reassessment forecast WA · Resets to sale price
- Current annual tax
- $1,430 · $119/mo
- Projected year-2 tax
- $1,430 · $119/mo
- Expected delta
- $0/yr ($0/mo · 0.0%)
ⓘ Screening estimate from a state-policy table — verify with the county assessor before closing.
Climate risk First Street
- Flood 1/10 Low FEMA zone X (unshaded) · 0% chance over 30 yrs
- Wildfire 8/10 Severe
- Heat 4/10 Moderate 7 d/yr ≥97°F today · 14 d/yr by 30 yrs out
- Wind 1/10 Low
- Air quality 9/10 Extreme 18 unhealthy d/yr today · 18 by 30 yrs out
Nearby sold comps map
Loading sold comps map…
Walkable amenities ~0.75 mi
Loading nearby amenities…
Taxation est. · year 1
- Rental income
- $19,332
- − Mortgage interest
- −$7,562
- − Property taxes
- −$1,430
- − Insurance
- −$675
- − Repairs & maintenance
- −$1,547
- − Management
- −$1,547
- − Depreciation
- −$3,927
- Taxable income
- $2,645
- Est. tax owed @ 24.0%
- −$635
- After-tax cash flow
- $4,037/yr
For passive investors: Depreciation is non-cash, so a rental often shows a tax loss while cash-flowing — sheltering income. Rental losses are passive: they offset passive income freely, and up to $25,000/yr can offset ordinary (W-2) income if you actively participate and your MAGI is under $100k (phasing out to $0 by $150k); unused losses carry forward. On sale, claimed depreciation is recaptured at up to 25%, and gains may owe capital-gains tax (a 1031 exchange can defer both). Figures are a year-1 estimate at your 24.0% rate — not tax advice; consult a CPA.
Schools (NCES district)
- District
- Othello School District
- NCES district ID
- 5306480
- Math proficiency
- 33% ▼ -3.00%
- Reading proficiency
- 35% ▼ -1.00%
- Median HH income
- $43,296
- Composite
- 31.55/100
- National rank
- #11156
- State rank
- #257 of 291 in WA
Livability — Othello
- Score
- 67/100
- State rank
- #312
- US rank
- #11063
Category grades
Schools grade is shown separately in the Schools card above.
Census & demographics
- City population
- 19,458
- Population (ZIP)
- 19,458
Population outlook (Adams County) Hauer SSP2
- Today (2025)
- 19,554 people
- By 2030
- 19,746 · +1.0%
- By 2040
- 20,362 · +4.1%
- By 2050
- 21,026 · +7.5%
- By 2075
- 22,272 · +13.9%
- By 2100
- 22,737 · +16.3%
Race, ethnicity, and origin ACS 2023
- Neighborhood character
- Predominantly Hispanic (73%)
- Race & ethnicity
- Hispanic / Latino 73% White 25% Two or more races 21% Native American 3%
- Hispanic origin (detail)
- Mexican 68%
- Common ancestry
- Portuguese 2% Lithuanian 1% Italian 1%
- Foreign-born
- 27% · Canada
- Languages at home
- 40% English-only · Spanish 59%
Political lean MEDSL · Adams
- 2024 margin
- Solid R (+43.3) · D 27.2% · R 70.5% · Other 2.3%
- 2008→2024 swing
- -8.9pp toward R · 2008: -34.4pp · 2024: -43.3pp
- All cycles
- 2024: R+43.3 2020: R+35.7 2016: R+39.7 2012: R+33.9 2008: R+34.4
Not yet ingested
- Civics
- —
Market trends
- HPI YoY
- ▼ -401.63%
- Current HPI
- 212.6444
- Rent YoY
- —
- Metro
- —
- State GDP YoY
- ▲ 4.65%
- F500 in state
- 22
Industry mix (Fortune 500 HQ in WA)
| Industry | F500 HQs | Revenue |
|---|---|---|
| Retail | 2 | $269B |
|
||
| Technology / Retail | 1 | $638B |
|
||
| Technology | 1 | $245B |
|
||
| Telecommunications | 1 | $38B |
|
||
| Food / Beverage | 1 | $36B |
|
||
| Automotive / Trucks | 1 | $34B |
|
||
Price history
2 events — show timeline
- 2026-02-22 Pending — NWMLS as Distributed by MLS Grid
- 2026-02-19 Listed $135,000 NWMLS as Distributed by MLS Grid
Property tax history
+3.8%/yrLatest (2026): $1,430 · -1.9% YoY. Source: county tax records.
Cash-flow waterfall
monthlySold comps — $/sqft
last 12 mo · ≤1 miLoading sold comps…