37 Pottery Dr · Fancy Gap, VA
Flood risk No data
- FEMA flood zone
- —
- Chance of flooding over 30 yrs
- —
- Est. flood insurance / yr
- —
Fire risk No data
- Est. fire insurance / yr
- —
Heat risk No data
- Hot days now (above threshold)
- —
- Hot days in 30 yrs
- —
Wind risk No data
- Chance of severe wind over 30 yrs
- —
Air-quality risk No data
- Unhealthy air days now
- —
- Unhealthy air days in 30 yrs
- —
Risk factors via First Street. Map © Google.
Why this score? — see what drove the D+ grade
The composite is a weighted blend of 9 inputs, each scored 0–100. Each bar is that input's sub-score; the figure is the points it added to the 100-point composite (weight × sub-score).
- Cash flow +17.4/30.0
- Appreciation +6.4/10.0
- DSCR +5.4/10.0
- Schools +5.4/10.0
- 1% rule +3.6/10.0
- Livability +2.8/5.0
- Rent growth +2.5/5.0
- Condition / age +2.5/5.0
- ARV discount +0.0/15.0
$209,900
🖨 Deal sheet 📄 Offer letter ✓ Due diligence
Listing remarks
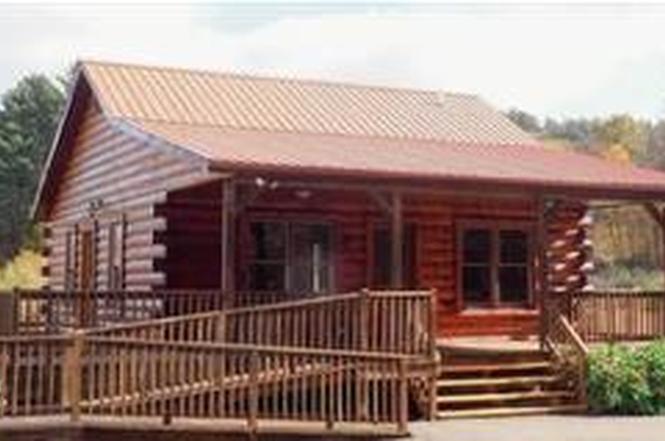
Log home just off I-77 offering exceptional flexibility for residential living, income production, or a live/work opportunity—only one mile from the Blue Ridge Parkway. The main level features an open-concept kitchen and living area anchored by a gas-burning stone fireplace, solid hardwood flooring, two spacious bedrooms, a full bath, and convenient washer/dryer hookups. The lower level provides a separate living space complete with its own kitchen, living area, full bath, two bedrooms, and an additional storage room—ideal for extended family, guests, or rental income. Extensively updated and being sold partially furnished, the property includes major kitchen appliances on both
Key facts
- Open-concept kitchen
- 0.28 acre lot
- Built 2006
Tags
Property features AI
Exterior
- Utilities: Public water; Public sewer; Propane available
- Home design: Single family residence; Two levels; Residential property
- Construction: Block and log construction; Metal roof; 870 sq ft finished area below grade; Built with a basement
- Exterior features: Deck; Shed(s); Corner lot
Interior
- Kitchen: Dishwasher; Microwave; Refrigerator
- Flooring: Wood floors
- Bathrooms: 2 full bathrooms
- Heating & cooling: Electric heating; Heat pump; Propane heating; Ceiling fans
- Interior features: Vaulted ceilings; Insulated windows; Gas log fireplace; Has basement
- Laundry & utility: Washer; Dryer
Neighborhood map
What this means for you Summary
Snapshot
- This is a 4-bed/2.0-bath single-family listed at $210k.
Deal economics
- At list price, monthly cash flow is $157 ($2k/yr) — positive.
- The deal already cash-flows at list — no discount required.
- To meet the 1% rule (rent ≥ 1% of price), the offer needs to be $181k (13.6% below list).
- Recommended offer: $181k (13.6% below list) — sets the bar for 1% rule.
- Cap rate 7.2% vs local median 3.8% in Fancy Gap — top-decile yield for the area; either an underpriced asset or a hidden risk that comps aren't pricing in. Stress-test before assuming the spread holds.
Location & tenants
- Location reads 56/100 on livability (#515 in VA) — a working-class tenant base; expect higher turnover. Strengths: cost of living A+, crime A; Watch: amenities F, commute F, employment F.
- Carroll County Public School District (rural): math 60% / reading 70% proficiency, ranked #46 of 131 in VA (top 35%) — acceptable for families but not a draw, mixed tenant base, ~2y average lease.
- Zoned schools: Fancy Gap Elementary (math 92% / reading 87%, grade A+, #19 of 1,108 statewide, top 2%, 127 students, 85% FRL); Carroll County Middle (math 54% / reading 72%, grade B+, #134 of 342 statewide, top 40%, 756 students, 84% FRL); Carroll County High (math 64% / reading 67%, grade B, #204 of 319 statewide, top 65%, 1,069 students, 81% FRL) — zoned schools average 83% FRL vs 48% district-wide (35 pts higher); higher-poverty schools than district average — tighter screening recommended.
- Market conditions: 134 active listings in the ZIP; 80 units permitted in Carroll County in 2024 (0 in 5+ unit buildings).
Forward outlook
- In year one you build about $7k of equity ($1k loan paydown + $6k appreciation (2.9% local appreciation)).
- Carroll County population projected at -18% by 2050 — secular population decline; favor cash flow + early exit over multi-decade hold.
- At projected returns (2.9% appreciation + 3.0% rent growth), your $59k cash investment doubles in ~6 years — after that, you're playing with house money.
- By year 5, paydown + projected appreciation supports a ~$32k cash-out refi (75% LTV) — recoverable capital for the next deal without selling this one.
Negotiation context
- It's been on market 74 days — a 6% lower offer ($197k) is reasonable based on typical stale-listing flexibility.
- 5 sale attempts since 9y ago; this cycle's ask has dropped $15k (7%) from the opening price — seller is motivated, your offer sets the floor, not the list.
Questions for the listing agent
- It's been on market 74 days. Have you received any prior offers? Is the seller open to a 14% concession, seller financing, or rate buy-down credit?
- Why hasn't it sold? Are there any deal-killer items the seller is aware of (foundation, flood, title, zoning, code violations)?
- Is there a deadline driving the sale (1031 exchange, divorce, estate, relocation)? That informs how much negotiation room exists.
- Schools are A-rated — typically a magnet for longer-tenancy family renters. What's the average tenant stay here, and is there a school-zone premium baked into asking?
- The area grade is low — what's the realistic commute time and amenity access for the typical tenant pool here? Any planned neighborhood developments (good or bad) we should know about?
- What's the average days-on-market for RENTAL listings here right now (not sales)? A rising rental-DOM trend means longer vacancies and softer asking-rent achievability than the comps imply.
- What's the recent tenant-quality profile in this submarket — average credit score on applications, eviction rate, late-payment / NSF rate, and stable-employment percentage? A property-management company in the area should have these aggregated.
- How much new for-sale + rental construction is in the pipeline within 1–3 miles? Heavy new supply typically softens prices + rents 12–24 months out; constrained supply supports both.
Investment metrics
- 1% rule
- 0.86% ✗
- Cap rate
- 7.19%
- Cash-on-cash
- 3.21%
- DSCR
- 1.14
- GRM
- 9.6
CMA / ARV
- ARV (on-the-fly)
- $149,640
- Comps found
- 1
Show comp detail 1 sale within ~0.75 mi
| Address | Dist | Beds/Ba | Sqft | Sold | Price | $/sf | Match |
|---|---|---|---|---|---|---|---|
| 37 Pottery Dr | 0.00mi | 4/2.0 | 1,740 (0%) | 1mo | $150,000 | $86 | 100 |
Match score weights: distance 35% · size 25% · config 20% · recency 20%. Top-matched comps best support the ARV.
Projected returns pro-forma
2.85% appreciation · 3.0% rent growth · sell at horizon
- IRR
- 10.1%
- Equity multiple
- 1.57×
- Total profit
- $33,541
- Equity at exit
- $92,596
- IRR
- 12.5%
- Equity multiple
- 2.83×
- Total profit
- $107,387
- Equity at exit
- $141,329
Cash invested: $58,772 (down + closing). Projections, not guarantees.
Landlord ↔ Tenant lean methodology
- Overall (STATE)
- 55 Moderately Landlord-Leaning
- State Virginia
- 55 Moderately Landlord-Leaning · D+2
- County
- — inherits STATE
- City
- — inherits STATE
ZIP-level market 24328
- Home prices YoY
- 1.7%
- Active inventory
- 134
- Price-to-rent
- 9.6×
Monthly cashflow live
- Estimated rent
- $1,813 medium interval (Pro) →
- Mortgage (P&I)
- −$1,101
- Tax from tax record
- −$87 /mo · $1,044/yr
- Insurance
- −$87
- HOA
- −$0
- Vacancy / Maint / Mgmt
- −$381
- Net cashflow
- $157
Break-even live
UW: 25.0% down · 7.5% · 30yr · 1.5% tax · 5.0% vac · 8.0% maint · 8.0% mgmt
Financing live
Cash to close
- Down payment
- $52,475
- Closing costs
- $6,297
- Reserves months
- —
- Total cash needed
- —
Loan-product check · same deal, 3 products live
Conventional
25% down · 7.5% · 30yr
- Down + closing
- —
- Monthly P&I
- —
- Monthly cashflow
- —
- DSCR
- —
- Eligible?
- —
Personal DTI + credit; lowest rate.
DSCR
20% down · 8.5% · 30yr
- Down + closing
- —
- Monthly P&I
- —
- Monthly cashflow
- —
- DSCR
- —
- Eligible?
- —
No personal income docs; deal must DSCR.
Hard money
10% down · 12.0% · 12mo
- Down + closing
- —
- Monthly P&I
- —
- Monthly cashflow
- —
- DSCR
- —
- Eligible?
- —
Short-term bridge; refi at stabilization.
Listing history 11 events
-
2026-05-02status Pending
-
2026-04-02price $209,900
-
2026-02-17$225,000 Active
-
2025-07-16price $239,000
-
2025-04-10price $255,000
-
2022-05-04soldstatus $192,000
-
2021-11-02$229,000
-
2020-08-06$169,000
-
2017-08-07$159,000
-
2017-08-04$169,000
-
2004-03-11soldstatus $135,000
ⓘ Source: listings_history table (triggers on properties + properties_extension) + one-shot
backfill from property_details.listing_events for pre-trigger history.
Tax reassessment forecast VA · Resets to sale price
- Current annual tax
- $1,044 · $87/mo
- Projected year-2 tax
- $1,721 · $143/mo
- Expected delta
- +$677/yr (+$56/mo · 64.9%)
ⓘ Screening estimate from a state-policy table — verify with the county assessor before closing.
Nearby sold comps map
Loading sold comps map…
Walkable amenities ~0.75 mi
Loading nearby amenities…
Taxation est. · year 1
- Rental income
- $21,758
- − Mortgage interest
- −$11,758
- − Property taxes
- −$1,044
- − Insurance
- −$1,050
- − Repairs & maintenance
- −$1,741
- − Management
- −$1,741
- − Depreciation
- −$6,106
- Taxable loss
- −$1,681
- Est. tax savings @ 24.0%
- +$403
- After-tax cash flow
- $2,290/yr
For passive investors: Depreciation is non-cash, so a rental often shows a tax loss while cash-flowing — sheltering income. Rental losses are passive: they offset passive income freely, and up to $25,000/yr can offset ordinary (W-2) income if you actively participate and your MAGI is under $100k (phasing out to $0 by $150k); unused losses carry forward. On sale, claimed depreciation is recaptured at up to 25%, and gains may owe capital-gains tax (a 1031 exchange can defer both). Figures are a year-1 estimate at your 24.0% rate — not tax advice; consult a CPA.
Schools (NCES district)
- District
- Carroll County Public School District
- NCES district ID
- 5100690
- Math proficiency
- 60% ▼ -25.00%
- Reading proficiency
- 70% ▼ -10.00%
- Median HH income
- $36,359
- Composite
- 53.88/100
- National rank
- #1406
- State rank
- #46 of 131 in VA
Livability — Fancy Gap
- Score
- 56/100
- State rank
- #515
- US rank
- #23081
Category grades
Schools grade is shown separately in the Schools card above.
Census & demographics
- Population (ZIP)
- 1,724
Population outlook (Carroll County) Hauer SSP2
- Today (2025)
- 28,768 people
- By 2030
- 27,909 · -3.0%
- By 2040
- 25,788 · -10.4%
- By 2050
- 23,522 · -18.2%
- By 2075
- 19,045 · -33.8%
- By 2100
- 14,801 · -48.6%
Race, ethnicity, and origin ACS 2023
- Neighborhood character
- Predominantly White (97%)
- Race & ethnicity
- White 97%
- Common ancestry
- Italian 7% Serbian 4% Slovak 2%
Political lean MEDSL · Carroll
- 2024 margin
- Solid R (+63.3) · D 18.1% · R 81.4%
- 2008→2024 swing
- -30.9pp toward R · 2008: -32.4pp · 2024: -63.3pp
- All cycles
- 2024: R+63.3 2020: R+62.7 2016: R+59.6 2012: R+39.4 2008: R+32.4
Not yet ingested
- Civics
- —
Market trends
- HPI YoY
- ▲ 2.85%
- Current HPI
- 168.5656
- Rent YoY
- —
- Metro
- —
- State GDP YoY
- ▲ 2.40%
- F500 in state
- 50
Industry mix (Fortune 500 HQ in VA)
| Industry | F500 HQs | Revenue |
|---|---|---|
| Aerospace / Defense | 4 | $236B |
|
||
| Technology / Defense | 3 | $32B |
|
||
| Financial Services | 2 | $176B |
|
||
| Utilities | 2 | $27B |
|
||
| Insurance | 2 | $25B |
|
||
| Technology | 2 | $15B |
|
||
Price history
+55.5% since first listed11 events — show timeline
- 2026-05-02 Pending — SWVAR
- 2026-04-02 Price Changed $209,900 SWVAR
- 2026-02-17 Listed $225,000 SWVAR
- 2025-07-16 Price Changed $239,000 SWVAR
- 2025-04-10 Price Changed $255,000 SWVAR
- 2022-05-04 Sold (MLS) $192,000 SWVAR
- 2021-11-02 Listed $229,000 SWVAR
- 2020-08-06 Listed $169,000 SWVAR
- 2017-08-07 Listed $159,000 NRVMLS
- 2017-08-04 Listed $169,000 SWVAR
- 2004-03-11 Sold (Public Records) $135,000 Public Records
Property tax history
-0.6%/yrLatest (2016): $1,044 · +0.0% YoY. Source: county tax records.
Cash-flow waterfall
monthlySold comps — $/sqft
last 12 mo · ≤1 miLoading sold comps…