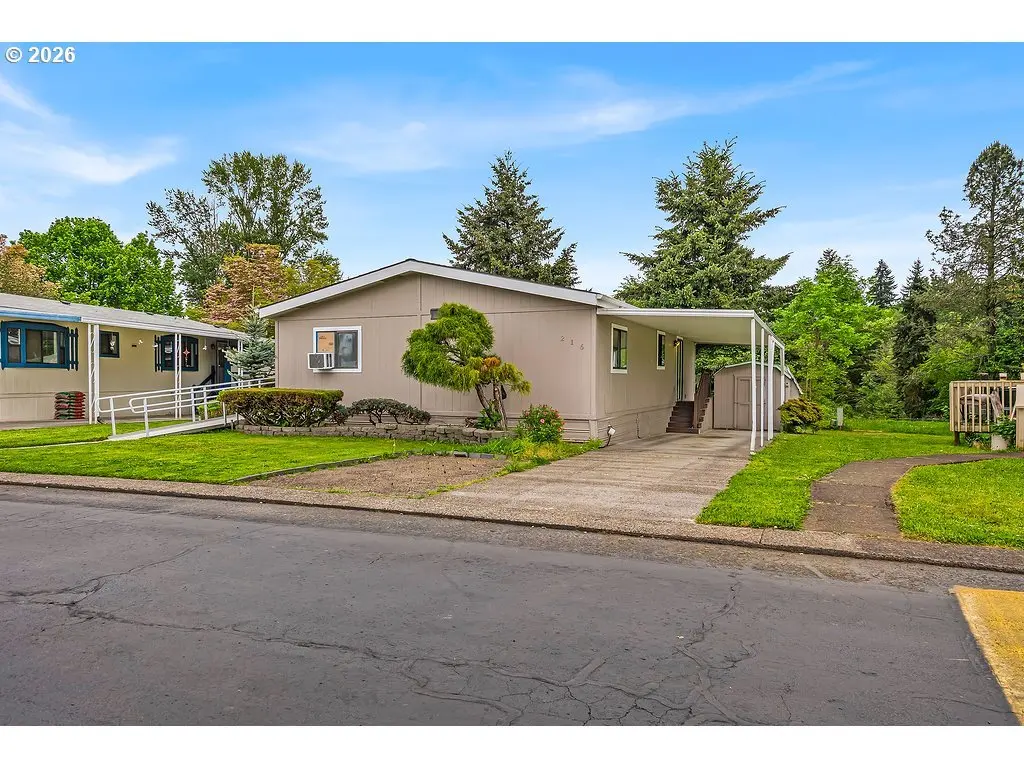
12450 SW Fischer Rd #216 · King City, OR
Flood risk 1/10 · Minimal
- FEMA flood zone
- X (shaded)
- Chance of flooding over 30 yrs
- 0.0%
- Est. flood insurance / yr
- $507 – $1,088
Fire risk 4/10 · Minor
- Est. fire insurance / yr
- $498 – $926
Heat risk 3/10 · Minor
- Hot days now (above 92°F)
- 7 days/yr
- Hot days in 30 yrs
- 14 days/yr
Wind risk 1/10 · Minimal
- Chance of severe wind over 30 yrs
- —
Air-quality risk 9/10 · Severe
- Unhealthy air days now
- 12 days/yr
- Unhealthy air days in 30 yrs
- 13 days/yr
Risk factors via First Street. Map © Google.
Why this score? — see what drove the C+ grade
The composite is a weighted blend of 9 inputs, each scored 0–100. Each bar is that input's sub-score; the figure is the points it added to the 100-point composite (weight × sub-score).
- Cash flow +26.2/30.0
- DSCR +8.9/10.0
- ARV discount +7.5/15.0
- 1% rule +5.7/10.0
- Schools +4.9/10.0
- Livability +4.2/5.0
- Condition / age +2.5/5.0
- Rent growth +2.4/5.0
- Appreciation +0.0/10.0
$165,000
🖨 Deal sheet 📄 Offer letter ✓ Due diligence
Listing remarks
Welcome to this 3-bedroom, 2-bath home situated on a spacious lot. This home features fresh interior paint completed in 2025 and a roof replaced in 2016. The spacious living room and dining area showcase durable vinyl flooring, creating a warm and functional space for everyday living and entertaining. The generously sized bedrooms offer ample closet space. The kitchen includes a freestanding refrigerator and freestanding range. Enjoy peaceful mornings on the backyard deck while listening to the birds chirping in the serene yard setting. The property also includes two storage sheds, providing plenty of room for tools, hobbies, or additional storage needs. Located in King Village Park, an all
Key facts
- 2 garage spots
- Community pool
- Built 1986
Property features AI
Finance
- Other: Park rules apply to pets (see rules)
- Financial info: Land lease monthly fee collected by park (lot rent listed separately); Land lease expires December 31, 2026
- HOA & community: Park amenities include basketball court, gym, management, party room, pool and recreation facilities; Park name: King Village; Water and sewer included with the park (sewer billed bi-monthly); Land lease in effect (monthly lot rent; see park for details)
Exterior
- Parking: Carport (2 spaces); Off-street parking for 2 vehicles
- Security: Handicap access (listed under property features)
- Utilities: Public water; Public sewer (sewer billed bi-monthly by the park); Electricity for fuel and hot water
- Home design: Manufactured home in a park; Single-level living (main level); Resale condition; Built in 1986; No notable view
- Construction: Composition roof; Skirting foundation; Manufactured home construction (manufacturer: Fuqua Homes Inc)
- Exterior features: Deck; Tool shed; Yard; T-111 siding
Interior
- Kitchen: Free-standing range; Free-standing refrigerator; Vinyl floor in kitchen
- Bedrooms: Primary bedroom on main level with attached bathroom; Second bedroom on main level (10 x 9); Third bedroom on main level (9 x 7)
- Flooring: Vinyl flooring in living areas and kitchen; Wall-to-wall carpet in bedrooms
- Bathrooms: Two full bathrooms, both on the main level
- Heating & cooling: Forced air heating; No central cooling
- Interior features: Accessible approach with ramp; Handicap access; Washer/dryer included; Vinyl flooring in some areas; Wall-to-wall carpet in bedrooms and other areas
- Laundry & utility: Washer and dryer included; Electric hot water
Neighborhood map
What this means for you Summary
Snapshot
- This is a 2-bed/2.0-bath manufactured listed at $165k.
Deal economics
- At list price, monthly cash flow is $422 ($5k/yr) — positive.
- The deal already cash-flows at list — no discount required.
- Meets the 1% rule at list price ($2k rent vs $165k).
- Recommended offer: $160k (3.0% below list) — sets the bar for market timing.
- Cap rate 9.4% vs local median 2.7% in King City — top-decile yield for the area; either an underpriced asset or a hidden risk that comps aren't pricing in. Stress-test before assuming the spread holds.
Location & tenants
- Location reads 85/100 on livability (#24 in OR, #539 nationally) — a professional / high-income tenant draw. Strengths: crime A+, commute A+, housing A+.
- Tigard-Tualatin SD 23J (suburban): math 47% / reading 65% proficiency, ranked #6 of 58 in OR (top 10%) — acceptable for families but not a draw, mixed tenant base, ~2y average lease.
- Zoned schools: Alberta Rider Elementary School (math 24% / reading 75%, grade D+, #100 of 412 statewide, top 26%, 504 students, 22% FRL); Twality Middle School (math 54% / reading 64%, grade B, #17 of 128 statewide, top 14%, 918 students, 31% FRL); Tigard High School (math 24% / reading 75%, grade D+, #32 of 143 statewide, top 34%, 1,799 students, 31% FRL) — zoned schools at 28% FRL track the district average.
- Market conditions: Rents soft (-0.4%/yr); 412 active listings in the ZIP; 27 comparable units currently listed for rent nearby; rentals leasing fast (median 11d on market — plan ~1-2 weeks tenant-placement turnaround); solid renter incomes; 2,224 units permitted in Washington County in 2024 (242 in 5+ unit buildings).
Forward outlook
- Local home prices are declining (-3.0%/yr); year-one equity from $1k of loan paydown is wiped out by about $5k of value loss. Plan a longer hold.
- Washington County population projected at +33% by 2050 — long-run rental-demand tailwind backs the buy-and-hold thesis.
Negotiation context
- It's been on market 42 days — a 3% lower offer ($160k) is reasonable based on typical stale-listing flexibility.
- Current owner paid $26k; list at $165k implies a 537% gain — meaningful room to come down on a strong offer.
Questions for the listing agent
- It's been on market 42 days. Have you received any prior offers? Is the seller open to a 3% concession, seller financing, or rate buy-down credit?
- Is there a deadline driving the sale (1031 exchange, divorce, estate, relocation)? That informs how much negotiation room exists.
- What's the average days-on-market for RENTAL listings here right now (not sales)? A rising rental-DOM trend means longer vacancies and softer asking-rent achievability than the comps imply.
- What's the recent tenant-quality profile in this submarket — average credit score on applications, eviction rate, late-payment / NSF rate, and stable-employment percentage? A property-management company in the area should have these aggregated.
- How much new for-sale + rental construction is in the pipeline within 1–3 miles? Heavy new supply typically softens prices + rents 12–24 months out; constrained supply supports both.
Investment metrics
- 1% rule
- 1.07% ✓
- Cap rate
- 9.36%
- Cash-on-cash
- 10.95%
- DSCR
- 1.49
- GRM
- 7.8
CMA / ARV
- ARV (median comp)
- $67,049
- List price
- $165,000
- Delta
- 146.09%
- Verdict
- OVERPRICED
- Comps
- 20 within 1.0 mi
Show comp detail 12 sales within ~0.75 mi
| Address | Dist | Beds/Ba | Sqft | Sold | Price | $/sf | Match |
|---|---|---|---|---|---|---|---|
| 17041 SW Eldorado Dr | 0.20mi | 2/2.0 | 1,152 (+7%) | 3mo | $81,500 | $71 | 77 |
| 17009 SW Eldorado Dr #5 | 0.27mi | 2/2.0 | 1,152 (+7%) | 1mo | $60,000 | $52 | 75 |
| 17084 SW Eldorado Dr | 0.17mi | 2/2.0 | 1,152 (+7%) | 7mo | $42,000 | $36 | 75 |
| 17229 SW Eldorado Dr | 0.26mi | 2/2.0 | 1,153 (+7%) | 10mo | $74,000 | $64 | 68 |
| 11489 SW Royal Villa Dr #196 | 0.53mi | 2/2.0 | 1,080 (0%) | 10mo | $73,000 | $68 | 67 |
| 18485 SW Pacific Dr #69 | 0.65mi | 2/2.0 | 1,104 (+2%) | 1mo | $68,000 | $62 | 65 |
| 17003 SW Eldorado Dr | 0.25mi | 2/2.0 | 960 (-11%) | 10mo | $65,000 | $68 | 61 |
| 11491 SW Royal Villa Dr | 0.43mi | 2/2.0 | 1,152 (+7%) | 10mo | $129,000 | $112 | 60 |
| 11568 SW Royal Villa Dr | 0.59mi | 2/2.0 | 1,152 (+7%) | 9mo | $155,000 | $135 | 54 |
| 11526 SW Royal Villa Dr | 0.60mi | 2/2.0 | 960 (-11%) | 2mo | $25,000 | $26 | 52 |
| 11550 SW Royal Villa Dr | 0.53mi | 2/2.0 | 968 (-10%) | 11mo | $145,000 | $150 | 49 |
| 18485 SW Pacific Dr #44 | 0.63mi | 2/1.0 | 972 (-10%) | 3mo | $91,000 | $94 | 48 |
Match score weights: distance 35% · size 25% · config 20% · recency 20%. Top-matched comps best support the ARV.
Projected returns pro-forma
-3.0% appreciation · 0.0% rent growth · sell at horizon
- IRR
- -3.0%
- Equity multiple
- 0.89×
- Total profit
- $-5,127
- Equity at exit
- $24,602
- IRR
- 3.3%
- Equity multiple
- 1.21×
- Total profit
- $9,822
- Equity at exit
- $14,266
Cash invested: $46,200 (down + closing). Projections, not guarantees.
Landlord ↔ Tenant lean methodology
- Overall (STATE)
- 28 Tenant-Leaning
- State Oregon
- 28 Tenant-Leaning · D+6
- County
- — inherits STATE
- City
- — inherits STATE
ZIP-level market 97224
- Rents YoY
- -0.4%
- Active inventory
- 412
- Price-to-rent
- 7.8×
Monthly cashflow live
- Estimated rent
- $1,765 high interval (Pro) →
- Mortgage (P&I)
- −$865
- Tax from tax record
- −$39 /mo · $463/yr
- Insurance
- −$69
- HOA
- −$0
- Vacancy / Maint / Mgmt
- −$371
- Net cashflow
- $422
Break-even live
UW: 25.0% down · 7.5% · 30yr · 1.5% tax · 5.0% vac · 8.0% maint · 8.0% mgmt
Financing live
Cash to close
- Down payment
- $41,250
- Closing costs
- $4,950
- Reserves months
- —
- Total cash needed
- —
Loan-product check · same deal, 3 products live
Conventional
25% down · 7.5% · 30yr
- Down + closing
- —
- Monthly P&I
- —
- Monthly cashflow
- —
- DSCR
- —
- Eligible?
- —
Personal DTI + credit; lowest rate.
DSCR
20% down · 8.5% · 30yr
- Down + closing
- —
- Monthly P&I
- —
- Monthly cashflow
- —
- DSCR
- —
- Eligible?
- —
No personal income docs; deal must DSCR.
Hard money
10% down · 12.0% · 12mo
- Down + closing
- —
- Monthly P&I
- —
- Monthly cashflow
- —
- DSCR
- —
- Eligible?
- —
Short-term bridge; refi at stabilization.
Rent comps 27 comps
| Address | Beds | Baths | Sqft | Rent | $/sqft | DOM | Units | Dist |
|---|---|---|---|---|---|---|---|---|
| 17865 SW Pacific Hwy Tualatin, OR | 1.0–3.0 | 1.0–2.0 | 970 | $1,970 | $2.03 | 1d | 13 | 0.18mi |
| 12070 SW Fischer Rd Portland, OR | 1.0–3.0 | 1.0–2.0 | 925 | $1,812 | $1.96 | 1d | 9 | 0.28mi |
| 11865 SW Tualatin Rd Tualatin, OR | 2.0–3.0 | 2.0–2.5 | 1154 | $1,697 | $1.47 | 1d | 19 | 0.32mi |
| 17000 SW Pacific Hwy Portland, OR | 1.0–2.0 | 1.0–2.0 | 684 | $1,575 | $2.30 | 43d | 3 | 0.36mi |
| 10900 SW Gaarde St Portland, OR | 2.0 | 1.0 | 825 | $1,525 | $1.85 | 7d | 4 | 0.36mi |
| 10900 SW Gaarde St Unit 273-16 Tigard, OR | 2.0 | 1.0 | 900 | $1,575 | $1.75 | 23d | 1 | 0.36mi |
| 17979 SW 115th Ave Unit 6 Tualatin, OR | 2.0 | 1.5 | 1064 | $1,625 | $1.53 | 23d | 1 | 0.41mi |
| 17987 SW 115th Ave Unit 1 Tualatin, OR | 2.0 | 1.0 | 900 | $1,475 | $1.64 | 23d | 1 | 0.46mi |
| 17989 SW 115th Ave Tualatin, OR | 2.0 | 1.0–1.5 | 982 | $1,550 | $1.58 | 23d | 2 | 0.48mi |
| 16849 SW 131st Ave Portland, OR | 2.0 | 2.0 | 1029 | $1,950 | $1.90 | 14d | 1 | 0.49mi |
| 16901 SW 132nd Ter Unit 16915 B Tigard, OR | 1.0 | 1.0 | 714 | $1,695 | $2.37 | 4d | 1 | 0.49mi |
| 13060 SW Dickson St Portland, OR | 2.0 | 2.0 | 1108 | $1,850 | $1.67 | 43d | 1 | 0.55mi |
| 16444 SW 130th Ter King City, OR | 2.0 | 2.0 | 1002 | $1,695 | $1.69 | 43d | 1 | 0.57mi |
| 16055 SW 108th Ave Tigard, OR | 1.0–2.0 | 1.0–2.0 | 852 | $1,940 | $2.28 | 7d | 9 | 1.05mi |
| 13830 SW Chinn Ln Portland, OR | 1.0–3.0 | 1.0–2.0 | 839 | $1,724 | $2.05 | 3d | 11 | 1.05mi |
| 11773 SW King George Dr King City, OR | 1.0–2.0 | 1.0–2.0 | 826 | $2,500 | $3.03 | 11d | 7 | 1.14mi |
| 14495 SW Beef Bend Rd Portland, OR | 1.0–2.0 | 1.0–2.0 | 845 | $1,925 | $2.28 | 4d | 12 | 1.17mi |
| 11390 SW Naeve St Tigard, OR | 1.0–2.0 | 1.0–2.0 | 893 | $2,119 | $2.37 | 3d | 5 | 1.30mi |
| 9720 SW Tualatin Rd Tualatin, OR | 2.0 | 2.0 | 1100 | $1,750 | $1.59 | 43d | 1 | 1.32mi |
| 11545 SW Beef Bend Rd Portland, OR | 2.0 | 2.0 | 935 | $1,514 | $1.62 | 3d | 1 | 1.32mi |
| 15199 SW Royalty Pkwy Portland, OR | 1.0–3.0 | 1.0–2.0 | 884 | $1,805 | $2.04 | 1d | 12 | 1.33mi |
| 11430 SW Bull Mountain Rd Tigard, OR | 2.0 | 2.0 | 986 | $1,970 | $2.00 | 3d | 6 | 1.45mi |
| 14799 SW 109th Ave Unit 5702 Tigard, OR | 2.0 | 2.0 | 986 | $1,745 | $1.77 | 21d | 1 | 1.49mi |
| 14799 SW 109th Ave Unit 3102 Tigard, OR | 2.0 | 2.0 | 986 | $1,695 | $1.72 | 7d | 1 | 1.49mi |
| 14799 SW 109th Ave Unit 2502 Tigard, OR | 2.0 | 2.0 | 986 | $1,645 | $1.67 | 43d | 1 | 1.49mi |
| 14799 SW 109th Ave Unit 7504 Tigard, OR | 2.0 | 2.0 | 986 | $1,575 | $1.60 | 23d | 1 | 1.49mi |
| 14844 SW 109th Ave Portland, OR | 2.0 | 1.5 | 1024 | $1,950 | $1.90 | 43d | 1 | 1.50mi |
Listing history 15 events
-
2026-06-18days on market $165,000 Active 42 DOM
-
2026-06-17days on market $165,000 Active 41 DOM
-
2026-06-16days on market $165,000 Active 40 DOM
-
2026-06-15days on market $165,000 Active 39 DOM
-
2026-06-13days on market $165,000 Active 37 DOM
-
2026-06-09days on market $165,000 Active 33 DOM
-
2026-06-08days on market $165,000 Active 32 DOM
-
2026-06-07days on market $165,000 Active 31 DOM
-
2026-06-05days on market $165,000 Active 28 DOM
-
2026-06-03days on market $165,000 Active 27 DOM
-
2026-06-02days on market $165,000 Active 26 DOM
-
2026-06-01days on market $165,000 Active 25 DOM
-
2026-05-31days on market $165,000 Active 24 DOM
-
2026-05-07$165,000 Active 958-char remark
-
1990-12-13soldstatus $25,900
ⓘ Source: listings_history table (triggers on properties + properties_extension) + one-shot
backfill from property_details.listing_events for pre-trigger history.
Tax reassessment forecast OR · Resets to sale price
- Current annual tax
- $463 · $39/mo
- Projected year-2 tax
- $1,600 · $133/mo
- Expected delta
- +$1,138/yr (+$95/mo · 245.7%)
ⓘ Screening estimate from a state-policy table — verify with the county assessor before closing.
Climate risk First Street
- Flood 1/10 Low FEMA zone X (shaded) · 0% chance over 30 yrs
- Wildfire 4/10 Moderate
- Heat 3/10 Moderate 7 d/yr ≥92°F today · 14 d/yr by 30 yrs out
- Wind 1/10 Low
- Air quality 9/10 Extreme 12 unhealthy d/yr today · 13 by 30 yrs out
Nearby sold comps map
Loading sold comps map…
Walkable amenities ~0.75 mi
Loading nearby amenities…
Taxation est. · year 1
- Rental income
- $21,180
- − Mortgage interest
- −$9,243
- − Property taxes
- −$463
- − Insurance
- −$825
- − Repairs & maintenance
- −$1,694
- − Management
- −$1,694
- − Depreciation
- −$4,800
- Taxable income
- $2,460
- Est. tax owed @ 24.0%
- −$590
- After-tax cash flow
- $4,470/yr
For passive investors: Depreciation is non-cash, so a rental often shows a tax loss while cash-flowing — sheltering income. Rental losses are passive: they offset passive income freely, and up to $25,000/yr can offset ordinary (W-2) income if you actively participate and your MAGI is under $100k (phasing out to $0 by $150k); unused losses carry forward. On sale, claimed depreciation is recaptured at up to 25%, and gains may owe capital-gains tax (a 1031 exchange can defer both). Figures are a year-1 estimate at your 24.0% rate — not tax advice; consult a CPA.
Schools (NCES district)
- District
- Tigard-Tualatin SD 23J
- NCES district ID
- 4112240
- Math proficiency
- 47% ▼ -3.00%
- Reading proficiency
- 65% ▲ 3.00%
- Median HH income
- $60,739
- Composite
- 48.72/100
- National rank
- #2100
- State rank
- #6 of 58 in OR
Livability — King City
- Score
- 85/100
- State rank
- #24
- US rank
- #539
Category grades
Schools grade is shown separately in the Schools card above.
Census & demographics
- County
- Washington County · 583,254 people
- Metro
- Portland-Vancouver-Hillsboro, OR-WA
- Population (ZIP)
- 36,569
- Household income
- $98,125
- Rent vs Own
- Severe rent burden
- 1468.0
Population outlook (Washington County) Hauer SSP2
- Today (2025)
- 674,042 people
- By 2030
- 721,804 · +7.1%
- By 2040
- 812,732 · +20.6%
- By 2050
- 895,143 · +32.8%
- By 2075
- 1,058,806 · +57.1%
- By 2100
- 1,131,692 · +67.9%
Race, ethnicity, and origin ACS 2023
- Neighborhood character
- Predominantly White (73%)
- Race & ethnicity
- White 73% Hispanic / Latino 10% Two or more races 8% Asian 8% Black 3%
- Hispanic origin (detail)
- Mexican 7%
- Common ancestry
- Italian 4% Lithuanian 4% Slovak 3%
- Foreign-born
- 13% · Canada, Vietnam, China
- Languages at home
- 83% English-only · Spanish 7% Other Indo-European 3% Vietnamese 2%
Political lean MEDSL · Washington
- 2024 margin
- Solid D (+34.0) · D 65.3% · R 31.3% · Other 3.4%
- 2008→2024 swing
- +11.8pp toward D · 2008: 22.1pp · 2024: 34.0pp
- All cycles
- 2024: D+34.0 2020: D+34.6 2016: D+26.7 2012: D+17.5 2008: D+22.1
Not yet ingested
- Civics
- —
Market trends
- HPI YoY
- ▼ -287.40%
- Current HPI
- 277.57
- Rent YoY
- ▼ -0.38%
- Metro
- Portland-Vancouver-Hillsboro, OR-WA
- State GDP YoY
- ▲ 2.05%
- F500 in state
- 2
Industry mix (Fortune 500 HQ in OR)
| Industry | F500 HQs | Revenue |
|---|---|---|
| Consumer Goods | 1 | $51B |
|
||
Price history
+537.1% since first listed2 events — show timeline
- 2026-05-07 Listed $165,000 RMLS
- 1990-12-13 Sold (Public Records) $25,900 Public Records
Property tax history
+4.7%/yrLatest (2016): $463 · +51.8% YoY. Source: county tax records.
Cash-flow waterfall
monthlySold comps — $/sqft
last 12 mo · ≤1 miLoading sold comps…