 Duplex
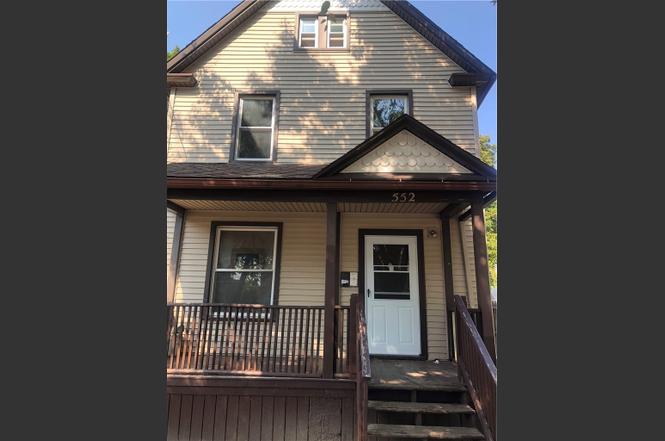
552 Tremont St · Rochester, NY
Flood risk 1/10 · Minimal
- FEMA flood zone
- X (unshaded)
- Chance of flooding over 30 yrs
- 0.0%
- Est. flood insurance / yr
- $473 – $860
Fire risk 1/10 · Minimal
- Est. fire insurance / yr
- $691 – $1,283
Heat risk 2/10 · Minimal
- Hot days now (above 96°F)
- 7 days/yr
- Hot days in 30 yrs
- 15 days/yr
Wind risk 1/10 · Minimal
- Chance of severe wind over 30 yrs
- —
Air-quality risk 2/10 · Minimal
- Unhealthy air days now
- 1 days/yr
- Unhealthy air days in 30 yrs
- 1 days/yr
Risk factors via First Street. Map © Google.
Why this score? — see what drove the B grade
The composite is a weighted blend of 9 inputs, each scored 0–100. Each bar is that input's sub-score; the figure is the points it added to the 100-point composite (weight × sub-score).
- Cash flow +30.0/30.0
- 1% rule +10.0/10.0
- DSCR +10.0/10.0
- ARV discount +7.5/15.0
- Rent growth +4.1/5.0
- Livability +3.8/5.0
- Appreciation +3.5/10.0
- Condition / age +2.5/5.0
- Schools +1.9/10.0
$119,900
🖨 Deal sheet (PDF) 📄 Offer letter ✓ Due diligence
Multi-family units
County records classify this as Multi-Family (2-4 Unit). Listing-text estimate: 2 units. confirmed
Listing remarks MLS
2 Family home with the downstairs vacant. Current rent is $795.00. Security Deposit is also $795.00. Lease began October 1st. Separate utilities for each unit. Each unit is also a 2 bedroom unit. No Delayed Negotiations. On St Parking only. Vinyl sided, with some newer vinyl windows. Downstairs rent is comparable to that of the upstairs. C of O expires 11/1/2025 as per city of Rochester's website
Key facts
- Separate utilities
- Vinyl siding
- Fully occupied
Tags
Neighborhood map
What this means for you Summary
Snapshot
- This is a 2 × 2-bed/1.0-bath units multifamily listed at $120k.
Deal economics
- At list price, monthly cash flow is $2k ($20k/yr) — positive. Per door: $817/mo.
- The deal already cash-flows at list — no discount required.
- Meets the 1% rule at list price ($3k rent vs $120k).
- Recommended offer: $109k (9.0% below list) — sets the bar for market timing.
- Cap rate 22.6% vs local median 9.3% in Rochester — top-decile yield for the area; either an underpriced asset or a hidden risk that comps aren't pricing in. Stress-test before assuming the spread holds.
Location & tenants
- Location reads 76/100 on livability (#222 in NY, #3,482 nationally) — a middle-class / working-renter tenant base. Strengths: commute A+, cost of living A+, housing A+; Watch: schools D+, crime F, employment F.
- Rochester City School District (urban): math 21% / reading 26% proficiency, ranked #589 of 590 in NY (top 100%) — low school quality limits family demand, transient renter base, plan for 1-2y turnover; 82% free/reduced lunch — lower-income household profile, screen leases tightly.
- Market conditions: Rents rising fast (+6.4%/yr); 78 active listings in the ZIP; 40 comparable units currently listed for rent nearby; rentals at typical pace (median 23d on market — plan ~3-4 weeks tenant-placement turnaround); lower-income renter base — watch delinquency; 1,169 units permitted in Monroe County in 2024 (591 in 5+ unit buildings).
- At $2,992/mo this rent would consume 114% of the median local household income ($31k/yr) (locally 2168% of renters already pay >50% of income on rent) — very limited rent-growth headroom before tenants either downsize or default.
Forward outlook
- Local home prices are declining (-2.9%/yr); year-one equity from $829 of loan paydown is wiped out by about $4k of value loss. Plan a longer hold.
- Monroe County population projected to shrink 6% by 2050 — rents likely to lag national; underwrite the cash flow, not the appreciation.
- At projected returns (-2.9% appreciation + 6.4% rent growth), your $34k cash investment doubles in ~2 years — after that, you're playing with house money.
Negotiation context
- It's been on market 120 days — a 9% lower offer ($109k) is reasonable based on typical stale-listing flexibility.
- 5 sale attempts since 12y ago with the ask held roughly flat each time — persistent listings suggest the price (not the market) is what's stuck; bring a comps-based counter.
- Current owner paid $55k; list at $120k implies a 118% gain — meaningful room to come down on a strong offer.
Risks & watch-outs
- Watch-outs: built in 1900 — expect roof / HVAC / electrical / plumbing capex.
Questions for the listing agent
- It's been on market 120 days. Have you received any prior offers? Is the seller open to a 9% concession, seller financing, or rate buy-down credit?
- Can we see the unit-by-unit rent roll, current vacancy, and any below-market leases? What's the average tenancy length?
- What capital expenditures (roof, boiler, parking lot, exteriors) have been made in the last 5 years, and what's planned in the next 2?
- Built in 1900 — when were the roof, HVAC, electrical panel, plumbing, and water heater last replaced?
- Why hasn't it sold? Are there any deal-killer items the seller is aware of (foundation, flood, title, zoning, code violations)?
- Is there a deadline driving the sale (1031 exchange, divorce, estate, relocation)? That informs how much negotiation room exists.
- Schools are D-rated, which usually means shorter tenancies and higher turnover. Who's the typical renter profile here, and what's been the actual vacancy rate?
- Crime grade is F in this area — have there been break-ins, vandalism, or insurance claims at this property in the last 3 years? What carrier currently insures it and at what premium?
- What's the average days-on-market for RENTAL listings here right now (not sales)? A rising rental-DOM trend means longer vacancies and softer asking-rent achievability than the comps imply.
- What's the recent tenant-quality profile in this submarket — average credit score on applications, eviction rate, late-payment / NSF rate, and stable-employment percentage? A property-management company in the area should have these aggregated.
- How much new apartment / multifamily construction is in the pipeline within 1–3 miles? Heavy new supply (>2% of stock underway) typically softens rents 12–24 months out; light construction supports rent growth.
Investment metrics
- 1% rule
- 2.50% ✓
- Cap rate
- 22.65%
- Cash-on-cash
- 58.42%
- DSCR
- 3.60
- GRM
- 3.3
CMA / ARV
No comps found within radius.
Projected returns pro-forma
-2.93% appreciation · 6.37% rent growth · sell at horizon
- IRR
- 60.7%
- Equity multiple
- 3.84×
- Total profit
- $95,476
- Equity at exit
- $18,244
- IRR
- 66.4%
- Equity multiple
- 8.85×
- Total profit
- $263,524
- Equity at exit
- $10,998
Cash invested: $33,572 (down + closing). Projections, not guarantees.
Landlord ↔ Tenant lean methodology
- Overall (STATE)
- 15 Strongly Tenant-Friendly
- State New York
- 15 Strongly Tenant-Friendly · D+10
- County
- — inherits STATE
- City
- — inherits STATE
ZIP-level market 14611
- Home prices YoY
- -1.1%
- Rents YoY
- 6.4%
- Active inventory
- 78
- Price-to-rent
- 6.7×
Monthly cashflow live
- Estimated rent
- $2,992 high interval (Pro) →
- Mortgage (P&I)
- −$629
- Tax from tax record
- −$51 /mo · $608/yr
- Insurance
- −$50
- HOA
- −$0
- Vacancy / Maint / Mgmt
- −$628
- Net cashflow
- $1,634
Break-even live
Sensitivity live
| Price | -10% $1,702 | -5% $1,668 | +0% $1,634 | +5% $1,600 | +10% $1,566 |
|---|---|---|---|---|---|
| Rent | -10% $1,398 | -5% $1,516 | +0% $1,634 | +5% $1,752 | +10% $1,871 |
| Rate | -1.0pp $1,695 | -0.5pp $1,665 | base $1,634 | +0.5pp $1,603 | +1.0pp $1,572 |
2-unit breakdown (identical units grouped — click to expand)
| Units | Beds | Baths | Est. rent |
|---|---|---|---|
| 2× units | 2 | 1 | $2,992 |
| #1 | 2 | 1 | $1,496 |
| #2 | 2 | 1 | $1,496 |
| Total (2 units) | $2,992 | ||
UW: 25.0% down · 7.5% · 30yr · 1.5% tax · 5.0% vac · 8.0% maint · 8.0% mgmt
Financing live
Cash to close
- Down payment
- $29,975
- Closing costs
- $3,597
- Reserves months
- —
- Total cash needed
- —
Loan-product check · same deal, 3 products live
Conventional
25% down · 7.5% · 30yr
- Down + closing
- —
- Monthly P&I
- —
- Monthly cashflow
- —
- DSCR
- —
- Eligible?
- —
Personal DTI + credit; lowest rate.
DSCR
20% down · 8.5% · 30yr
- Down + closing
- —
- Monthly P&I
- —
- Monthly cashflow
- —
- DSCR
- —
- Eligible?
- —
No personal income docs; deal must DSCR.
Hard money
10% down · 12.0% · 12mo
- Down + closing
- —
- Monthly P&I
- —
- Monthly cashflow
- —
- DSCR
- —
- Eligible?
- —
Short-term bridge; refi at stabilization.
Rent comps 40 comps
| Address | Beds | Baths | Sqft | Rent | $/sqft | DOM | Units | Dist |
|---|---|---|---|---|---|---|---|---|
| 478 Tremont St Rochester, NY | 3.0 | 2.0 | 1424 | $1,500 | $1.05 | 44d | 1 | 0.13mi |
| 91 Reynolds St Unit 6 Rochester, NY | 2.0 | 1.0 | 900 | $1,100 | $1.22 | 44d | 1 | 0.24mi |
| 193 Reynolds St Rochester, NY | 3.0 | 1.5 | 1342 | $1,800 | $1.34 | 22d | 1 | 0.32mi |
| 192 Bartlett St Unit 192 Rochester, NY | 3.0 | 1.0 | 1099 | $1,295 | $1.18 | 15d | 1 | 0.35mi |
| 165 Atkinson St #6 Rochester, NY | 2.0 | 1.0 | 925 | $1,150 | $1.24 | 24d | 1 | 0.41mi |
| 249 1/2 Columbia Ave #249 Rochester, NY | 3.0 | 1.0 | 1600 | $1,300 | $0.81 | 15d | 1 | 0.48mi |
| 367 Hawley St Rochester, NY | 4.0 | 1.5 | 1210 | $1,395 | $1.15 | 44d | 1 | 0.50mi |
| 190 Warwick Ave Rochester, NY | 3.0 | 1.5 | 1240 | $1,400 | $1.13 | 44d | 1 | 0.61mi |
| 73 Somerset St Rochester, NY | 4.0 | 1.0 | 1000 | $1,750 | $1.75 | 44d | 1 | 0.73mi |
| 48 Thorndale Ter Rochester, NY | 4.0 | 1.5 | 1700 | $1,400 | $0.82 | 15d | 1 | 0.77mi |
| 629 Jay St Rochester, NY | 3.0 | 1.0 | 1193 | $1,250 | $1.05 | 20d | 1 | 0.84mi |
| 42 S Washington St Rochester, NY | 2.0 | 2.0 | 1298 | $2,300 | $1.77 | 44d | 1 | 0.85mi |
| 42 S Washington St Unit 401 Rochester, NY | 2.0 | 2.0 | 1298 | $2,300 | $1.77 | 24d | 1 | 0.85mi |
| 658 Smith St Rochester, NY | 2.0 | 1.0 | 981 | $1,500 | $1.53 | 4d | 1 | 0.89mi |
| 686 Seward St Rochester, NY | 3.0 | 1.5 | 1166 | $1,600 | $1.37 | 44d | 1 | 0.91mi |
| 710-712 Jay St Unit 3 Rochester, NY | 2.0 | 1.0 | 1252 | $895 | $0.71 | 44d | 1 | 0.91mi |
| 802 Maple St Rochester, NY | 2.0 | 1.5 | 1080 | $1,800 | $1.67 | 44d | 1 | 0.94mi |
| 257 Hague St Unit 257 Rochester, NY | 2.0 | 1.5 | 1080 | $1,500 | $1.39 | 44d | 1 | 0.96mi |
| 385 Ames St Rochester, NY | 3.0 | 1.5 | 1738 | $1,500 | $0.86 | 22d | 1 | 0.96mi |
| 13 S Fitzhugh St Rochester, NY | 1.0–2.0 | 1.5–2.0 | 890 | $2,098 | $2.36 | 11d | 2 | 0.96mi |
| 161 Fillmore St Rochester, NY | 4.0 | 2.0 | 1612 | $1,400 | $0.87 | 15d | 1 | 0.97mi |
| 30 W Broad St Unit 307 Rochester, NY | 2.0 | 1.0 | 911 | $1,950 | $2.14 | 44d | 1 | 1.00mi |
| 290 Exchange Blvd Rochester, NY | 2.0 | 1.0–2.0 | 892 | $2,102 | $2.36 | 3d | 15 | 1.03mi |
| 55 Exchange Blvd Rochester, NY | 2.0 | 1.0–2.0 | 952 | $2,695 | $2.83 | 4d | 28 | 1.05mi |
| 39 State St Rochester, NY | 1.0–2.0 | 1.0–2.5 | 1154 | $3,500 | $3.03 | 4d | 8 | 1.05mi |
| 30 Flanders St Rochester, NY | 3.0 | 1.5 | 1170 | $1,650 | $1.41 | 15d | 1 | 1.12mi |
| 2 Jay St Unit 2 Rochester, NY | 3.0 | 1.0 | 1252 | $1,045 | $0.83 | 44d | 1 | 1.15mi |
| 106 Gregory St Rochester, NY | 3.0 | 1.5 | 1680 | $1,995 | $1.19 | 24d | 1 | 1.15mi |
| 94 Averill Ave Unit 2 Rochester, NY | 2.0 | 1.0 | 1200 | $1,500 | $1.25 | 4d | 1 | 1.16mi |
| 136 Garfield St Rochester, NY | 3.0 | 1.0 | 1152 | $1,200 | $1.04 | 20d | 1 | 1.18mi |
| 132 Anthony St Rochester, NY | 3.0 | 1.0 | 1260 | $1,500 | $1.19 | 4d | 1 | 1.19mi |
| 485 Sawyer St Rochester, NY | 3.0 | 1.0 | 1400 | $1,900 | $1.36 | 3d | 1 | 1.19mi |
| 485 Sawyer St Unit 1 Rochester, NY | 3.0 | 1.0 | 1400 | $1,900 | $1.36 | 44d | 1 | 1.19mi |
| 102 Court St Rochester, NY | 1.0–2.0 | 1.0–2.0 | 952 | $2,570 | $2.70 | 4d | 11 | 1.22mi |
| 144 Flanders St Rochester, NY | 2.0 | 1.0 | 900 | $1,100 | $1.22 | 22d | 1 | 1.24mi |
| 69 Angle St Rochester, NY | 2.0 | 1.0 | 1500 | $1,500 | $1.00 | 15d | 1 | 1.30mi |
| 80 St Paul St Rochester, NY | 1.0–2.0 | 1.5–2.5 | 1024 | $1,935 | $1.89 | 4d | 3 | 1.31mi |
| 183 E Main St Rochester, NY | 1.0–2.0 | 1.0 | 1142 | $2,870 | $2.51 | 11d | 28 | 1.34mi |
| 85 Cameron St Unit B Rochester, NY | 3.0 | 1.0 | 1138 | $1,650 | $1.45 | 44d | 1 | 1.36mi |
| 194 E Main St Rochester, NY | 1.0–2.0 | 1.0–2.0 | 875 | $2,095 | $2.39 | 15d | 1 | 1.36mi |
Listing history 17 events
-
2026-02-20status Pending
-
2026-02-19historical Active Under Contract
-
2025-10-22$119,900 Active
-
2025-09-29historical
-
2025-09-05$137,900 Active
-
2024-02-01soldstatus $55,000 Closed 399-char remark
Show marketing remark (399 chars)
2 Family home with the downstairs vacant. Current rent is $795.00. Security Deposit is also $795.00. Lease began October 1st. Separate utilities for each unit. Each unit is also a 2 bedroom unit. No Delayed Negotiations. On St Parking only. Vinyl sided, with some newer vinyl windows. Downstairs rent is comparable to that of the upstairs. C of O expires 11/1/2025 as per city of Rochester's website
-
2024-01-29soldstatus $55,000
-
2023-12-27status Pending 399-char remark
Show marketing remark (399 chars)
2 Family home with the downstairs vacant. Current rent is $795.00. Security Deposit is also $795.00. Lease began October 1st. Separate utilities for each unit. Each unit is also a 2 bedroom unit. No Delayed Negotiations. On St Parking only. Vinyl sided, with some newer vinyl windows. Downstairs rent is comparable to that of the upstairs. C of O expires 11/1/2025 as per city of Rochester's website
-
2023-11-06status Pending Sale 399-char remark
Show marketing remark (399 chars)
2 Family home with the downstairs vacant. Current rent is $795.00. Security Deposit is also $795.00. Lease began October 1st. Separate utilities for each unit. Each unit is also a 2 bedroom unit. No Delayed Negotiations. On St Parking only. Vinyl sided, with some newer vinyl windows. Downstairs rent is comparable to that of the upstairs. C of O expires 11/1/2025 as per city of Rochester's website
-
2023-11-02$55,000 Active 399-char remark
Show marketing remark (399 chars)
2 Family home with the downstairs vacant. Current rent is $795.00. Security Deposit is also $795.00. Lease began October 1st. Separate utilities for each unit. Each unit is also a 2 bedroom unit. No Delayed Negotiations. On St Parking only. Vinyl sided, with some newer vinyl windows. Downstairs rent is comparable to that of the upstairs. C of O expires 11/1/2025 as per city of Rochester's website
-
2023-09-18historical $795
-
2023-08-17$795
-
2015-04-20soldstatus $42,000
-
2015-04-15soldstatus $42,000
-
2014-12-23$45,000
-
2012-08-17soldstatus $30,000
-
2005-07-29soldstatus $18,000
ⓘ Source: listings_history table (triggers on properties + properties_extension) + one-shot
backfill from property_details.listing_events for pre-trigger history.
Tax reassessment forecast NY · Partial reset (capped growth)
- Current annual tax
- $608 · $51/mo
- Projected year-2 tax
- $1,317 · $110/mo
- Expected delta
- +$709/yr (+$59/mo · 116.6%)
ⓘ Screening estimate from a state-policy table — verify with the county assessor before closing.
Climate risk First Street
- Flood 1/10 Low FEMA zone X (unshaded) · 0% chance over 30 yrs
- Wildfire 1/10 Low
- Heat 2/10 Low 7 d/yr ≥96°F today · 15 d/yr by 30 yrs out
- Wind 1/10 Low
- Air quality 2/10 Low 1 unhealthy d/yr today · 1 by 30 yrs out
Nearby sold comps map
Loading sold comps map…
Walkable amenities ~0.75 mi
Loading nearby amenities…
Taxation est. · year 1
- Rental income
- $35,904
- − Mortgage interest
- −$6,716
- − Property taxes
- −$608
- − Insurance
- −$600
- − Repairs & maintenance
- −$2,872
- − Management
- −$2,872
- − Depreciation
- −$3,488
- Taxable income
- $18,748
- Est. tax owed @ 24.0%
- −$4,499
- After-tax cash flow
- $15,112/yr
For passive investors: Depreciation is non-cash, so a rental often shows a tax loss while cash-flowing — sheltering income. Rental losses are passive: they offset passive income freely, and up to $25,000/yr can offset ordinary (W-2) income if you actively participate and your MAGI is under $100k (phasing out to $0 by $150k); unused losses carry forward. On sale, claimed depreciation is recaptured at up to 25%, and gains may owe capital-gains tax (a 1031 exchange can defer both). Figures are a year-1 estimate at your 24.0% rate — not tax advice; consult a CPA.
Schools (NCES district)
- District
- Rochester City School District
- NCES district ID
- 3624750
- Math proficiency
- 21% ▬ 0.00%
- Reading proficiency
- 26% ▲ 4.00%
- Median HH income
- $30,923
- Composite
- 18.98/100
- National rank
- #8850
- State rank
- #589 of 590 in NY
Livability — Rochester
- Score
- 76/100
- State rank
- #222
- US rank
- #3482
Category grades
Schools grade is shown separately in the Schools card above.
Census & demographics
- Census place
- Rochester, NY
- County
- Monroe County · 674,131 people
- City population
- 432,803
- Metro
- Rochester, NY
- Population (ZIP)
- 17,145
- Household income
- $31,376
- Rent vs Own
- Severe rent burden
- 2168.0
Population outlook (Monroe County) Hauer SSP2
- Today (2025)
- 759,460 people
- By 2030
- 757,154 · -0.3%
- By 2040
- 740,644 · -2.5%
- By 2050
- 714,443 · -5.9%
- By 2075
- 645,883 · -15.0%
- By 2100
- 547,084 · -28.0%
Race, ethnicity, and origin ACS 2023
- Neighborhood character
- Diverse neighborhood (Simpson 0.61)
- Race & ethnicity
- Black 55% White 22% Hispanic / Latino 18% Two or more races 13% Asian 1%
- Hispanic origin (detail)
- Puerto Rican 14% Dominican 2%
- Common ancestry
- Romanian 1% Lithuanian 1% Slovak 1%
- Foreign-born
- 3% · Canada
- Languages at home
- 85% English-only · Spanish 12% French/Haitian/Cajun 1% Other Indo-European 1%
Political lean MEDSL · Monroe
- 2024 margin
- D (+19.1) · D 59.5% · R 40.5%
- 2008→2024 swing
- +1.4pp toward D · 2008: 17.7pp · 2024: 19.1pp
- All cycles
- 2024: D+19.1 2020: D+21.0 2016: D+14.1 2012: D+17.4 2008: D+17.7
Not yet ingested
- Civics
- —
Market trends
- HPI YoY
- ▼ -2.93%
- Current HPI
- 262.1549
- Rent YoY
- ▲ 6.37%
- Metro
- Rochester, NY
- State GDP YoY
- ▲ 2.60%
- F500 in state
- 92
Industry mix (Fortune 500 HQ in NY)
| Industry | F500 HQs | Revenue |
|---|---|---|
| Financial Services | 10 | $950B |
|
||
| Consumer Goods | 9 | $162B |
|
||
| Insurance | 4 | $225B |
|
||
| Telecommunications | 2 | $144B |
|
||
| Pharmaceuticals | 2 | $112B |
|
||
| Media / Entertainment | 2 | $69B |
|
||
Price history
+566.1% since first listed17 events — show timeline
- 2026-02-20 Pending — UNYREIS
- 2026-02-19 Contingent — UNYREIS
- 2025-10-22 Listed $119,900 UNYREIS
- 2025-09-29 Listing Removed — UNYREIS
- 2025-09-05 Listed $137,900 UNYREIS
- 2024-02-01 Sold (MLS) $55,000 UNYREIS
- 2024-01-29 Sold (Public Records) $55,000 Public Records
- 2023-12-27 Pending — UNYREIS
- 2023-11-06 Pending — UNYREIS
- 2023-11-02 Listed $55,000 UNYREIS
- 2023-09-18 Rental Removed $795 RENTEC
- 2023-08-17 Listed for Rent $795 RENTEC
- 2015-04-20 Sold (MLS) $42,000 UNYREIS
- 2015-04-15 Sold (Public Records) $42,000 Public Records
- 2014-12-23 Listed $45,000 UNYREIS
- 2012-08-17 Sold (Public Records) $30,000 Public Records
- 2005-07-29 Sold (Public Records) $18,000 Public Records
Property tax history
+1.1%/yrLatest (2025): $608 · +0.0% YoY. Source: county tax records.
Cash-flow waterfall
monthlySold comps — $/sqft
last 12 mo · ≤1 miLoading sold comps…