356 Baker Island Rd · Fort Chiswell, VA
Flood risk 1/10 · Minimal
- FEMA flood zone
- X (unshaded)
- Chance of flooding over 30 yrs
- 0.0%
- Est. flood insurance / yr
- $473 – $860
Fire risk 4/10 · Minor
- Est. fire insurance / yr
- $666 – $1,236
Heat risk 3/10 · Minor
- Hot days now (above 94°F)
- 7 days/yr
- Hot days in 30 yrs
- 20 days/yr
Wind risk 2/10 · Minimal
- Chance of severe wind over 30 yrs
- 1.0%
Air-quality risk 1/10 · Minimal
- Unhealthy air days now
- 0 days/yr
- Unhealthy air days in 30 yrs
- 0 days/yr
Risk factors via First Street. Map © Google.
Why this score? — see what drove the C grade
The composite is a weighted blend of 9 inputs, each scored 0–100. Each bar is that input's sub-score; the figure is the points it added to the 100-point composite (weight × sub-score).
- Cash flow +23.1/30.0
- ARV discount +7.5/15.0
- DSCR +7.4/10.0
- Schools +6.0/10.0
- 1% rule +5.1/10.0
- Livability +2.8/5.0
- Rent growth +2.5/5.0
- Condition / age +2.5/5.0
- Appreciation +0.0/10.0
$120,000
🖨 Deal sheet (PDF) 📄 Offer letter ✓ Due diligence
Listing remarks
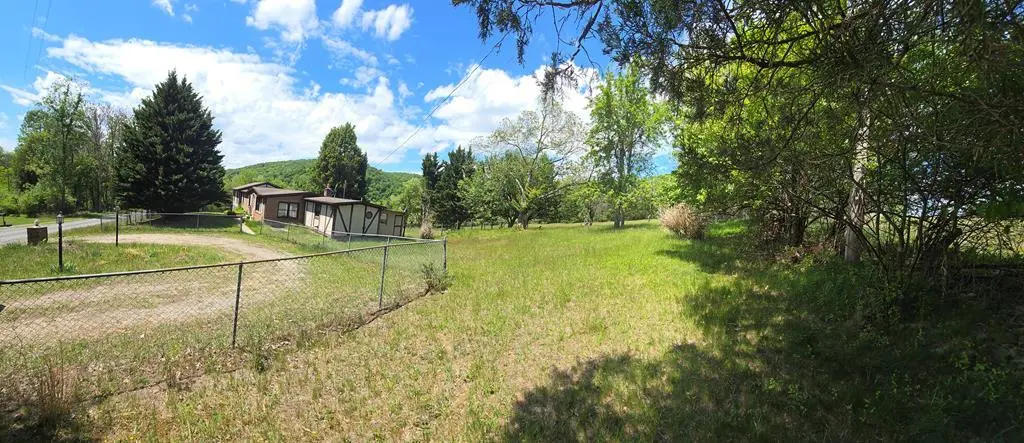
Looking for a country home with privacy and room to make it your own? This spacious home may be the one! Situated in a peaceful setting, this property offers plenty of potential and room to grow. The home is in need of some updating, but the size, layout, and possibilities make it a great opportunity. Inside, you'll find generous living space, an unfinished basement, and several additional flex rooms that could be used as a home office, playroom, hobby space, guest area, storage, or whatever best fits your needs. Bring your ideas and vision — this country property is ready for its next chapter! This property is located very near New River and the New river trail.
Key facts
- Unfinished basement
- Flex rooms
- 3 acre lot
Tags
Property features AI
Exterior
- Parking: 1-car garage
- Utilities: Private well water; Septic tank
- Home design: Manufactured single-family residence; One story
- Construction: Brick construction; Shingle roof
- Exterior features: Level lot
Interior
- Kitchen: Dishwasher; Refrigerator
- Flooring: Laminate flooring
- Bathrooms: 3 full bathrooms
- Heating & cooling: Baseboard heating
- Interior features: Basement; Deck
Neighborhood map
What this means for you Summary
Snapshot
- This is a 3-bed/3.0-bath single-family listed at $120k.
Deal economics
- At list price, monthly cash flow is $215 ($3k/yr) — positive.
- The deal already cash-flows at list — no discount required.
- Meets the 1% rule at list price ($1k rent vs $120k).
- Cap rate 8.4% vs local median 3.6% in Fort Chiswell — top-decile yield for the area; either an underpriced asset or a hidden risk that comps aren't pricing in. Stress-test before assuming the spread holds.
Location & tenants
- Location reads 56/100 on livability (#511 in VA) — a working-class tenant base; expect higher turnover. Strengths: cost of living A+; Watch: employment C-, crime D+, amenities F.
- Wythe County Public School District (rural): math 67% / reading 77% proficiency, ranked #20 of 131 in VA (top 15%) — strong family-tenant draw, lease renewals of 3-5y typical.
- Zoned schools: Jackson Memorial Elementary (math 57% / reading 67%, grade B, #480 of 1,108 statewide, top 46%, 212 students, 74% FRL); Fort Chiswell Middle (math 70% / reading 83%, grade A, #40 of 342 statewide, top 12%, 316 students, 74% FRL); Fort Chiswell High (math 52% / reading 72%, grade B-, #231 of 319 statewide, top 75%, 435 students, 73% FRL) — zoned schools average 74% FRL vs 41% district-wide (33 pts higher); higher-poverty schools than district average — tighter screening recommended.
- Market conditions: 50 active listings in the ZIP; 63 units permitted in Wythe County in 2024 (12 in 5+ unit buildings).
Forward outlook
- Local home prices are declining (-3.0%/yr); year-one equity from $830 of loan paydown is wiped out by about $4k of value loss. Plan a longer hold.
- Wythe County population projected to shrink 7% by 2050 — rents likely to lag national; underwrite the cash flow, not the appreciation.
Negotiation context
- Only 5 days on market — expect competitive offers; lowballing is unlikely to land.
Questions for the listing agent
- Built in 1974 — when were the roof, HVAC, electrical panel, plumbing, and water heater last replaced?
- Is there a deadline driving the sale (1031 exchange, divorce, estate, relocation)? That informs how much negotiation room exists.
- Schools are F-rated, which usually means shorter tenancies and higher turnover. Who's the typical renter profile here, and what's been the actual vacancy rate?
- Crime grade is D in this area — have there been break-ins, vandalism, or insurance claims at this property in the last 3 years? What carrier currently insures it and at what premium?
- What's the average days-on-market for RENTAL listings here right now (not sales)? A rising rental-DOM trend means longer vacancies and softer asking-rent achievability than the comps imply.
- What's the recent tenant-quality profile in this submarket — average credit score on applications, eviction rate, late-payment / NSF rate, and stable-employment percentage? A property-management company in the area should have these aggregated.
- How much new for-sale + rental construction is in the pipeline within 1–3 miles? Heavy new supply typically softens prices + rents 12–24 months out; constrained supply supports both.
Investment metrics
- 1% rule
- 1.01% ✓
- Cap rate
- 8.45%
- Cash-on-cash
- 7.69%
- DSCR
- 1.34
- GRM
- 8.2
CMA / ARV
No comps found within radius.
Projected returns pro-forma
-3.0% appreciation · 3.0% rent growth · sell at horizon
- IRR
- -4.6%
- Equity multiple
- 0.83×
- Total profit
- $-5,769
- Equity at exit
- $17,892
- IRR
- 5.1%
- Equity multiple
- 1.37×
- Total profit
- $12,495
- Equity at exit
- $10,375
Cash invested: $33,600 (down + closing). Projections, not guarantees.
Landlord ↔ Tenant lean methodology
- Overall (STATE)
- 55 Moderately Landlord-Leaning
- State Virginia
- 55 Moderately Landlord-Leaning · D+2
- County
- — inherits STATE
- City
- — inherits STATE
ZIP-level market 24360
- Home prices YoY
- -9.2%
- Active inventory
- 50
- Price-to-rent
- 8.2×
Monthly cashflow live
- Estimated rent
- $1,217 medium interval (Pro) →
- Mortgage (P&I)
- −$629
- Tax from tax record
- −$67 /mo · $802/yr
- Insurance
- −$50
- HOA
- −$0
- Vacancy / Maint / Mgmt
- −$256
- Net cashflow
- $215
Break-even live
Sensitivity live
| Price | -10% $283 | -5% $249 | +0% $215 | +5% $181 | +10% $147 |
|---|---|---|---|---|---|
| Rent | -10% $119 | -5% $167 | +0% $215 | +5% $263 | +10% $311 |
| Rate | -1.0pp $276 | -0.5pp $246 | base $215 | +0.5pp $184 | +1.0pp $153 |
UW: 25.0% down · 7.5% · 30yr · 1.5% tax · 5.0% vac · 8.0% maint · 8.0% mgmt
Financing live
Cash to close
- Down payment
- $30,000
- Closing costs
- $3,600
- Reserves months
- —
- Total cash needed
- —
Loan-product check · same deal, 3 products live
Conventional
25% down · 7.5% · 30yr
- Down + closing
- —
- Monthly P&I
- —
- Monthly cashflow
- —
- DSCR
- —
- Eligible?
- —
Personal DTI + credit; lowest rate.
DSCR
20% down · 8.5% · 30yr
- Down + closing
- —
- Monthly P&I
- —
- Monthly cashflow
- —
- DSCR
- —
- Eligible?
- —
No personal income docs; deal must DSCR.
Hard money
10% down · 12.0% · 12mo
- Down + closing
- —
- Monthly P&I
- —
- Monthly cashflow
- —
- DSCR
- —
- Eligible?
- —
Short-term bridge; refi at stabilization.
Listing history 2 events
-
2026-05-15status Pending
-
2026-05-10$120,000 Active
ⓘ Source: listings_history table (triggers on properties + properties_extension) + one-shot
backfill from property_details.listing_events for pre-trigger history.
Tax reassessment forecast VA · Resets to sale price
- Current annual tax
- $802 · $67/mo
- Projected year-2 tax
- $984 · $82/mo
- Expected delta
- +$182/yr (+$15/mo · 22.7%)
ⓘ Screening estimate from a state-policy table — verify with the county assessor before closing.
Climate risk First Street
- Flood 1/10 Low FEMA zone X (unshaded) · 0% chance over 30 yrs
- Wildfire 4/10 Moderate
- Heat 3/10 Moderate 7 d/yr ≥94°F today · 20 d/yr by 30 yrs out
- Wind 2/10 Low 100% chance of damaging wind over 30 yrs
- Air quality 1/10 Low 0 unhealthy d/yr today · 0 by 30 yrs out
Nearby sold comps map
Loading sold comps map…
Walkable amenities ~0.75 mi
Loading nearby amenities…
Taxation est. · year 1
- Rental income
- $14,603
- − Mortgage interest
- −$6,722
- − Property taxes
- −$802
- − Insurance
- −$600
- − Repairs & maintenance
- −$1,168
- − Management
- −$1,168
- − Depreciation
- −$3,491
- Taxable income
- $652
- Est. tax owed @ 24.0%
- −$156
- After-tax cash flow
- $2,426/yr
For passive investors: Depreciation is non-cash, so a rental often shows a tax loss while cash-flowing — sheltering income. Rental losses are passive: they offset passive income freely, and up to $25,000/yr can offset ordinary (W-2) income if you actively participate and your MAGI is under $100k (phasing out to $0 by $150k); unused losses carry forward. On sale, claimed depreciation is recaptured at up to 25%, and gains may owe capital-gains tax (a 1031 exchange can defer both). Figures are a year-1 estimate at your 24.0% rate — not tax advice; consult a CPA.
Schools (NCES district)
- District
- Wythe County Public School District
- NCES district ID
- 5104110
- Math proficiency
- 67% ▼ -23.00%
- Reading proficiency
- 77% ▼ -9.00%
- Median HH income
- $41,665
- Composite
- 60.19/100
- National rank
- #863
- State rank
- #20 of 131 in VA
Livability — Fort Chiswell
- Score
- 56/100
- State rank
- #511
- US rank
- #22932
Category grades
Schools grade is shown separately in the Schools card above.
Census & demographics
- City population
- 5,647
- Population (ZIP)
- 5,647
Population outlook (Wythe County) Hauer SSP2
- Today (2025)
- 29,176 people
- By 2030
- 28,993 · -0.6%
- By 2040
- 28,273 · -3.1%
- By 2050
- 27,055 · -7.3%
- By 2075
- 23,668 · -18.9%
- By 2100
- 18,904 · -35.2%
Race, ethnicity, and origin ACS 2023
- Neighborhood character
- Predominantly White (97%)
- Race & ethnicity
- White 97% Black 1%
- Common ancestry
- Italian 3% Serbian 1% Lithuanian 1%
- Foreign-born
- 1% · China
- Languages at home
- 99% English-only · French/Haitian/Cajun 1%
Political lean MEDSL · Wythe
- 2024 margin
- Solid R (+59.5) · D 19.9% · R 79.5%
- 2008→2024 swing
- -26.7pp toward R · 2008: -32.8pp · 2024: -59.5pp
- All cycles
- 2024: R+59.5 2020: R+57.0 2016: R+54.9 2012: R+36.8 2008: R+32.8
Not yet ingested
- Civics
- —
Market trends
- HPI YoY
- ▼ -18.93%
- Current HPI
- 186.8843
- Rent YoY
- —
- Metro
- —
- State GDP YoY
- ▲ 2.40%
- F500 in state
- 50
Industry mix (Fortune 500 HQ in VA)
| Industry | F500 HQs | Revenue |
|---|---|---|
| Aerospace / Defense | 4 | $236B |
|
||
| Technology / Defense | 3 | $32B |
|
||
| Financial Services | 2 | $176B |
|
||
| Utilities | 2 | $27B |
|
||
| Insurance | 2 | $25B |
|
||
| Technology | 2 | $15B |
|
||
Price history
2 events — show timeline
- 2026-05-15 Pending — SWVAR
- 2026-05-10 Listed $120,000 SWVAR
Property tax history
+4.2%/yrLatest (2025): $802 · +0.0% YoY. Source: county tax records.
Cash-flow waterfall
monthlySold comps — $/sqft
last 12 mo · ≤1 miLoading sold comps…