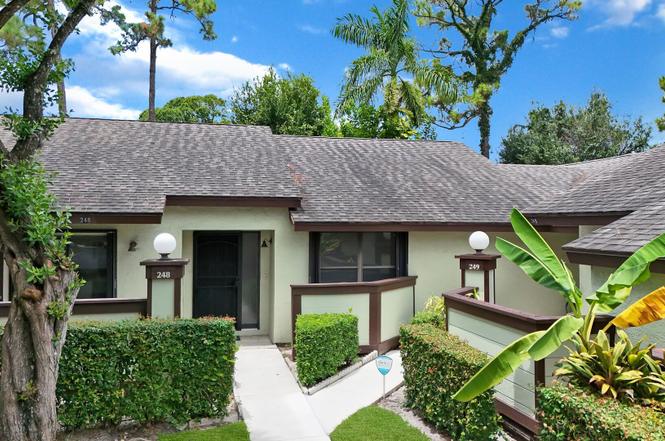
248 Brandywine Ct · Royal Palm Beach, FL
Flood risk 1/10 · Minimal
- FEMA flood zone
- X (unshaded)
- Chance of flooding over 30 yrs
- 0.0%
- Est. flood insurance / yr
- $507 – $1,088
Fire risk 3/10 · Minor
- Est. fire insurance / yr
- $947 – $1,759
Heat risk 10/10 · Severe
- Hot days now (above 107°F)
- 7 days/yr
- Hot days in 30 yrs
- 26 days/yr
Wind risk 10/10 · Severe
- Chance of severe wind over 30 yrs
- 99.0%
Air-quality risk 2/10 · Minimal
- Unhealthy air days now
- 0 days/yr
- Unhealthy air days in 30 yrs
- 1 days/yr
Risk factors via First Street. Map © Google.
Why this score? — see what drove the C+ grade
The composite is a weighted blend of 9 inputs, each scored 0–100. Each bar is that input's sub-score; the figure is the points it added to the 100-point composite (weight × sub-score).
- Cash flow +17.1/30.0
- Appreciation +10.0/10.0
- ARV discount +7.5/15.0
- 1% rule +7.0/10.0
- DSCR +5.3/10.0
- Schools +4.3/10.0
- Livability +4.0/5.0
- Rent growth +2.7/5.0
- Condition / age +2.5/5.0
$211,000
🖨 Deal sheet (PDF) 📄 Offer letter ✓ Due diligence
Listing remarks
Welcome to 248 Brandywine Ct, a charming and well-maintained home in the heart of Royal Palm Beach! This 2-bedroom, 2-bathroom residence features fresh interior paint, brand-new carpeting in the bedrooms, and bamboo wood floors, offering a clean and move-in-ready feel. A spacious bonus room provides the perfect opportunity for a potential 3rd bedroom, home office, or den. Accordion shutters offer added peace of mind with easy storm protection. Loads of closet space, lots of storage. Ideally located near dining, shopping, and entertainment, this home combines comfort, convenience, and value. Don't miss out on this incredible opportunity!
Key facts
- Accordion shutters
- Spacious bonus room
- Bamboo wood floors
Tags
Property features AI
Finance
- Financial info: Pets allowed with possible restrictions (breed and size limits)
- HOA & community: Homeowners association with onsite manager; Monthly HOA fee; Community amenities include clubhouse, fitness center, pool, community room, and library; HOA covers cable TV, insurance, grounds maintenance, pest control, trash, and common areas
Exterior
- Parking: Assigned parking; Guest parking
- Security: Smoke detectors
- Utilities: Public water; Public sewer; Three-phase electric service; Cable available
- Home design: Villa; Single-story; Entry level living area; East-facing
- Construction: Frame and stucco construction; Composition/shingle roof; Built as resale property
- Exterior features: Screened patio; Open patio; Not waterfront
Interior
- Kitchen: Dishwasher; Electric range; Refrigerator
- Bedrooms: 2 bedrooms on the main level
- Flooring: Carpet; Ceramic tile; Wood
- Bathrooms: 2 full bathrooms (main level)
- Heating & cooling: Central heating; Central air conditioning; Ceiling fans
- Interior features: Walk-in closets; Unfurnished
- Laundry & utility: Laundry inside the unit
Neighborhood map
What this means for you Summary
Snapshot
- This is a 3-bed/2.0-bath townhouse listed at $211k.
Deal economics
- At list price, monthly cash flow is $148 ($2k/yr) — positive.
- The deal already cash-flows at list — no discount required.
- Meets the 1% rule at list price ($3k rent vs $211k).
- Recommended offer: $186k (12.0% below list) — sets the bar for market timing.
Location & tenants
- Location reads 79/100 on livability (#135 in FL, #2,039 nationally) — a middle-class / working-renter tenant base. Strengths: employment A+, housing A+, health & safety A+; Watch: cost of living C-, amenities F, commute F.
- Palm Beach (suburban): math 46% / reading 53% proficiency, ranked #34 of 73 in FL (top 47%) — families likely to look elsewhere, expect single-tenant / working-renter base with shorter leases.
- Zoned schools: Cypress Trails Elementary School (math 52% / reading 62%, grade C+, #781 of 2,144 statewide, top 38%, 492 students, 53% FRL); Crestwood Community Middle (math 49% / reading 52%, grade C, #246 of 571 statewide, top 44%, 724 students, 50% FRL); Royal Palm Beach High School (math 22% / reading 38%, grade F, #441 of 667 statewide, top 67%, 2,343 students, 57% FRL) — zoned schools at 54% FRL track the district average.
- Market conditions: Rents flat; 583 active listings in the ZIP; 40 comparable units currently listed for rent nearby; rentals at typical pace (median 21d on market — plan ~3-4 weeks tenant-placement turnaround); solid renter incomes; 3,974 units permitted in Palm Beach County in 2024 (1,012 in 5+ unit buildings).
Forward outlook
- In year one you build about $23k of equity ($1k loan paydown + $21k appreciation (10.0% local appreciation)).
- Palm Beach County population projected at +30% by 2050 — long-run rental-demand tailwind backs the buy-and-hold thesis.
- At projected returns (10.0% appreciation + 0.8% rent growth), your $59k cash investment doubles in ~3 years — after that, you're playing with house money.
- By year 2, paydown + projected appreciation supports a ~$36k cash-out refi (75% LTV) — recoverable capital for the next deal without selling this one.
Negotiation context
- It's been on market 313 days — a 12% lower offer ($186k) is reasonable based on typical stale-listing flexibility.
- 2 sale attempts; this cycle's ask has dropped $39k (16%) from the opening price — seller is motivated, your offer sets the floor, not the list.
- Current owner paid $81k; list at $211k implies a 160% gain — meaningful room to come down on a strong offer.
Risks & watch-outs
- Watch-outs: HOA is 21% of rent.
- Climate carrying-cost: severe wind risk, 99% chance of damaging wind over 30y; extreme-heat days projected 7→26/yr by 2055 (HVAC capex compounding) — expect insurance premiums to compound above CPI over the hold.
Questions for the listing agent
- It's been on market 313 days. Have you received any prior offers? Is the seller open to a 12% concession, seller financing, or rate buy-down credit?
- What does the HOA fee cover, when was the last increase, and are there any pending special assessments or reserve-fund shortfalls?
- Why hasn't it sold? Are there any deal-killer items the seller is aware of (foundation, flood, title, zoning, code violations)?
- Is there a deadline driving the sale (1031 exchange, divorce, estate, relocation)? That informs how much negotiation room exists.
- Schools are B-rated — typically a magnet for longer-tenancy family renters. What's the average tenant stay here, and is there a school-zone premium baked into asking?
- What's the average days-on-market for RENTAL listings here right now (not sales)? A rising rental-DOM trend means longer vacancies and softer asking-rent achievability than the comps imply.
- What's the recent tenant-quality profile in this submarket — average credit score on applications, eviction rate, late-payment / NSF rate, and stable-employment percentage? A property-management company in the area should have these aggregated.
- How much new for-sale + rental construction is in the pipeline within 1–3 miles? Heavy new supply typically softens prices + rents 12–24 months out; constrained supply supports both.
Investment metrics
- 1% rule
- 1.20% ✓
- Cap rate
- 7.13%
- Cash-on-cash
- 3.00%
- DSCR
- 1.13
- GRM
- 6.9
CMA / ARV
No comps found within radius.
Projected returns pro-forma
10.0% appreciation · 0.85% rent growth · sell at horizon
- IRR
- 25.5%
- Equity multiple
- 3.02×
- Total profit
- $119,234
- Equity at exit
- $190,086
- IRR
- 21.8%
- Equity multiple
- 6.66×
- Total profit
- $334,303
- Equity at exit
- $409,927
Cash invested: $59,080 (down + closing). Projections, not guarantees.
Landlord ↔ Tenant lean methodology
- Overall (STATE)
- 87 Strongly Landlord-Friendly
- State Florida
- 87 Strongly Landlord-Friendly · R+3
- County
- — inherits STATE
- City
- — inherits STATE
ZIP-level market 33411
- Home prices YoY
- 1.9%
- Rents YoY
- 0.8%
- Active inventory
- 583
- Price-to-rent
- 6.9×
Monthly cashflow live
- Estimated rent
- $2,540 high interval (Pro) →
- Mortgage (P&I)
- −$1,107
- Tax from tax record
- −$139 /mo · $1,671/yr
- Insurance
- −$88
- HOA
- −$525
- Vacancy / Maint / Mgmt
- −$533
- Net cashflow
- $148
Break-even live
Sensitivity live
| Price | -10% $267 | -5% $207 | +0% $148 | +5% $88 | +10% $28 |
|---|---|---|---|---|---|
| Rent | -10% $-53 | -5% $47 | +0% $148 | +5% $248 | +10% $348 |
| Rate | -1.0pp $254 | -0.5pp $201 | base $148 | +0.5pp $93 | +1.0pp $37 |
UW: 25.0% down · 7.5% · 30yr · 1.5% tax · 5.0% vac · 8.0% maint · 8.0% mgmt
Financing live
Cash to close
- Down payment
- $52,750
- Closing costs
- $6,330
- Reserves months
- —
- Total cash needed
- —
Loan-product check · same deal, 3 products live
Conventional
25% down · 7.5% · 30yr
- Down + closing
- —
- Monthly P&I
- —
- Monthly cashflow
- —
- DSCR
- —
- Eligible?
- —
Personal DTI + credit; lowest rate.
DSCR
20% down · 8.5% · 30yr
- Down + closing
- —
- Monthly P&I
- —
- Monthly cashflow
- —
- DSCR
- —
- Eligible?
- —
No personal income docs; deal must DSCR.
Hard money
10% down · 12.0% · 12mo
- Down + closing
- —
- Monthly P&I
- —
- Monthly cashflow
- —
- DSCR
- —
- Eligible?
- —
Short-term bridge; refi at stabilization.
Rent comps 40 comps
| Address | Beds | Baths | Sqft | Rent | $/sqft | DOM | Units | Dist |
|---|---|---|---|---|---|---|---|---|
| 263 Deerfield Ct Royal Palm Beach, FL | 2.0 | 2.0 | 1120 | $1,800 | $1.61 | 26d | 1 | 0.12mi |
| 132 Weybridge Cir Royal Palm Beach, FL | 2.0 | 2.5 | 1470 | $3,000 | $2.04 | 26d | 1 | 0.24mi |
| 111 Weybridge Cir Royal Palm Beach, FL | 3.0 | 2.5 | 1710 | $3,100 | $1.81 | 7d | 1 | 0.25mi |
| 110 Weybridge Cir Unit A Royal Palm Beach, FL | 2.0 | 2.5 | 1470 | $2,350 | $1.60 | 24d | 1 | 0.37mi |
| 202 Lakeside Landing Dr Royal Palm Beach, FL | 3.0 | 2.5 | 1532 | $3,200 | $2.09 | 6d | 1 | 0.50mi |
| 73 Macadamia Ct Royal Palm Beach, FL | 2.0 | 2.0 | 1112 | $2,000 | $1.80 | 13d | 1 | 0.53mi |
| 4 Greenway Vlg N #203 Royal Palm Beach, FL | 2.0 | 2.0 | 1080 | $2,000 | $1.85 | 26d | 1 | 0.76mi |
| 139 Sparrow Dr Royal Palm Beach, FL | 2.0–3.0 | 1.5–2.5 | 1100 | $2,390 | $2.17 | 17d | 3 | 0.76mi |
| 100 Sparrow Dr #2 Royal Palm Beach, FL | 3.0 | 2.0 | 1824 | $2,725 | $1.49 | 20d | 1 | 0.78mi |
| 7 Greenway Vlg N Royal Palm Beach, FL | 1.0–2.0 | 1.5–2.0 | 930 | $1,700 | $1.83 | 19d | 2 | 0.80mi |
| 2 Greenway Vlg N #210 Royal Palm Beach, FL | 2.0 | 2.0 | 1080 | $2,000 | $1.85 | 26d | 1 | 0.82mi |
| 180 Heatherwood Dr Royal Palm Beach, FL | 3.0 | 2.0 | 1462 | $2,710 | $1.85 | 7d | 1 | 0.83mi |
| 100 Sparrow Dr #14 Royal Palm Beach, FL | 3.0 | 2.0 | 1737 | $2,725 | $1.57 | 26d | 1 | 0.84mi |
| 1601 Lakeview Dr W Unit 1601 Royal Palm Beach, FL | 3.0 | 2.5 | 1296 | $2,375 | $1.83 | 24d | 1 | 0.87mi |
| 12002 Poinciana Blvd #204 Royal Palm Beach, FL | 2.0 | 2.0 | 1048 | $1,750 | $1.67 | 26d | 1 | 0.88mi |
| 43 Essex Ct Unit A Royal Palm Beach, FL | 2.0 | 2.5 | 1398 | $2,500 | $1.79 | 26d | 1 | 0.89mi |
| 36 Danbury Ct Unit B Royal Palm Beach, FL | 2.0 | 2.5 | 1398 | $2,300 | $1.65 | 13d | 1 | 0.90mi |
| 1407 Lakeview Dr E Royal Palm Beach, FL | 2.0 | 2.0 | 1165 | $2,300 | $1.97 | 9d | 1 | 0.91mi |
| 12007 Poinciana Blvd #205 Royal Palm Beach, FL | 2.0 | 2.0 | 1088 | $1,590 | $1.46 | 17d | 1 | 0.95mi |
| 101 Fairway Ln Royal Palm Beach, FL | 3.0 | 2.5 | 1684 | $3,300 | $1.96 | 24d | 1 | 0.96mi |
| 220 Crestwood Cir #106 Royal Palm Beach, FL | 3.0 | 2.0 | 1520 | $2,650 | $1.74 | 26d | 1 | 0.99mi |
| 133 Black Olive Cres Royal Palm Beach, FL | 3.0 | 2.0 | 1752 | $4,500 | $2.57 | 26d | 1 | 0.99mi |
| 1605 Palm Beach Trace Dr Royal Palm Beach, FL | 2.0 | 2.0 | 1201 | $2,100 | $1.75 | 14d | 1 | 1.02mi |
| 1803 Palm Beach Trace Dr Royal Palm Beach, FL | 2.0 | 2.0 | 1201 | $2,000 | $1.67 | 20d | 1 | 1.02mi |
| 280 Crestwood Cir #204 Royal Palm Beach, FL | 2.0 | 2.0 | 1024 | $2,150 | $2.10 | 17d | 1 | 1.03mi |
| 145 Prestige Dr Royal Palm Beach, FL | 3.0 | 2.0 | 1464 | $2,900 | $1.98 | 19d | 1 | 1.06mi |
| 182 Sparrow Dr Unit A Royal Palm Beach, FL | 3.0 | 2.0 | 1485 | $3,000 | $2.02 | 26d | 1 | 1.09mi |
| 113 Sandpiper Ave Royal Palm Beach, FL | 3.0 | 2.0 | 1798 | $3,500 | $1.95 | 14d | 1 | 1.13mi |
| 876 Gardenia Dr Royal Palm Beach, FL | 2.0 | 2.0 | 1502 | $3,500 | $2.33 | 26d | 1 | 1.19mi |
| 296 Sandpiper Ave Royal Palm Beach, FL | 3.0 | 2.0 | 1569 | $3,100 | $1.98 | 26d | 1 | 1.20mi |
| 330 Crestwood Cir #303 Royal Palm Beach, FL | 2.0 | 2.0 | 1306 | $2,150 | $1.65 | 26d | 1 | 1.23mi |
| 81 Westecunk Dr Royal Palm Beach, FL | 2.0 | 2.0 | 1347 | $2,550 | $1.89 | 19d | 1 | 1.25mi |
| 202 Sparrow Dr #1 Royal Palm Beach, FL | 3.0 | 2.0 | 1020 | $2,400 | $2.35 | 26d | 1 | 1.25mi |
| 210 Sparrow Dr #4 Royal Palm Beach, FL | 2.0 | 2.0 | 930 | $1,900 | $2.04 | 22d | 1 | 1.28mi |
| 212 Trace Ct Royal Palm Beach, FL | 3.0 | 2.0 | 1740 | $3,050 | $1.75 | 7d | 1 | 1.28mi |
| 340 Crestwood Cir #302 Royal Palm Beach, FL | 3.0 | 2.0 | 1306 | $2,500 | $1.91 | 1d | 1 | 1.28mi |
| 830 Royal Palm Beach Blvd Royal Palm Beach, FL | 3.0 | 2.0 | 1369 | $2,686 | $1.96 | 1d | 1 | 1.29mi |
| 310 Crestwood Ct N Unit 310 Royal Palm Beach, FL | 2.0 | 2.0 | 1112 | $2,250 | $2.02 | 6d | 1 | 1.31mi |
| 200 Crestwood Ct N #211 Royal Palm Beach, FL | 3.0 | 2.0 | 1173 | $2,400 | $2.05 | 26d | 1 | 1.33mi |
| 500 Crestwood Ct N #517 Royal Palm Beach, FL | 2.0 | 2.0 | 1200 | $2,200 | $1.83 | 20d | 1 | 1.34mi |
HOA detail
- Monthly dues
- $525 · $6,300/yr
Listing history 26 events
-
2026-06-21days on market $211,000 Active 313 DOM
-
2026-06-18days on market $211,000 Active 310 DOM
-
2026-06-17days on market $211,000 Active 309 DOM
-
2026-06-16days on market $211,000 Active 308 DOM
-
2026-06-15days on market $211,000 Active 307 DOM
-
2026-06-13pricedays on market $211,000 Active 305 DOM
-
2026-06-09days on market $219,000 Active 301 DOM
-
2026-06-07days on market $219,000 Active 299 DOM
-
2026-06-04days on market $219,000 Active 296 DOM
-
2026-06-03days on market $219,000 Active 295 DOM
-
2026-06-01days on market $219,000 Active 293 DOM
-
2026-05-31days on market $219,000 Active 292 DOM
-
2026-04-06price $219,000
-
2026-01-05price $225,000
-
2025-12-16price $229,900
-
2025-11-29price $234,900
-
2025-10-23price $239,900
-
2025-10-02price $242,900
-
2025-09-26status Active
-
2025-09-25status Pending
-
2025-09-10price $244,900
-
2025-08-11$249,900 Active
-
2015-05-05soldstatus $81,000
-
2006-01-26soldstatus $187,000
-
1996-02-27soldstatus $57,500
-
1982-08-01soldstatus $58,300
ⓘ Source: listings_history table (triggers on properties + properties_extension) + one-shot
backfill from property_details.listing_events for pre-trigger history.
Tax reassessment forecast FL · Resets to sale price
- Current annual tax
- $1,671 · $139/mo
- Projected year-2 tax
- $1,751 · $146/mo
- Expected delta
- +$80/yr (+$7/mo · 4.8%)
ⓘ Screening estimate from a state-policy table — verify with the county assessor before closing.
Climate risk First Street
- Flood 1/10 Low FEMA zone X (unshaded) · 0% chance over 30 yrs
- Wildfire 3/10 Moderate
- Heat 10/10 Extreme 7 d/yr ≥107°F today · 26 d/yr by 30 yrs out
- Wind 10/10 Extreme 99% chance of damaging wind over 30 yrs
- Air quality 2/10 Low 0 unhealthy d/yr today · 1 by 30 yrs out
Nearby sold comps map
Loading sold comps map…
Walkable amenities ~0.75 mi
Loading nearby amenities…
Taxation est. · year 1
- Rental income
- $30,478
- − Mortgage interest
- −$11,819
- − Property taxes
- −$1,671
- − Insurance
- −$1,055
- − Repairs & maintenance
- −$2,438
- − Management
- −$2,438
- − HOA
- −$6,300
- − Depreciation
- −$6,138
- Taxable loss
- −$1,382
- Est. tax savings @ 24.0%
- +$332
- After-tax cash flow
- $2,105/yr
For passive investors: Depreciation is non-cash, so a rental often shows a tax loss while cash-flowing — sheltering income. Rental losses are passive: they offset passive income freely, and up to $25,000/yr can offset ordinary (W-2) income if you actively participate and your MAGI is under $100k (phasing out to $0 by $150k); unused losses carry forward. On sale, claimed depreciation is recaptured at up to 25%, and gains may owe capital-gains tax (a 1031 exchange can defer both). Figures are a year-1 estimate at your 24.0% rate — not tax advice; consult a CPA.
Schools (NCES district)
- District
- Palm Beach
- NCES district ID
- 1201500
- Math proficiency
- 46% ▼ -16.00%
- Reading proficiency
- 53% ▼ -4.00%
- Median HH income
- $53,943
- Composite
- 42.72/100
- National rank
- #3160
- State rank
- #34 of 73 in FL
Livability — Royal Palm Beach
- Score
- 79/100
- State rank
- #135
- US rank
- #2039
Category grades
Schools grade is shown separately in the Schools card above.
Census & demographics
- Census place
- Royal Palm Beach, FL
- County
- Palm Beach County · 1,438,312 people
- City population
- 222,012
- Metro
- Miami-Fort Lauderdale-Pompano Beach, FL
- Population (ZIP)
- 76,863
- Household income
- $92,591
- Rent vs Own
- Severe rent burden
- 1870.0
Population outlook (Palm Beach County) Hauer SSP2
- Today (2025)
- 1,637,487 people
- By 2030
- 1,743,255 · +6.5%
- By 2040
- 1,948,712 · +19.0%
- By 2050
- 2,132,979 · +30.3%
- By 2075
- 2,530,027 · +54.5%
- By 2100
- 2,706,979 · +65.3%
Race, ethnicity, and origin ACS 2023
- Neighborhood character
- Diverse neighborhood (Simpson 0.70)
- Race & ethnicity
- White 44% Hispanic / Latino 24% Black 23% Two or more races 16% Asian 5%
- Hispanic origin (detail)
- Mexican 2% Puerto Rican 5% Cuban 4% Dominican 2%
- Common ancestry
- Hispanic 6% Romanian 2% Italian 1%
- Foreign-born
- 26% · Canada, Jamaica, China
- Languages at home
- 73% English-only · Spanish 17% French/Haitian/Cajun 4% Other Indo-European 2%
Political lean MEDSL · Palm Beach
- 2024 margin
- Toss-up / Even · D 50.0% · R 49.2%
- 2008→2024 swing
- -22.1pp toward R · 2008: 22.9pp · 2024: 0.8pp
- All cycles
- 2024: D+0.8 2020: D+12.8 2016: D+15.3 2012: D+17.0 2008: D+22.9
Not yet ingested
- Civics
- —
Market trends
- HPI YoY
- ▲ 17.04%
- Current HPI
- 903.78
- Rent YoY
- ▲ 0.85%
- Metro
- Miami-Fort Lauderdale-Pompano Beach, FL
- State GDP YoY
- ▲ 3.28%
- F500 in state
- 36
Industry mix (Fortune 500 HQ in FL)
| Industry | F500 HQs | Revenue |
|---|---|---|
| Industrial Technology | 2 | $29B |
|
||
| Insurance | 2 | $17B |
|
||
| Retail | 1 | $60B |
|
||
| Technology Distribution | 1 | $58B |
|
||
| Homebuilding | 1 | $35B |
|
||
| Technology Manufacturing | 1 | $35B |
|
||
Price history
+275.6% since first listed14 events — show timeline
- 2026-04-06 Price Changed $219,000 Beaches MLS
- 2026-01-05 Price Changed $225,000 Beaches MLS
- 2025-12-16 Price Changed $229,900 Beaches MLS
- 2025-11-29 Price Changed $234,900 Beaches MLS
- 2025-10-23 Price Changed $239,900 Beaches MLS
- 2025-10-02 Price Changed $242,900 Beaches MLS
- 2025-09-26 Relisted — Beaches MLS
- 2025-09-25 Pending — Beaches MLS
- 2025-09-10 Price Changed $244,900 Beaches MLS
- 2025-08-11 Listed $249,900 Beaches MLS
- 2015-05-05 Sold (Public Records) $81,000 Public Records
- 2006-01-26 Sold (Public Records) $187,000 Public Records
- 1996-02-27 Sold (Public Records) $57,500 Public Records
- 1982-08-01 Sold (Public Records) $58,300 Public Records
Property tax history
+6.8%/yrLatest (2025): $1,671 · +3.9% YoY. Source: county tax records.
Cash-flow waterfall
monthlySold comps — $/sqft
last 12 mo · ≤1 miLoading sold comps…