3700 Buchanan St #164 · Riverside, CA
Flood risk 1/10 · Minimal
- FEMA flood zone
- X (unshaded)
- Chance of flooding over 30 yrs
- 0.0%
- Est. flood insurance / yr
- $507 – $1,088
Fire risk 8/10 · Major
- Est. fire insurance / yr
- $659 – $1,223
Heat risk 7/10 · Major
- Hot days now (above 102°F)
- 6 days/yr
- Hot days in 30 yrs
- 17 days/yr
Wind risk 1/10 · Minimal
- Chance of severe wind over 30 yrs
- —
Air-quality risk 9/10 · Severe
- Unhealthy air days now
- 19 days/yr
- Unhealthy air days in 30 yrs
- 23 days/yr
Risk factors via First Street. Map © Google.
Why this score? — see what drove the C+ grade
The composite is a weighted blend of 9 inputs, each scored 0–100. Each bar is that input's sub-score; the figure is the points it added to the 100-point composite (weight × sub-score).
- Cash flow +30.0/30.0
- 1% rule +10.0/10.0
- DSCR +10.0/10.0
- Rent growth +3.4/5.0
- Schools +3.4/10.0
- Livability +3.3/5.0
- Condition / age +2.5/5.0
- ARV discount +0.0/15.0
- Appreciation +0.0/10.0
$149,900
🖨 Deal sheet 📄 Offer letter ✓ Due diligence
Listing remarks MLS
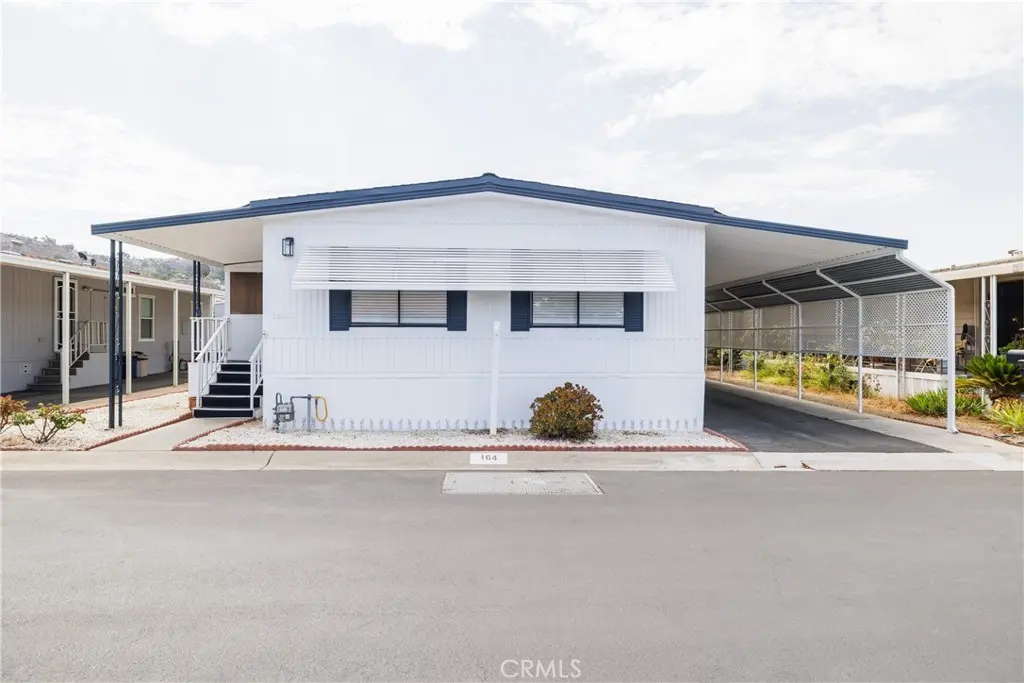
BACK ON THE MARKET AND DRASTICALLY REDUCED!!! SELLER WILL PAY THE BUYERS 1ST MONTHS SPACE RENT!! This beautifully remodeled 2 bed, 2 bath home in a great 55+ community is a must see. INCLUDES ALL NEW STAINLESS STEEL APPLICANCES INCLUDING A NEW REFRIGERATOR! This home has been completely remodeled and is simply gorgeous! Central air and central heat! 1440 SF of living space plus a large screen room and it is located in a prime location of the park. The home sets adjacent to the pool and Community Clubhouse! The beautiful, large kitchen WITH AN ADD ON SCREEN ROOM and the large master features dual sinks in the bath area. This home even has a new roof!! You must see this one!
Key facts
- Central heat
- Remodeled
- Large screen room
Tags
Neighborhood map
What this means for you Summary
Snapshot
- This is a 2-bed/1.0-bath manufactured listed at $150k.
Deal economics
- At list price, monthly cash flow is $1k ($13k/yr) — positive.
- The deal already cash-flows at list — no discount required.
- Meets the 1% rule at list price ($3k rent vs $150k).
- Recommended offer: $136k (9.0% below list) — sets the bar for market timing.
- Cap rate 15.2% vs local median 3.0% in Riverside — top-decile yield for the area; either an underpriced asset or a hidden risk that comps aren't pricing in. Stress-test before assuming the spread holds.
Location & tenants
- Location reads 66/100 on livability (#337 in CA) — a middle-class / working-renter tenant base. Strengths: housing A+, employment A-, commute B+; Watch: schools C-, health & safety D, crime F.
- Alvord Unified (urban): math 28% / reading 42% proficiency, ranked #852 of 1,400 in CA (top 61%) — families likely to look elsewhere, expect single-tenant / working-renter base with shorter leases; 63% free/reduced lunch — lower-income household profile, screen leases tightly.
- Market conditions: Rents rising (+3.4%/yr); 196 active listings in the ZIP; 19 comparable units currently listed for rent nearby; rentals leasing fast (median 5d on market — plan ~1-2 weeks tenant-placement turnaround); solid renter incomes; 9,195 units permitted in Riverside County in 2024 (1,512 in 5+ unit buildings).
- This rent runs 34% of the median local income ($96k/yr) — at the standard rent-burdened threshold; future hikes will face affordability resistance.
Forward outlook
- Local home prices are declining (-3.0%/yr); year-one equity from $1k of loan paydown is wiped out by about $4k of value loss. Plan a longer hold.
- Riverside County population projected at +22% by 2050 — long-run rental-demand tailwind backs the buy-and-hold thesis.
- At projected returns (-3.0% appreciation + 3.4% rent growth), your $42k cash investment doubles in ~4 years — after that, you're playing with house money.
Negotiation context
- It's been on market 91 days — a 9% lower offer ($136k) is reasonable based on typical stale-listing flexibility.
- 5 sale attempts since 17y ago with the ask held roughly flat each time — persistent listings suggest the price (not the market) is what's stuck; bring a comps-based counter.
- Current owner paid $16k; list at $150k implies a 837% gain — meaningful room to come down on a strong offer.
Risks & watch-outs
- Climate carrying-cost: severe wildfire risk; extreme-heat days projected 6→17/yr by 2055 (HVAC capex compounding) — expect insurance premiums to compound above CPI over the hold.
Questions for the listing agent
- It's been on market 91 days. Have you received any prior offers? Is the seller open to a 9% concession, seller financing, or rate buy-down credit?
- Built in 1973 — when were the roof, HVAC, electrical panel, plumbing, and water heater last replaced?
- Why hasn't it sold? Are there any deal-killer items the seller is aware of (foundation, flood, title, zoning, code violations)?
- Is there a deadline driving the sale (1031 exchange, divorce, estate, relocation)? That informs how much negotiation room exists.
- Crime grade is F in this area — have there been break-ins, vandalism, or insurance claims at this property in the last 3 years? What carrier currently insures it and at what premium?
- What's the average days-on-market for RENTAL listings here right now (not sales)? A rising rental-DOM trend means longer vacancies and softer asking-rent achievability than the comps imply.
- What's the recent tenant-quality profile in this submarket — average credit score on applications, eviction rate, late-payment / NSF rate, and stable-employment percentage? A property-management company in the area should have these aggregated.
- How much new for-sale + rental construction is in the pipeline within 1–3 miles? Heavy new supply typically softens prices + rents 12–24 months out; constrained supply supports both.
Investment metrics
- 1% rule
- 1.82% ✓
- Cap rate
- 15.25%
- Cash-on-cash
- 31.98%
- DSCR
- 2.42
- GRM
- 4.6
CMA / ARV
- ARV (median comp)
- $109,982
- List price
- $149,900
- Delta
- 36.29%
- Verdict
- OVERPRICED
- Comps
- 20 within 1.0 mi
Show comp detail 12 sales within ~0.75 mi
| Address | Dist | Beds/Ba | Sqft | Sold | Price | $/sf | Match |
|---|---|---|---|---|---|---|---|
| 3700 Buchanan St #132 | 0.00mi | 2/2.0 | 1,440 (0%) | 2mo | $158,000 | $110 | 94 |
| 3700 Buchanan St #28 | 0.00mi | 3/2.0 (+1) | 1,440 (0%) | 4mo | $80,000 | $56 | 88 |
| 3700 Buchanan St #108 | 0.00mi | 3/2.0 (+1) | 1,456 (+1%) | 3mo | $189,900 | $130 | 87 |
| 3700 Buchanan St #105 | 0.00mi | 2/2.0 | 1,344 (-7%) | 1mo | $86,000 | $64 | 84 |
| 3500 Buchanan St #21 | 0.27mi | 2/2.0 | 1,440 (0%) | 3mo | $87,500 | $61 | 81 |
| 3500 Buchanan St #30 | 0.16mi | 3/2.0 (+1) | 1,440 (0%) | 4mo | $81,095 | $56 | 80 |
| 3700 Buchanan St #98 | 0.00mi | 3/2.0 (+1) | 1,344 (-7%) | 2mo | $120,000 | $89 | 78 |
| 3500 Buchanan St #128 | 0.20mi | 2/2.0 | 1,488 (+3%) | 3mo | $72,000 | $48 | 78 |
| 3500 Buchanan St #230 | 0.16mi | 2/2.0 | 1,356 (-6%) | 3mo | $173,000 | $128 | 76 |
| 3500 Buchanan #73 | 0.16mi | 2/2.0 | 1,344 (-7%) | 2mo | $71,111 | $53 | 76 |
| 3500 Buchanan #103 | 0.16mi | 3/2.0 (+1) | 1,344 (-7%) | 1mo | $139,900 | $104 | 72 |
| 3663 Buchanan #112 | 0.32mi | 3/2.0 (+1) | 1,344 (-7%) | 1mo | $169,000 | $126 | 64 |
Match score weights: distance 35% · size 25% · config 20% · recency 20%. Top-matched comps best support the ARV.
Projected returns pro-forma
-3.0% appreciation · 3.41% rent growth · sell at horizon
- IRR
- 27.4%
- Equity multiple
- 2.15×
- Total profit
- $48,111
- Equity at exit
- $22,351
- IRR
- 35.2%
- Equity multiple
- 4.30×
- Total profit
- $138,456
- Equity at exit
- $12,961
Cash invested: $41,972 (down + closing). Projections, not guarantees.
Landlord ↔ Tenant lean methodology
- Overall (STATE)
- 18 Strongly Tenant-Friendly
- State California
- 18 Strongly Tenant-Friendly · D+13
- County
- — inherits STATE
- City
- — inherits STATE
ZIP-level market 92503
- Rents YoY
- 3.4%
- Active inventory
- 196
- Price-to-rent
- 4.6×
Monthly cashflow live
- Estimated rent
- $2,727 high interval (Pro) →
- Mortgage (P&I)
- −$786
- Tax est. 1.5%
- −$187 /mo · $2,248/yr
- Insurance
- −$62
- HOA
- −$0
- Vacancy / Maint / Mgmt
- −$573
- Net cashflow
- $1,118
Break-even live
UW: 25.0% down · 7.5% · 30yr · 1.5% tax · 5.0% vac · 8.0% maint · 8.0% mgmt
Financing live
Cash to close
- Down payment
- $37,475
- Closing costs
- $4,497
- Reserves months
- —
- Total cash needed
- —
Loan-product check · same deal, 3 products live
Conventional
25% down · 7.5% · 30yr
- Down + closing
- —
- Monthly P&I
- —
- Monthly cashflow
- —
- DSCR
- —
- Eligible?
- —
Personal DTI + credit; lowest rate.
DSCR
20% down · 8.5% · 30yr
- Down + closing
- —
- Monthly P&I
- —
- Monthly cashflow
- —
- DSCR
- —
- Eligible?
- —
No personal income docs; deal must DSCR.
Hard money
10% down · 12.0% · 12mo
- Down + closing
- —
- Monthly P&I
- —
- Monthly cashflow
- —
- DSCR
- —
- Eligible?
- —
Short-term bridge; refi at stabilization.
Rent comps 19 comps
| Address | Beds | Baths | Sqft | Rent | $/sqft | DOM | Units | Dist |
|---|---|---|---|---|---|---|---|---|
| 2930 Via Milano Outside Area (Inside Ca), CA | 1.0 | 2.0 | 1007 | $2,500 | $2.48 | 43d | 1 | 0.50mi |
| 371 Dylan Cir Corona, CA | 3.0 | 2.0 | 1625 | $3,500 | $2.15 | 4d | 1 | 0.65mi |
| 3713 Calle Curacso Riverside, CA | 3.0 | 2.5 | 1300 | $3,090 | $2.38 | 43d | 1 | 0.67mi |
| 3713 Calle Curacso Riverside, CA | 3.0 | 2.0 | 1300 | $3,090 | $2.38 | 16d | 1 | 0.67mi |
| 545 Hamilton Dr Corona, CA | 1.0 | 1.0 | 900 | $1,900 | $2.11 | 24d | 1 | 0.88mi |
| 3957 Pierce St Riverside, CA | 1.0–2.0 | 1.0–2.0 | 845 | $2,795 | $3.31 | 1d | 31 | 0.88mi |
| 2365 Promenade Ave Corona, CA | 1.0–2.0 | 1.0–2.0 | 892 | $2,557 | $2.87 | 1d | 18 | 1.03mi |
| 11520 Magnolia Ave Riverside, CA | 1.0–2.0 | 1.0–2.0 | 851 | $2,634 | $3.09 | 2d | 7 | 1.15mi |
| 13370 Magnolia Ave Corona, CA | 3.0 | 2.0 | 900 | $2,450 | $2.72 | 43d | 1 | 1.17mi |
| 11711 Collett Ave Riverside, CA | 1.0–3.0 | 1.0–2.0 | 1018 | $3,229 | $3.17 | 1d | 21 | 1.20mi |
| 4408 Ambs Dr Riverside, CA | 3.0 | 2.0 | 1470 | $3,040 | $2.07 | 43d | 1 | 1.26mi |
| 2235 Treehouse Ln Corona, CA | 1.0–2.0 | 1.0–2.0 | 886 | $2,770 | $3.12 | 1d | 17 | 1.27mi |
| 2361 Mary Helen St Unit 102 Corona, CA | 2.0 | 1.5 | 1000 | $2,395 | $2.40 | 1d | 1 | 1.32mi |
| 2341 Mary Helen St Unit 104 Corona, CA | 3.0 | 2.5 | 1000 | $2,550 | $2.55 | 43d | 1 | 1.33mi |
| 3827 Grant St #54 Corona, CA | 3.0 | 2.5 | 1354 | $3,250 | $2.40 | 4d | 1 | 1.35mi |
| 2215 Lakeside Pl Corona, CA | 2.0–3.0 | 1.0–2.0 | 1043 | $2,244 | $2.15 | 2d | 26 | 1.38mi |
| 2178 Stoneridge Dr Corona, CA | 1.0–3.0 | 1.0–2.0 | 946 | $2,576 | $2.72 | 1d | 10 | 1.45mi |
| 2225 Collett Ave Corona, CA | 1.0–3.0 | 1.0–2.0 | 1117 | $2,997 | $2.68 | 1d | 33 | 1.46mi |
| 2235 Indigo Hills Dr #6 Corona, CA | 2.0 | 2.0 | 1380 | $2,950 | $2.14 | 43d | 1 | 1.49mi |
Listing history 24 events
-
2026-06-18days on market $149,900 Active 91 DOM
-
2026-06-17days on market $149,900 Active 90 DOM
-
2026-06-16days on market $149,900 Active 89 DOM
-
2026-06-15days on market $149,900 Active 88 DOM
-
2026-06-13days on market $149,900 Active 86 DOM
-
2026-06-13days on market $149,900 Active 85 DOM
-
2026-06-09days on market $149,900 Active 82 DOM
-
2026-06-08days on market $149,900 Active 81 DOM
-
2026-06-07days on market $149,900 Active 80 DOM
-
2026-06-04days on market $149,900 Active 77 DOM
-
2026-06-03days on market $149,900 Active 76 DOM
-
2026-06-02days on market $149,900 Active 75 DOM
-
2026-06-01days on market $149,900 Active 74 DOM
-
2026-05-31days on market $149,900 Active 73 DOM
-
2026-03-19$149,900 Active 689-char remark
Show marketing remark (689 chars)
BACK ON THE MARKET AND DRASTICALLY REDUCED!!! SELLER WILL PAY THE BUYERS 1ST MONTHS SPACE RENT!! This beautifully remodeled 2 bed, 2 bath home in a great 55+ community is a must see. INCLUDES ALL NEW STAINLESS STEEL APPLICANCES INCLUDING A NEW REFRIGERATOR! This home has been completely remodeled and is simply gorgeous! Central air and central heat! 1440 SF of living space plus a large screen room and it is located in a prime location of the park. The home sets adjacent to the pool and Community Clubhouse! The beautiful, large kitchen WITH AN ADD ON SCREEN ROOM and the large master features dual sinks in the bath area. This home even has a new roof!! You must see this one!
-
2026-03-18historical
-
2026-03-16status Active
-
2026-03-16historical
-
2025-07-23status Active
-
2025-07-15$158,000 Active
-
2025-07-14historical
-
2009-08-25soldstatus $16,000 Closed
-
2009-07-22historical
-
2009-06-02$19,900
ⓘ Source: listings_history table (triggers on properties + properties_extension) + one-shot
backfill from property_details.listing_events for pre-trigger history.
Climate risk First Street
- Flood 1/10 Low FEMA zone X (unshaded) · 0% chance over 30 yrs
- Wildfire 8/10 Severe
- Heat 7/10 Severe 6 d/yr ≥102°F today · 17 d/yr by 30 yrs out
- Wind 1/10 Low
- Air quality 9/10 Extreme 19 unhealthy d/yr today · 23 by 30 yrs out
Nearby sold comps map
Loading sold comps map…
Walkable amenities ~0.75 mi
Loading nearby amenities…
Taxation est. · year 1
- Rental income
- $32,724
- − Mortgage interest
- −$8,397
- − Property taxes
- −$2,248
- − Insurance
- −$750
- − Repairs & maintenance
- −$2,618
- − Management
- −$2,618
- − Depreciation
- −$4,361
- Taxable income
- $11,733
- Est. tax owed @ 24.0%
- −$2,816
- After-tax cash flow
- $10,605/yr
For passive investors: Depreciation is non-cash, so a rental often shows a tax loss while cash-flowing — sheltering income. Rental losses are passive: they offset passive income freely, and up to $25,000/yr can offset ordinary (W-2) income if you actively participate and your MAGI is under $100k (phasing out to $0 by $150k); unused losses carry forward. On sale, claimed depreciation is recaptured at up to 25%, and gains may owe capital-gains tax (a 1031 exchange can defer both). Figures are a year-1 estimate at your 24.0% rate — not tax advice; consult a CPA.
Schools (NCES district)
- District
- Alvord Unified
- NCES district ID
- 0602430
- Math proficiency
- 28% ▲ 1.00%
- Reading proficiency
- 42% ▲ 2.00%
- Median HH income
- $58,965
- Composite
- 33.81/100
- National rank
- #10383
- State rank
- #852 of 1400 in CA
Livability — Riverside
- Score
- 66/100
- State rank
- #337
- US rank
- #11613
Category grades
Schools grade is shown separately in the Schools card above.
Census & demographics
- Census place
- Riverside, CA
- County
- Riverside County · 2,287,001 people
- City population
- 367,890
- Metro
- Riverside-San Bernardino-Ontario, CA
- Population (ZIP)
- 88,395
- Household income
- $96,268
- Rent vs Own
- Severe rent burden
- 2337.0
Population outlook (Riverside County) Hauer SSP2
- Today (2025)
- 2,664,475 people
- By 2030
- 2,802,692 · +5.2%
- By 2040
- 3,050,904 · +14.5%
- By 2050
- 3,256,783 · +22.2%
- By 2075
- 3,655,058 · +37.2%
- By 2100
- 3,766,594 · +41.4%
Race, ethnicity, and origin ACS 2023
- Neighborhood character
- Diverse neighborhood (Simpson 0.57)
- Race & ethnicity
- Hispanic / Latino 61% White 24% Two or more races 15% Asian 8% Black 4%
- Hispanic origin (detail)
- Mexican 52%
- Common ancestry
- Lithuanian 1% Italian 1% Slovak 1%
- Foreign-born
- 27% · Canada, Vietnam, South Korea
- Languages at home
- 44% English-only · Spanish 45% Other Indo-European 2% Tagalog/Filipino 2%
Political lean MEDSL · Riverside
- 2024 margin
- Toss-up / Even · D 48.0% · R 49.3% · Other 2.6%
- 2008→2024 swing
- -3.6pp toward R · 2008: 2.3pp · 2024: -1.3pp
- All cycles
- 2024: R+1.3 2020: D+8.0 2016: D+4.3 2012: R+0.4 2008: D+2.3
Not yet ingested
- Civics
- —
Market trends
- HPI YoY
- ▼ -414.52%
- Current HPI
- 393.407
- Rent YoY
- ▲ 3.41%
- Metro
- Riverside-San Bernardino-Ontario, CA
- State GDP YoY
- ▲ 3.21%
- F500 in state
- 116
Industry mix (Fortune 500 HQ in CA)
| Industry | F500 HQs | Revenue |
|---|---|---|
| Technology | 27 | $1,492B |
|
||
| Financial Services | 3 | $174B |
|
||
| Retail | 3 | $44B |
|
||
| Insurance | 3 | $26B |
|
||
| Media / Entertainment | 2 | $115B |
|
||
| Pharmaceuticals / Biotech | 2 | $62B |
|
||
Price history
+653.3% since first listed10 events — show timeline
- 2026-03-19 Listed $149,900 CRMLS
- 2026-03-18 Listing Removed — CRMLS
- 2026-03-16 Relisted — CRMLS
- 2026-03-16 Listing Removed — CRMLS
- 2025-07-23 Relisted — CRMLS
- 2025-07-15 Listed $158,000 CRMLS
- 2025-07-14 Coming Soon — CRMLS
- 2009-08-25 Sold (MLS) $16,000 CRMLS
- 2009-07-22 Listing Removed — CRMLS
- 2009-06-02 Listed $19,900 CRMLS
Property tax history
-4.9%/yrLatest (2025): $178 · +4.3% YoY. Source: county tax records.
Cash-flow waterfall
monthlySold comps — $/sqft
last 12 mo · ≤1 miLoading sold comps…