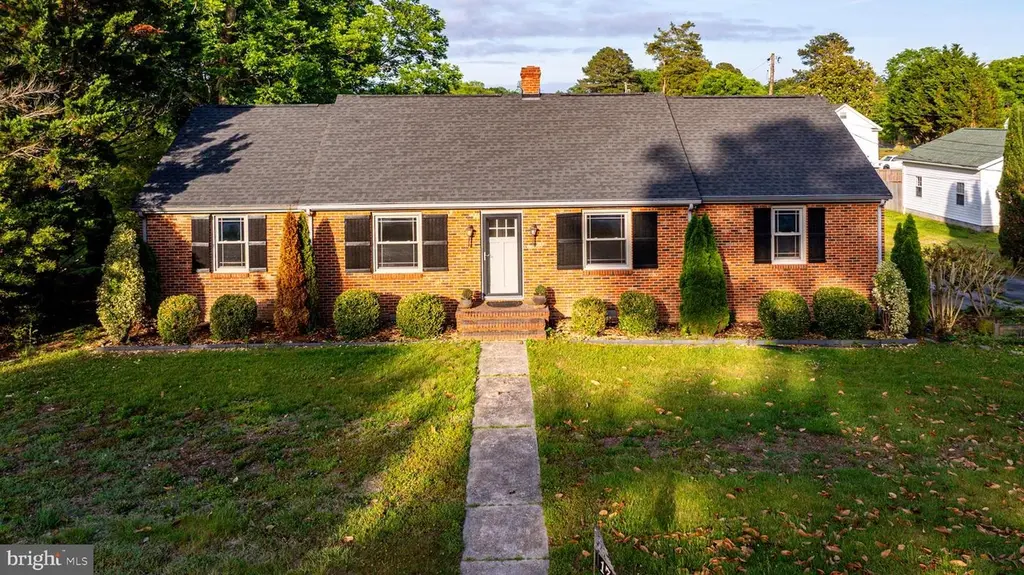
17 2nd Ave · Kilmarnock, VA
Flood risk 1/10 · Minimal
- FEMA flood zone
- X (unshaded)
- Chance of flooding over 30 yrs
- 0.0%
- Est. flood insurance / yr
- $507 – $1,088
Fire risk 4/10 · Minor
- Est. fire insurance / yr
- $666 – $1,236
Heat risk 9/10 · Severe
- Hot days now (above 103°F)
- 7 days/yr
- Hot days in 30 yrs
- 18 days/yr
Wind risk 8/10 · Major
- Chance of severe wind over 30 yrs
- 80.0%
Air-quality risk 1/10 · Minimal
- Unhealthy air days now
- 0 days/yr
- Unhealthy air days in 30 yrs
- 0 days/yr
Risk factors via First Street. Map © Google.
Why this score? — see what drove the D+ grade
The composite is a weighted blend of 9 inputs, each scored 0–100. Each bar is that input's sub-score; the figure is the points it added to the 100-point composite (weight × sub-score).
- ARV discount +14.3/15.0
- Cash flow +10.9/30.0
- Appreciation +6.7/10.0
- Schools +3.3/10.0
- DSCR +3.2/10.0
- Livability +3.1/5.0
- Rent growth +2.5/5.0
- Condition / age +2.5/5.0
- 1% rule +2.1/10.0
$289,500
🖨 Deal sheet (PDF) 📄 Offer letter ✓ Due diligence
Listing remarks
Delightful one-story brick home in the heart of Kilmarnock yet on a quiet side street. Easy maintenance with hardwood floors throughout except beautiful ceramic tile in the two full baths and roomy country kitchen. Outstanding features include a spacious living room, separate dining room, and a large primary bedroom make this a perfect floor plan for contemporary living. A real treat is the separate laundry room with service sink, coat closet and washer/dryer off the kitchen so you can keep your coats, laundry and projects organized and out of the kitchen. The level yard makes getting around and gardening fun. The seller's full home inspection is provided for your reference. Call today -- i
Key facts
- Country kitchen
- Separate dining room
- Service sink
Tags
Property features AI
Finance
- Other: Not in a federal flood zone; Ground rent paid annually
Exterior
- Parking: Driveway; Off-street parking
- Security: Grab bars (accessibility modification)
- Utilities: Public water; Public sewer; Electric service 200+ amp; Cable internet available; Cable TV available; Municipal trash not provided
- Home design: Detached single-family home; Main entrance faces west; Property considered below average condition; Fee simple ownership
- Construction: Brick veneer and frame/masonry construction (stick built); Crawl space foundation; Asphalt roof; Double-pane, double-hung windows; Building not winterized; Above-grade and below-grade structures noted; Estimated year built
- Exterior features: Front yard, rear yard and side yards; Level lot with landscaping; Patio(s)
Interior
- Kitchen: Cooktop; Country-style layout with eat-in/table space
- Bedrooms: Three bedrooms on the main level
- Flooring: Ceramic tile; Hardwood (wood floors)
- Bathrooms: Two full bathrooms (both on the main level)
- Heating & cooling: Forced air heating (central); Oil-fired heating; Central air conditioning; Electric hot water
- Interior features: Tub with shower; Built-in shelving/units; Entry-level bedroom; Country-style kitchen; Eat-in kitchen with table space; Solar tubes for natural light; Window treatments
- Laundry & utility: Washer/dryer hookups
Neighborhood map
What this means for you Summary
Snapshot
- This is a 3-bed/2.0-bath single-family listed at $290k.
Deal economics
- At list price, monthly cash flow is $-128 ($-2k/yr) — negative.
- To cash-flow at today's rent, offer at most $267k (7.8% below list).
- To meet the 1% rule (rent ≥ 1% of price), the offer needs to be $205k (29.3% below list).
- Recommended offer: $205k (29.3% below list) — sets the bar for 1% rule.
- Cap rate 5.8% vs local median 2.1% in Kilmarnock — top-decile yield for the area; either an underpriced asset or a hidden risk that comps aren't pricing in. Stress-test before assuming the spread holds.
Location & tenants
- Location reads 62/100 on livability (#407 in VA) — a middle-class / working-renter tenant base. Strengths: cost of living A+; Watch: crime D+, employment D, amenities F.
- Lancaster County Public School District (rural): math 27% / reading 49% proficiency, ranked #125 of 131 in VA (top 95%) — families likely to look elsewhere, expect single-tenant / working-renter base with shorter leases; 64% free/reduced lunch — lower-income household profile, screen leases tightly.
- Zoned schools: Lancaster Primary (math 27% / reading 37%, grade F, #992 of 1,108 statewide, top 90%, 316 students, 127% FRL); Lancaster Middle (math 22% / reading 47%, grade F, #328 of 342 statewide, top 96%, 237 students, 99% FRL); Lancaster High (math 37% / reading 57%, grade D-, #305 of 319 statewide, top 97%, 403 students, 100% FRL) — zoned schools average 109% FRL vs 64% district-wide (45 pts higher); higher-poverty schools than district average — tighter screening recommended.
- Market conditions: 95 active listings in the ZIP; 127 units permitted in Lancaster County in 2024 (0 in 5+ unit buildings).
Forward outlook
- In year one you build about $12k of equity ($2k loan paydown + $10k appreciation (3.3% local appreciation)).
- Lancaster County population projected at -34% by 2050 — secular population decline; favor cash flow + early exit over multi-decade hold.
- By year 4, paydown + projected appreciation supports a ~$39k cash-out refi (75% LTV) — recoverable capital for the next deal without selling this one.
Negotiation context
- Only 8 days on market — expect competitive offers; lowballing is unlikely to land.
Risks & watch-outs
- Watch-outs: built in 1952 — expect roof / HVAC / electrical / plumbing capex.
- Climate carrying-cost: severe wind risk, 80% chance of damaging wind over 30y; extreme-heat days projected 7→18/yr by 2055 (HVAC capex compounding) — expect insurance premiums to compound above CPI over the hold.
Questions for the listing agent
- What do current leases actually rent for vs. the listed asking? Can we see a recent rent roll and the last 12 months of T-12 income?
- Built in 1952 — when were the roof, HVAC, electrical panel, plumbing, and water heater last replaced?
- Is there a deadline driving the sale (1031 exchange, divorce, estate, relocation)? That informs how much negotiation room exists.
- Crime grade is D in this area — have there been break-ins, vandalism, or insurance claims at this property in the last 3 years? What carrier currently insures it and at what premium?
- The area grade is low — what's the realistic commute time and amenity access for the typical tenant pool here? Any planned neighborhood developments (good or bad) we should know about?
- What's the average days-on-market for RENTAL listings here right now (not sales)? A rising rental-DOM trend means longer vacancies and softer asking-rent achievability than the comps imply.
- What's the recent tenant-quality profile in this submarket — average credit score on applications, eviction rate, late-payment / NSF rate, and stable-employment percentage? A property-management company in the area should have these aggregated.
- How much new for-sale + rental construction is in the pipeline within 1–3 miles? Heavy new supply typically softens prices + rents 12–24 months out; constrained supply supports both.
Investment metrics
- 1% rule
- 0.71% ✗
- Cap rate
- 5.76%
- Cash-on-cash
- -1.89%
- DSCR
- 0.92
- GRM
- 11.8
CMA / ARV
- ARV (on-the-fly)
- $340,848
- Comps found
- 12
Show comp detail 12 sales within ~0.75 mi
| Address | Dist | Beds/Ba | Sqft | Sold | Price | $/sf | Match |
|---|---|---|---|---|---|---|---|
| 300 Irvington Rd | 0.14mi | 3/2.0 | 1,712 (+8%) | 8mo | $240,000 | $140 | 72 |
| 37 Oakland St | 0.43mi | 3/2.0 | 1,514 (-4%) | 6mo | $330,000 | $218 | 68 |
| 33 Oakland | 0.43mi | 3/2.0 | 1,649 (+4%) | 11mo | $329,900 | $200 | 63 |
| 44 Byway Dr | 0.53mi | 4/2.0 (+1) | 1,698 (+8%) | 9mo | $337,990 | $199 | 50 |
| 138 Byway Dr | 0.55mi | 4/2.0 (+1) | 1,698 (+8%) | 9mo | $333,000 | $196 | 49 |
| 98 Byway Cir | 0.54mi | 3/2.0 | 1,343 (-15%) | 3mo | $308,990 | $230 | 47 |
| 28 Byway Dr | 0.56mi | 4/2.0 (+1) | 1,698 (+8%) | 12mo | $334,990 | $197 | 46 |
| 326 Chase St | 0.52mi | 3/2.0 | 1,368 (-13%) | 10mo | $296,000 | $216 | 45 |
| 104 Byway Cir | 0.54mi | 3/2.0 | 1,343 (-15%) | 7mo | $308,990 | $230 | 44 |
| 77 Byway Cir | 0.54mi | 3/2.0 | 1,343 (-15%) | 9mo | $303,990 | $226 | 43 |
| 116 Byway Dr | 0.54mi | 3/2.0 | 1,342 (-15%) | 9mo | $289,990 | $216 | 43 |
| 5 Byway Cir | 0.59mi | 3/2.0 | 1,342 (-15%) | 9mo | $289,990 | $216 | 40 |
Match score weights: distance 35% · size 25% · config 20% · recency 20%. Top-matched comps best support the ARV.
Projected returns pro-forma
3.34% appreciation · 3.0% rent growth · sell at horizon
- IRR
- 6.7%
- Equity multiple
- 1.39×
- Total profit
- $31,874
- Equity at exit
- $135,767
- IRR
- 9.4%
- Equity multiple
- 2.46×
- Total profit
- $118,312
- Equity at exit
- $213,692
Cash invested: $81,060 (down + closing). Projections, not guarantees.
Landlord ↔ Tenant lean methodology
- Overall (STATE)
- 55 Moderately Landlord-Leaning
- State Virginia
- 55 Moderately Landlord-Leaning · D+2
- County
- — inherits STATE
- City
- — inherits STATE
ZIP-level market 22482
- Home prices YoY
- 1.5%
- Active inventory
- 95
- Price-to-rent
- 11.8×
Monthly cashflow live
- Estimated rent
- $2,047 medium interval (Pro) →
- Mortgage (P&I)
- −$1,518
- Tax from tax record
- −$106 /mo · $1,274/yr
- Insurance
- −$121
- HOA
- −$0
- Vacancy / Maint / Mgmt
- −$430
- Net cashflow
- $-128
Break-even live
Sensitivity live
| Price | -10% $36 | -5% $-46 | +0% $-128 | +5% $-210 | +10% $-292 |
|---|---|---|---|---|---|
| Rent | -10% $-289 | -5% $-209 | +0% $-128 | +5% $-47 | +10% $34 |
| Rate | -1.0pp $18 | -0.5pp $-54 | base $-128 | +0.5pp $-203 | +1.0pp $-279 |
UW: 25.0% down · 7.5% · 30yr · 1.5% tax · 5.0% vac · 8.0% maint · 8.0% mgmt
Financing live
Cash to close
- Down payment
- $72,375
- Closing costs
- $8,685
- Reserves months
- —
- Total cash needed
- —
Loan-product check · same deal, 3 products live
Conventional
25% down · 7.5% · 30yr
- Down + closing
- —
- Monthly P&I
- —
- Monthly cashflow
- —
- DSCR
- —
- Eligible?
- —
Personal DTI + credit; lowest rate.
DSCR
20% down · 8.5% · 30yr
- Down + closing
- —
- Monthly P&I
- —
- Monthly cashflow
- —
- DSCR
- —
- Eligible?
- —
No personal income docs; deal must DSCR.
Hard money
10% down · 12.0% · 12mo
- Down + closing
- —
- Monthly P&I
- —
- Monthly cashflow
- —
- DSCR
- —
- Eligible?
- —
Short-term bridge; refi at stabilization.
Listing history 8 events
-
2026-06-21days on market $289,500 Active 8 DOM
-
2026-06-18days on market $289,500 Active 6 DOM
-
2026-06-17days on market $289,500 Active 5 DOM
-
2026-06-16days on market $289,500 Active 4 DOM
-
2026-06-15days on market $289,500 Active 3 DOM
-
2026-06-15days on market $289,500 Active 2 DOM
-
2026-06-12remarks 699-char remark
-
2026-06-12$289,500 Active 1 DOM
ⓘ Source: listings_history table (triggers on properties + properties_extension) + one-shot
backfill from property_details.listing_events for pre-trigger history.
Tax reassessment forecast VA · Resets to sale price
- Current annual tax
- $1,274 · $106/mo
- Projected year-2 tax
- $2,374 · $198/mo
- Expected delta
- +$1,100/yr (+$92/mo · 86.4%)
ⓘ Screening estimate from a state-policy table — verify with the county assessor before closing.
Climate risk First Street
- Flood 1/10 Low FEMA zone X (unshaded) · 0% chance over 30 yrs
- Wildfire 4/10 Moderate
- Heat 9/10 Extreme 7 d/yr ≥103°F today · 18 d/yr by 30 yrs out
- Wind 8/10 Severe 80% chance of damaging wind over 30 yrs
- Air quality 1/10 Low 0 unhealthy d/yr today · 0 by 30 yrs out
Nearby sold comps map
Loading sold comps map…
Walkable amenities ~0.75 mi
Loading nearby amenities…
Taxation est. · year 1
- Rental income
- $24,566
- − Mortgage interest
- −$16,217
- − Property taxes
- −$1,274
- − Insurance
- −$1,448
- − Repairs & maintenance
- −$1,965
- − Management
- −$1,965
- − Depreciation
- −$8,422
- Taxable loss
- −$6,725
- Est. tax savings @ 24.0%
- +$1,614
- After-tax cash flow
- $81/yr
For passive investors: Depreciation is non-cash, so a rental often shows a tax loss while cash-flowing — sheltering income. Rental losses are passive: they offset passive income freely, and up to $25,000/yr can offset ordinary (W-2) income if you actively participate and your MAGI is under $100k (phasing out to $0 by $150k); unused losses carry forward. On sale, claimed depreciation is recaptured at up to 25%, and gains may owe capital-gains tax (a 1031 exchange can defer both). Figures are a year-1 estimate at your 24.0% rate — not tax advice; consult a CPA.
Schools (NCES district)
- District
- Lancaster County Public School District
- NCES district ID
- 5102160
- Math proficiency
- 27% ▼ -44.00%
- Reading proficiency
- 49% ▼ -20.00%
- Median HH income
- $48,210
- Composite
- 32.58/100
- National rank
- #5680
- State rank
- #125 of 131 in VA
Livability — Kilmarnock
- Score
- 62/100
- State rank
- #407
- US rank
- #17011
Category grades
Schools grade is shown separately in the Schools card above.
Census & demographics
- Census place
- Kilmarnock, VA
- Population (ZIP)
- 3,171
Population outlook (Lancaster County) Hauer SSP2
- Today (2025)
- 9,870 people
- By 2030
- 9,172 · -7.1%
- By 2040
- 7,719 · -21.8%
- By 2050
- 6,551 · -33.6%
- By 2075
- 5,110 · -48.2%
- By 2100
- 3,884 · -60.6%
Race, ethnicity, and origin ACS 2023
- Neighborhood character
- Predominantly White (75%)
- Race & ethnicity
- White 75% Black 21% Two or more races 3%
- Common ancestry
- Italian 4% Serbian 4% Slovak 2%
- Foreign-born
- 2% · South Korea
- Languages at home
- 96% English-only · French/Haitian/Cajun 2% Spanish 1% Other Indo-European 1%
Political lean MEDSL · Lancaster
- 2024 margin
- Lean R (+7.0) · D 46.1% · R 53.1%
- 2008→2024 swing
- -1.1pp toward R · 2008: -5.9pp · 2024: -7.0pp
- All cycles
- 2024: R+7.0 2020: R+4.6 2016: R+10.0 2012: R+8.6 2008: R+5.9
Not yet ingested
- Civics
- —
Market trends
- HPI YoY
- ▲ 3.34%
- Current HPI
- 232.4115
- Rent YoY
- —
- Metro
- —
- State GDP YoY
- ▲ 2.40%
- F500 in state
- 50
Industry mix (Fortune 500 HQ in VA)
| Industry | F500 HQs | Revenue |
|---|---|---|
| Aerospace / Defense | 4 | $236B |
|
||
| Technology / Defense | 3 | $32B |
|
||
| Financial Services | 2 | $176B |
|
||
| Utilities | 2 | $27B |
|
||
| Insurance | 2 | $25B |
|
||
| Technology | 2 | $15B |
|
||
Price history
1 event — show timeline
- 2026-06-12 Listed $289,500 BRIGHT MLS
Property tax history
+3.8%/yrLatest (2025): $1,274 · +0.0% YoY. Source: county tax records.
Cash-flow waterfall
monthlySold comps — $/sqft
last 12 mo · ≤1 miLoading sold comps…